Dear Dr. Chung,
Thank you for your positive remarks. Many researchers and clinicians are interested in the potential use of virtual surgery in patient-specific digital models to identify patients who are most likely to benefit from nasal surgery and to design surgical approaches that are optimally effective.1, 2 Since these computational models are based on instantaneous medical images, one key challenge is how to account for the normal physiological fluctuations in nasal patency.3 Decongestion of the nasal mucosa is an effective strategy to eliminate the confounding effect of the nasal cycle.4 However, the current standard of care is based on imaging in the natural state (i.e., without decongestion). Therefore, the motivation for our study was to develop methods to simulate the nasal cycle based on instantaneous snapshots of the nasal anatomy.5
Regarding your specific questions:
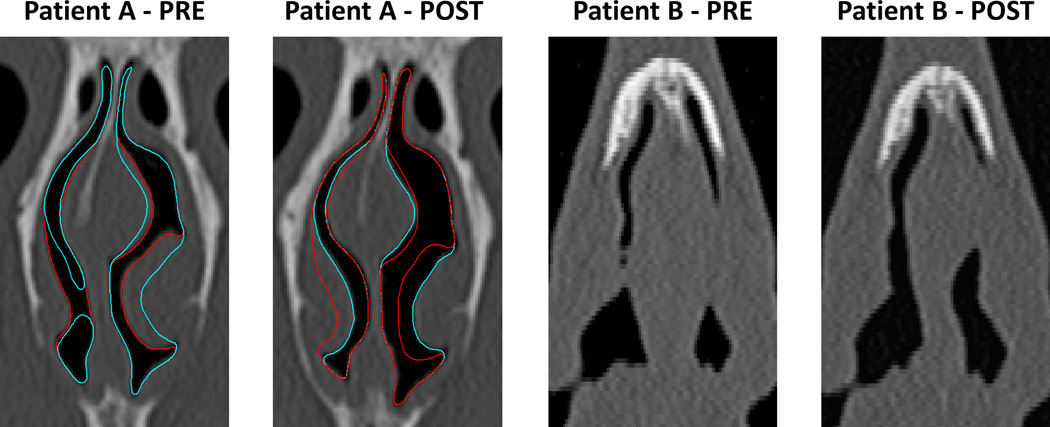
The figure below shows pre- and post-surgery coronal cross-sections at the location where septal thickness decreased the most (see Fig. 7 in our paper5). Note the greater reduction in septal thickness in Patient B. The figure also shows the outlines of the pre-surgery model (red) and pre-surgery nasal cycle 3 (NC3) model (blue) on the “Patient A – PRE” panel, and the post-surgery model (blue) and post-surgery NC3 model (red) on the “Patient A – POST” panel. Note that to simulate the nasal cycle, mucosal thickness in the inferior turbinates, middle turbinates, and septal swell body was reversed reciprocally between the left and the right cavities, while keeping the septum at a fixed location for each surgical state. For Patient B, the outlines were omitted because no mucosal swelling due to the nasal cycle was observed at this anterior coronal section (D=0).
The airspace cross-sectional areas in the anterior nose increased after surgery in both patients due to partial removal of the cartilaginous and bony septum. In other words, septal thickness was smaller post-surgery, resulting in increased nasal patency.
Figure 7 displays the change in septal thickness after septoplasty. Negative values mean that septal thickness decreased after surgery. Patient B, represented by closed circles, had a greater reduction in septal thickness post-surgery and a more anterior and more ventral septal deviation than Patient A, represented by open circles. The greater extent and more anterior location of surgery in Patient B probably explains why nasal resistance was predicted to decrease more in Patient B than in Patient A after septoplasty.
Figure 1.
Pre- and post-surgery coronal sections at the location where septal thickness decreased the most after septoplasty in 2 nasal airway obstruction patients.
Thank you for the opportunity to clarify our findings.
Guilherme J.M. Garcia, Ruchin G. Patel,
Dennis O. Frank-Ito, Julia S. Kimbell, John S. Rhee
References
- 1.Frank-Ito DO, Kimbell JS, Laud PD, Garcia GJM, Rhee JS. Predicting post-surgery nasal physiology with computational modeling: Current challenges and limitations. Otolaryngol Head Neck Surg. 2014;151(5):751–759. doi: 10.1177/0194599814547497. [DOI] [PMC free article] [PubMed] [Google Scholar]
- 2.Hariri BM, Rhee JS, Garcia GJM. Identifying patients who may benefit from inferior turbinate reduction using computer simulations. Laryngoscope. 2015;125(12):2635–2641. doi: 10.1002/lary.25367. [DOI] [PMC free article] [PubMed] [Google Scholar]
- 3.Eccles R. Nasal airflow in health and disease. Acta Otolaryngol. 2000;120:580–595. doi: 10.1080/000164800750000388. [DOI] [PubMed] [Google Scholar]
- 4.Moore M, Eccles R. Normal nasal patency: problems in obtaining standard reference values for the surgeon. The Journal of Laryngology and Otology. 2012;126:563–569. doi: 10.1017/S002221511200045X. [DOI] [PubMed] [Google Scholar]
- 5.Patel RG, Garcia GJM, Frank-Ito DO, Kimbell JS, Rhee JS. Simulating the nasal cycle with computational fluid dynamics. Otolaryngol Head Neck Surg. 2015;152(2):353–360. doi: 10.1177/0194599814559385. [DOI] [PMC free article] [PubMed] [Google Scholar]


