Abstract
Context
Inhaled nanoparticles can migrate to the brain via the olfactory bulb, as demonstrated in experiments in several animal species. This route of exposure may be the mechanism behind the correlation between air pollution and human neurodegenerative diseases, including Alzheimer’s disease and Parkinson’s disease.
Objectives
This manuscript aims to (1) estimate the dose of inhaled nanoparticles that deposit in the human olfactory epithelium during nasal breathing at rest and (2) compare the olfactory dose in humans with our earlier dose estimates for rats.
Materials and methods
An anatomically-accurate model of the human nasal cavity was developed based on computed tomography scans. The deposition of 1–100 nm particles in the whole nasal cavity and its olfactory region were estimated via computational fluid dynamics (CFD) simulations. Our CFD methods were validated by comparing our numerical predictions for whole-nose deposition with experimental data and previous CFD studies in the literature.
Results
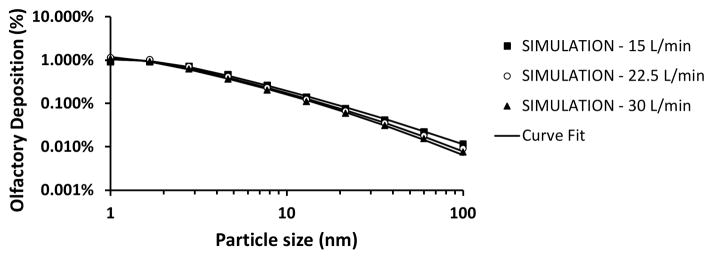
In humans, olfactory dose of inhaled nanoparticles is highest for 1–2 nm particles with approximately 1% of inhaled particles depositing in the olfactory region. As particle size grows to 100 nm, olfactory deposition decreases to 0.01% of inhaled particles.
Discussion and conclusion
Our results suggest that the percentage of inhaled particles that deposit in the olfactory region is lower in humans than in rats. However, olfactory dose per unit surface area is estimated to be higher in humans due to their larger minute volume. These dose estimates are important for risk assessment and dose-response studies investigating the neurotoxicity of inhaled nanoparticles.
Keywords: nanoparticle toxicology, neurotoxicity, olfactory epithelium, nasal filtration, particle deposition, risk assessment, computational fluid dynamics simulations, ultrafine aerosols
INTRODUCTION
Inhalation of nanoparticles from air pollution and occupational exposure may cause neurodegeneration and brain damage (Calderon-Garciduenas et al., 2002; Sunderman, 2001). The route taken by inhaled nanoparticles to reach the brain is unclear, but there is increasing evidence that metal nanoparticles depositing in the olfactory region in the nasal cavity can migrate to the brain along the olfactory bulb (Hopkins et al., 2014; Oberdorster et al., 2004). Although this nose-to-brain route of exposure has not been confirmed in humans, it has been demonstrated in non-human primates (Dorman et al., 2006). Evidence suggests that a Parkinson-like neurological syndrome in workers exposed to manganese-containing welding fumes may be associated with nose-to-brain transport of manganese particles (Antonini et al., 2006). As part of the investigation of this potential route of exposure, it is essential to quantify the dose of inhaled nanoparticles that deposit in the olfactory region in both humans and rats.
In vivo measurements of olfactory dose in humans are challenging due to ethical concerns and the difficulty of distinguishing particles deposited in the olfactory region from those deposited elsewhere in the nose. In vitro studies using nasal replicas are also challenging because they require sectional analysis to distinguish olfactory from non-olfactory deposition (Schroeter et al., 2015). Although both in vivo and in vitro experiments are feasible, currently there are no publications in the literature reporting experiments that quantify nanoparticle deposition in the human olfactory region.
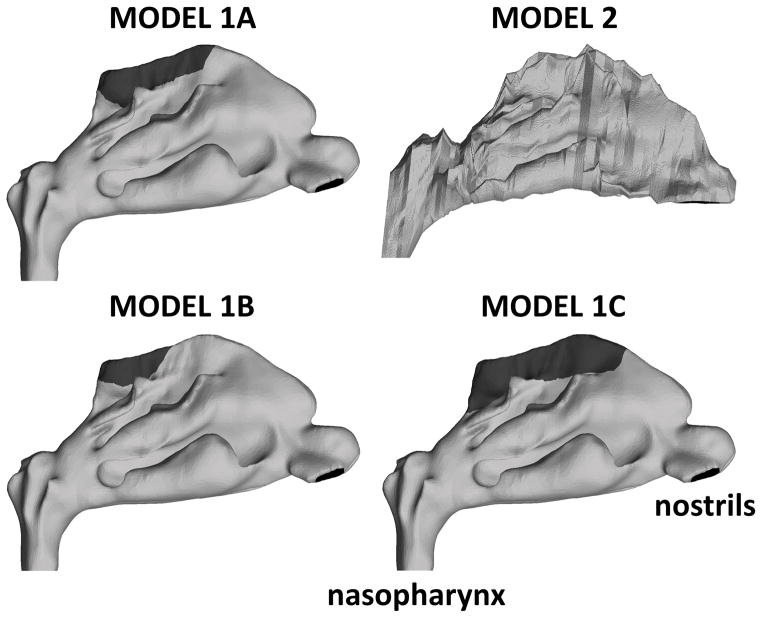
Computational models of airflow and particle transport represent an attractive tool to evaluate nanoparticle deposition in the human olfactory region. The location of the various nasal epithelial types, including the olfactory epithelium, can be mapped onto a 3-dimensional reconstruction of the nasal passages (Figure 1). Computational fluid dynamics (CFD) can be used to simulate airflow patterns and to quantify the dose of inhaled particles deposing in the olfactory region. Another advantage of computational methods is that, once the anatomic model is created and the numerical methods validated, several particle sizes and breathing rates can be simulated with minimal additional cost. To the best of our knowledge, the only estimates of nanoparticle deposition in the human olfactory region to date were reported by Shi and coworkers (2008) (Shi et al., 2008). They used a computational model to simulate nasal airflow and particle transport and predicted that olfactory deposition is highest for 1–2 nm particles with 0.5% of inhaled particles depositing in the olfactory region. Importantly, differences between humans and rats regarding the olfactory dose of inhaled nanoparticles have not yet been reported in the literature, despite the fact that toxicological studies often use experiments in laboratory animals to infer the risk inhaled nanoparticles pose to humans.
Figure 1. Lateral view of computational models of the human nasal passages.
Models 1A, 1B, and 1C represent the same nasal geometry, but with olfactory regions (dark gray) of different sizes. Model 2 represents the nasal anatomy of a different individual. It was used for validating our computational methods because several in vitro experiments and CFD simulations in the literature were based on this nasal geometry (see text for details).
In a previous study, we investigated olfactory deposition of 1–100 nm particles in a computational model of the nasal cavity of an 18-week-old F344 rat (Garcia & Kimbell, 2009). Olfactory deposition was maximal for 3- to 4-nm particles, with 6–9% of inhaled material depositing in the olfactory region. The present manuscript extends our previous efforts by estimating the olfactory dose of inhaled nanoparticles in humans and by comparing the olfactory dose in humans vs. rats.
METHODS
Anatomic models
Nanoparticle deposition in the human nasal cavity was simulated in the nasal anatomies of two healthy adults (Figure 1). Model 1, which has higher anatomic resolution (voxel size of 0.39 mm × 0.39 mm × 0.70 mm), was built from CT scans of a 37 year-old woman (Garcia et al., 2009). Model 2, which has lower anatomic resolution (3-mm spacing between coronal sections), was built from MRI scans of a 53 year-old male (Subramanian et al., 1998). The geometry of model 2 has been used in several experimental studies (Garcia et al., 2009; Kelly et al., 2004a; Kelly et al., 2004b; Schroeter et al., 2015; Shah et al., 2015; Swift, 1991; Zwartz & Guilmette, 2001) and computational studies (Kimbell et al., 2007; Schroeter et al., 2006; Xi et al., 2015; Xi & Longest, 2008) of particle deposition in the human nose. Thus, model 2 was included in this study solely for experimental validation of our numerical methods and for comparison with previous computational studies. Olfactory dose of inhaled nanoparticles is reported only for model 1. To investigate the effect of olfactory surface area on olfactory dose estimates, three variations of model 1 were investigated. Models 1A, 1B, and 1C had the exact same geometry, except for the extent of the region mapped as olfactory epithelium on the model surface (Figure 1).
The olfactory region of the nasal cavity is the part of the nasal passages covered by olfactory epithelium. At present, olfactory epithelium is primarily identified histologically by its distinctive cellular composition and structure (Harkema et al., 2006), including its brownish-yellow color compared to the pink color of the surrounding respiratory epithelium (Jackson, 1960). Experimental imaging studies suggest that it is possible to visualize the location of the olfactory epithelium in vivo using ultra-high resolution optical coherence tomography (Cobb et al., 2010), or by performing single photon emission computed tomography (SPECT) after nasal administration of a thallium-201 saline solution (Shiga et al., 2011). However, the most precise location and extent of this epithelial type is currently obtained from serial histological sections of nasal specimens. Thus, the location and extent of the olfactory epithelium was mapped by Schroeter and colleagues (5) onto the walls of Model 1 based on the descriptions and figures published by Lang (1989) (see Model 1A in Figure 1).
Due to the uncertainty of the precise location of the olfactory epithelium, and also to facilitate comparison of dose estimates with previous publications, two variants of this model were investigated. Models 1B and 1C had half the olfactory surface area and twice the olfactory surface area of the original model, respectively. The olfactory surface areas of models 1A, 1B, and 1C are respectively 11.2 cm2, 5.6 cm2, and 22.0 cm2. Given that the total surface area (nasal cavity and nasopharynx) was 201.6 cm2 in model 1, the olfactory region corresponded to 5.5%, 2.8%, and 10.9% of the total surface area in models 1A, 1B, and 1C, respectively.
Computational Methods
Computational fluid dynamics was used to simulate airflow and nanoparticle deposition in the nasal cavity and, more specifically, the olfactory region. Computational meshes with approximately 5 million hybrid cells (tetrahedral cells with 4 prism layers near the walls) were used. CFD simulations were conducted in Fluent™ 14.0 (ANSYS Inc., Lebanon, NH). Inspiratory airflow was modeled as laminar and at steady-state. Since diffusional transport mechanisms dominate for 1–100 nm particles, an Eulerian approach was used for particle transport. In this approach, the trajectories of individual particles are not computed; instead, inhaled nanoparticles are modeled as a uniform mixture of particles and air, much as gas transport is modeled. Details regarding the simulations are described in the Appendix A.
To assess the effects of particle size and airflow rate on deposition, simulations were performed for a series of particle sizes and inhalation rates. The resting minute volume of an adult human is approximately 7.5 L/min for cyclic flow, which corresponds to an average inspiratory flow of 15 L/min. We therefore investigated three different steady-state airflow rates, namely, 15 L/min, 22.5 L/min and 30 L/min, corresponding to 1x, 1.5x, and 2x the resting flow rate. This range of flow rates includes the average worker rate of 9.6 m3/8-hr-day = 20 L/min (ICRP66, 1994).
Particle diffusivity is affected by particle shape, but irregular shape seldom produces more than a two-fold change in any property (Hinds, 1999), unless the particles of interest are highly elongated. Particle diffusivity becomes orientation-dependent with elongated shape, in which case particle rotation must be modeled (Dastan et al., 2014). For this project, all particles were assumed spherical in shape. Appropriate diffusion coefficients for spherical particles were computed for each particle size as described by Hinds (1999) (Table 1). Ten different particle sizes were used ranging from 1 to 100 nm (Table 1). These particle sizes were chosen so that data points are uniformly spaced in a log-log plot.
Table 1.
Diameter (dp) and diffusivity (Dp) of the nanoparticles used in the simulations. The 10 particle sizes were chosen so that log(dp) is uniformly spaced. The particle diffusivities were calculated according to the equations in Hinds (1999).
| Particle diameter (nm) | Particle diffusivity (cm2/s) |
|---|---|
|
| |
| 1.00 | 5.32 × 10⁻² |
| 1.67 | 1.91 × 10⁻² |
| 2.78 | 6.91 × 10⁻³ |
| 4.64 | 2.49 × 10⁻³ |
| 7.74 | 9.04 × 10⁻⁴ |
| 12.92 | 3.29 × 10⁻⁴ |
| 21.54 | 1.21 × 10⁻⁴ |
| 35.94 | 4.52 × 10⁻⁵ |
| 59.95 | 1.73 × 10⁻⁵ |
| 100.00 | 6.94 × 10⁻⁶ |
Curve Fitting
Nasal deposition efficiency was plotted against particle size for each flow rate. Curves were fitted to the data so that deposition could be estimated for other sets of parameters that were not simulated. Ingham (Ingham, 1991) proposed that nanoparticle deposition in the nose is a function of two non-dimensional parameters: Schmidt number (Sc = ν/Dp, where ν is the kinematic viscosity of air and Dp is the particle diffusivity; (Hinds, 1999)) and Δ (a diffusion parameter defined as Δ = DpL/(4 U R2), where L is a characteristic length of the geometry, U is average inlet velocity and R is airway radius; (Zhang & Martonen, 1997)). Because a single nasal geometry was investigated, the parameters L and R were constant, so that nasal deposition efficiency was a function only of the particle diffusivity Dp and the average velocity U. Since U is proportional to the airflow rate Q, namely U ~ Q/R2, nasal deposition in our model was a function of Dp and Q alone. Total nasal deposition (η) was fitted with the equation (Cheng, 2003)
| (1) |
where Dp is in cm2/s, Q is in L/min, and a, b, and c are fitted parameters. Note that this functional form is in agreement with the requirement that 0 ≤ η ≤ 1. All curve-fitting analyses were made using SigmaPlot™ 12.0 (Systat Software, Inc., San Jose, CA).
The olfactory fraction of total nasal deposition (FO) was also computed from the CFD simulations and plotted against particle size. Curves were fitted to the simulation data using the formula
| (2) |
where FO is the percentage of the particles depositing in the nose that deposited in the olfactory region and a, b, c, and d are fitted parameters. Once the total nasal deposition efficiency (η) and the olfactory fraction (FO) were calculated, the olfactory deposition efficiency (ηO) was obtained by
| (3) |
where ηO is the fraction of inhaled particles that deposit in the olfactory region.
Hotspots of particle deposition are of particular interest in toxicology and risk assessment. To describe the spatial patterns of particle deposition, the locations of deposited particles were visualized using Fluent™ 14.0 and Fieldview™ 13.2 (Intelligent Light, Rutherford, NJ). To characterize the effect of particle size on the spatial distribution of deposited particles, the wall mass flux was averaged along the perimeter of coronal cross-sections and plotted as a function of the distance from the nostrils for different particle sizes.
Olfactory Deposition in Rats
Garcia and Kimbell (2009) used the computational methods described above to estimate the olfactory dose of inhaled nanoparticles for an 18-week-old male F344 rat (body mass = 315g). These estimates for the rat are used here for comparison with humans.
RESULTS
Deposition of Nanoparticles in the Human Nose
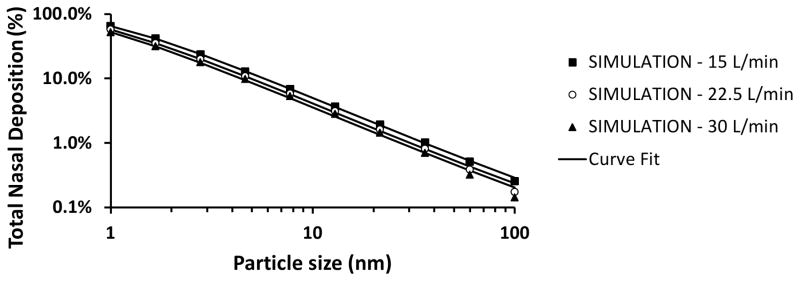
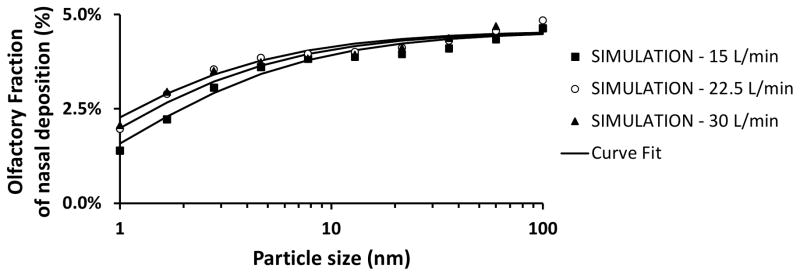
Total nasal deposition of nanoparticles was predicted to decrease with increasing particle size and airflow rate (Figure 2). Total deposition in the human nose was estimated to be approximately 65% for 1 nm particles, 4% for 13 nm particles, and 0.3% for 100 nm particles during resting breathing (Q = 15 L/min). Although the total nasal deposition efficiency decreases with increasing particle size, among the particles that do deposit, the larger nanoparticles have a higher probability of depositing in the olfactory region (Figure 3). Olfactory deposition was predicted to be maximal for 1–2 nm particles, with approximately 1% of inhaled particles depositing in the olfactory region. For particles larger than 3 nm, olfactory deposition decreased with increasing particle size (Figure 4).
Figure 2. Deposition efficiency of inhaled nanoparticles in a human nasal cavity model (Model 1A).
Symbols correspond to simulation results, while lines depict fitted curves.
Figure 3. Olfactory fraction of total nasal deposition in a human nasal cavity model (Model 1A).
Symbols correspond to simulation results, while lines depict fitted curves.
Figure 4. Olfactory deposition efficiency in a human nasal cavity model (Model 1A).
Symbols correspond to simulation results, while lines depict fitted curves.
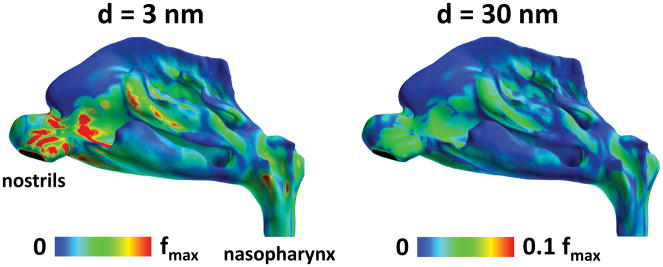
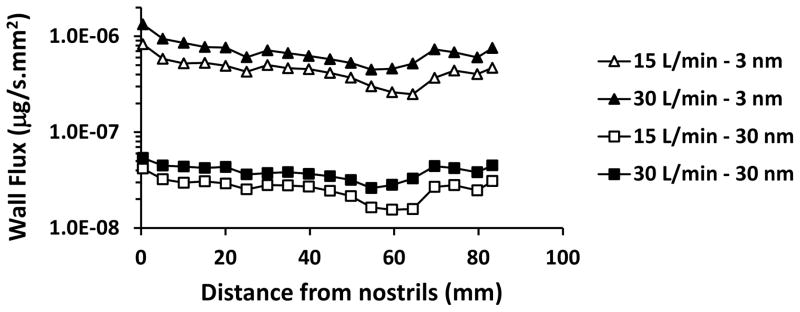
The spatial distribution of deposited particles in the human nose was examined for 3 and 30 nm particles (Figure 5). Hotspots of deposition of 3 nm particles were observed on the nasal vestibule, anterior septum, anterior edge of the inferior and middle turbinates, inferior margin of the middle and superior turbinates, and posterior wall of the nasopharynx. Higher deposition in the anterior nose relative to the posterior nose is further illustrated by considering wall flux averaged over the perimeter of serial coronal sections between the nostrils and the nasopharynx (Figure 6). A similar anterior-to-posterior gradient was observed for the wall fluxes of 30 nm particles, but regional differences were much smaller than for 3 nm particles. In other words, larger nanoparticles had a more uniform deposition throughout the nasal passages, which explains why, for 10–100 nm nanoparticles, the olfactory fraction of deposited particles is similar to the percentage of surface area covered by olfactory epithelium (5.5% in Model 1A) (Figure 3).
Figure 5. Deposition patterns of 3-nm and 30-nm particles in the human nasal cavity for a 15 L/min inhalation rate.
While 3-nm particles deposit preferentially in the anterior nose, 30-nm particles deposit more uniformly in the nasal passages. The atmospheric nanoparticle concentration was 160 μg/m3, which is the experimental atmospheric concentration in Oberdorster et al. (2004). Colormap scale: fmax = 1.3 × 10⁻⁶ μg/s.mm2.
Figure 6. Dose of nanoparticles deposited in the human nasal cavity averaged along the perimeter of coronal cross sections and plotted as a function of the distance from the nostrils.
The atmospheric nanoparticle concentration was 160 μg/m3, which is the experimental atmospheric concentration in Oberdorster et al. (2004). Curves are shown for airflow rates of 15L/min, and particles sizes of 3 nm and 30 nm.
Curve Fits
The best fit for total nasal deposition was obtained with equation (1) with a = 28.3 ± 0.7, b = 0.659 ± 0.002, and c = 0.502 ± 0.007, which provided a correlation coefficient of r = 0.9999 (Figure 2). The high value of the correlation coefficient implies that equation (4) accurately describes how airflow rate and particle size affect total nasal deposition. The best fit for olfactory fraction of deposited particles was obtained with equation (2) with a = 0.046 ± 0.001, b = 19 ± 11, c = 0.42 ± 0.05, and d = 0.60 ± 0.16, which provided a correlation coefficient of r = 0.946 (Figure 3). The fitting curves for olfactory deposition (ηO) were obtained via ηO = FO η (equation (3)) using the fitted curves for total nasal deposition (η) and olfactory fraction (F0). Therefore, the curves in Figure 4 were not fitted to CFD olfactory deposition but are rather estimates from the product of curves fitted to the total deposition and olfactory fraction data.
Effect of olfactory surface area
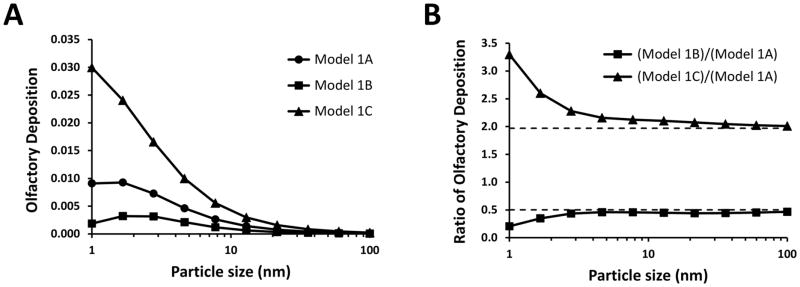
Given that the boundaries of the olfactory region in Model 1A were based on a textbook (Lang, 1989), rather than on actual measurements, the size of the olfactory region was varied to investigate its effect on dose estimates (Figure 1). Olfactory surface area had a significant effect on the olfactory dose estimates, with larger olfactory regions resulting in greater olfactory depositions (Figure 7A). Due to the more uniform spatial deposition of 10 to 100 nm particles (Figures 5 and 6), olfactory deposition was nearly proportional to olfactory surface area in this particle size range (Figure 7B). In contrast, the effect of olfactory surface area was non-linear for the smallest nanoparticles. For example, olfactory deposition of 1-nm particles was 3.3 times greater in model C than in model A, thus exceeding the 2-fold difference in olfactory surface area between these models.
Figure 7. Effect of varying the olfactory surface area on estimates of olfactory deposition.
All models have the same geometry (Figure 1), except for variations in the olfactory surface area. (A) Olfactory deposition efficiency of 1–100 nm particles. (B) The ratio of olfactory deposition efficiency in Model 1B to olfactory deposition efficiency in Model 1A is approximately 0.50, which is the ratio between their olfactory surface areas. Similarly, the ratio of olfactory deposition efficiency in Model 1C to Model 1A is approximately 2.0, which is the ratio between their olfactory surface areas. The olfactory surface areas in Models 1A, 1B, and 1C are 11.2 cm2, 5.6 cm2, and 22.0 cm2, respectively.
Experimental validation
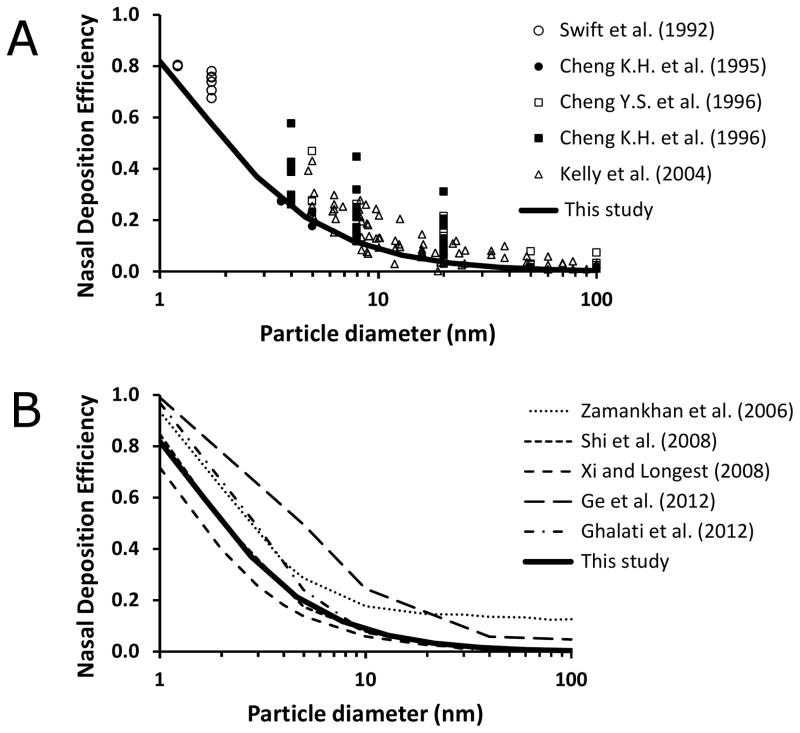
There are no experimental studies in the literature that report olfactory dose of inhaled nanoparticles in humans. However, we can validate our results for total nasal deposition by comparing them to experimental measurements (Figure 8). Total nasal deposition of inhaled nanoparticles has been studied experimentally in vivo (Cheng et al., 1996; Cheng et al., 1996) and in vitro using nasal replica casts based on medical images (Cheng et al., 1995; Kelly et al., 2004b; Swift et al., 1992). In addition, previous CFD studies have studied nanoparticle transport in the human nose computationally. Several in vitro and in silico studies were based on the nasal geometry of model 2 (Ge et al., 2012; Ghalati et al., 2012; Shi et al., 2008; Xi & Longest, 2008; Zamankhan et al., 2006). As illustrated in Figure 8, our CFD results are in good agreement with these previous experimental and computational studies.
Figure 8. Total deposition efficiency of inhaled nanoparticles in the human nasal cavity (Model 2) for a 10 L/min steady-state inhalation rate.
(A) In vivo and in vitro experimental data from the literature compared to our computational results. (B) Computational studies from the literature compared to our results.
References: (Cheng et al., 1996; Cheng et al., 1995; Cheng et al., 1996; Ge et al., 2012; Ghalati et al., 2012; Kelly et al., 2004b; Shi et al., 2008; Swift et al., 1992; Xi & Longest, 2008; Zamankhan et al., 2006).
Humans vs. Rats
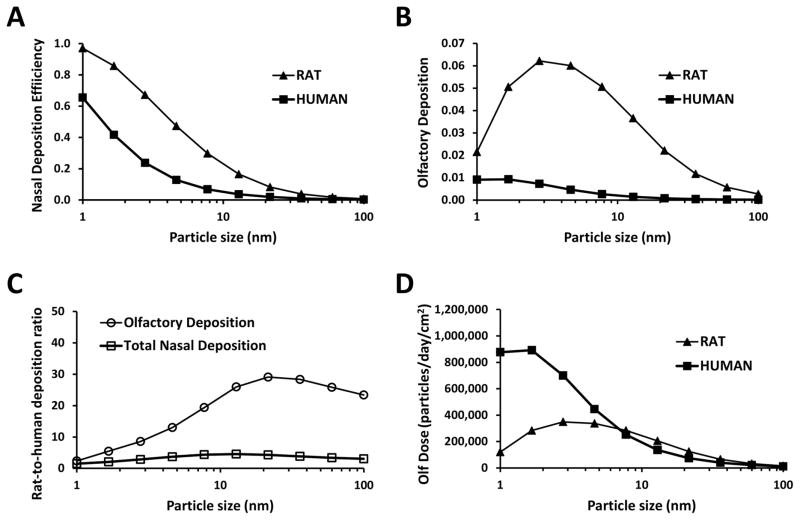
Nasal and olfactory deposition of 1–100 nm particles are compared in humans vs. rats in Figure 9. Nasal deposition efficiency of nanoparticles is greater in rats (Figure 9A). This is explained by their narrower nasal airways, which reduce the distance particles have to diffuse before they hit a wall. Olfactory deposition efficiency is also higher in the rat (Figure 9B), which is partially due to the narrower airways in the rat, but also due to the proportionally larger olfactory region in rodents (the olfactory epithelium covers 40% of the nasal cavity in the rat, but only 5.5% in the human) (Garcia & Kimbell, 2009). Olfactory deposition efficiency is only 2-fold higher in rats as compared to humans for 1-nm particles, but the rat-to-human ratio increases to 25-fold for 10-nm to 100-nm particles (Figure 9C).
Figure 9. Nanoparticle deposition in the nasal cavity and olfactory region of humans and rats at rest (breathing rate = 15 L/min in humans and 0.58 L/min in rats).
(A) Total nasal deposition efficiency. (B) Olfactory deposition efficiency. (C) Rat-to-human ratio of nasal deposition efficiency and olfactory deposition efficiency. (D) Number of particles deposited in the olfactory region (olfactory dose) for an atmospheric concentration of 10,000 particles/cm3, assuming an uniform particle distribution in the 1–100nm range. Data for rats taken from Garcia and Kimbell (2009).
Finally, let us illustrate how the olfactory deposition efficiency may be used in risk assessment studies. In polluted urban centers, air concentration of nanoparticles is about 10,000 particles/cm3 (Kittelson et al., 2004). For simplicity, we assume a uniform distribution of particle sizes in the range of 1–100 nm, so that for a given particle size (e.g., 5 nm particles), the nanoparticle concentration is 100 particles/cm3. Given the differences in minute volumes (7.5 L/min in humans vs. 0.288 L/min in rats) and olfactory deposition efficiency of 5-nm particles (0.46% in humans vs. 6.0% in rats), the number of 5-nm particles that deposit in the olfactory region is estimated to be 5.0 × 10⁶/day in humans and 2.5 × 10⁶/day in rats. This shows that the number of particles reaching the olfactory region is only about 2 times greater in humans than rats, despite the 26-fold higher inhalation rate in humans. Taking into account the olfactory surface areas (11.2 cm2 in humans vs. 7.4 cm2 in rats), olfactory dose per unit surface area is estimated to be 4.5 × 10⁵ particles/day/cm2 in humans and 3.4 × 10⁵ particles/day/cm2 in rats. Thus, despite the higher olfactory deposition efficiency in rats, the olfactory dose per unit surface area for 5-nm particles is higher in humans due their higher inhalation rate. The olfactory dose per unit surface area has a complex dependency on particle size, with higher olfactory doses in humans in the 1–7 nm size range, but similar doses in rats and humans in the 7–100 nm range (Figure 9D).
DISCUSSION
Nose-to-brain translocation of nanoparticles is a topic of great interest due to the toxic effects some nanomaterials have on the central nervous system (Block & Calderon-Garciduenas, 2009; Lucchini et al., 2012). The existence of the nose-to-brain pathway of particle transport has been demonstrated by inhalation experiments in laboratory animals, which observed that nanoparticles depositing on the olfactory epithelium can migrate to the brain along the olfactory bulb (Balasubramanian et al., 2013; Elder et al., 2006; Hopkins et al., 2014; Kao et al., 2012; Moshkin et al., 2014; Oberdorster et al., 2004; Sunderman, 2001; Yu et al., 2007). Experimental studies instilling an aqueous solution of nanoparticles into the nasal cavity of rodents have corroborated this nose-to-brain migration of nanoparticles (Liu et al., 2014; Wang et al., 2008). Once toxic nanoparticles reach the brain, multiple adverse effects can be observed, including inflammation, oxidative stress, and neurodegeneration (Calderon-Garciduenas et al., 2014; Liu et al., 2014). Air pollution and occupational exposure are likely the two main sources of exposure to airborne nanoparticles.
Air pollution is of great concern because children living in polluted urban environments (e.g., Mexico City) have been shown to have neuroinflammation, neurodegeneration, and delays in cognitive development as compared to children who live a less polluted city (Calderon-Garciduenas et al., 2008; Calderon-Garciduenas et al., 2008; Calderon-Garciduenas et al., 2014). Strong evidence suggests that ultrafine particles in air pollution can reach the brain through the olfactory pathway, and that this is a key mechanism for the neurodegenerative effects of air pollution (Block & Calderon-Garciduenas, 2009; Calderon-Garciduenas et al., 2002; Calderon-Garciduenas et al., 2003; Calderon-Garciduenas et al., 2008). Also, it has been suggested that Alzheimer’s and Parkinson’s diseases may be associated with airborne agents entering the brain through the olfactory pathway, but this remains speculative (Block & Calderon-Garciduenas, 2009; Doty, 2008). Occupational exposure to inhaled nanoparticles is also of great concern. Inhaled metal nanoparticles have several toxic effects in the nasal cavity, including loss of olfactory acuity (Sunderman, 2001). In particular, workers exposed to welding fumes rich in manganese sometimes develop a Parkinson-like neurological disease (Antonini et al., 2006). Finally, we must mention that there is growing interest in the nose-to-brain pathway as a route for delivering drugs to the brain (Illum, 2000; Mistry et al., 2009; Mittal et al., 2014; Sood et al., 2014).
Nasal deposition of inhaled nanoparticles has been extensively studied in humans through in vivo experiments in healthy volunteers (Cheng et al., 1996; Cheng et al., 1996), in vitro experiments in nasal replica casts based on cadavers or imaging of live subjects (Cheng et al., 1995; Golshahi et al., 2010; Gradon & Yu, 1989; Kelly et al., 2004b; Swift et al., 1992), and computational models (Ge et al., 2012; Ghalati et al., 2012; Inthavong et al., 2011; Martonen et al., 2003; Shi et al., 2006; Shi et al., 2008; Si et al., 2013; Wang et al., 2009; Xi et al., 2012; Xi & Longest, 2008; Yu et al., 1998; Zamankhan et al., 2006; Zhang & Kleinstreuer, 2011). These studies have shown that nasal filtration of nanoparticles is governed by diffusion, with the smallest particles having the greatest diffusivity and therefore the greatest nasal deposition. The human nose filters less than 5% of 100-nm particles, but more than 80% of 1-nm particles during resting breathing (Cheng, 2003).
Recent computational studies investigated a myriad of topics related to nanoparticle deposition in the respiratory tract, including targeted olfactory deposition of 150 nm particles with a nebulization catheter for direct nose-to-brain drug delivery (Si et al., 2013), age-related changes in nasal deposition efficiency (Xi et al., 2012), how the exclusion of the paranasal sinuses from anatomic models affects dose estimates (Ge et al., 2012), and the accuracy of different numerical methods (Shi et al., 2006; Shi et al., 2008; Xi & Longest, 2008; Zhang & Kleinstreuer, 2011). However, the olfactory dose of inhaled 1–100 nm particles was not investigated in the majority of these studies.
To our knowledge, Shi et al. (2008) reported the only estimate of nanoparticle deposition in the human olfactory region previously available in the literature (Shi et al., 2008). These authors applied CFD to simulate nasal airflow and nanoparticle transport numerically. Olfactory deposition was predicted to be maximum at 0.55% of inhaled particles for 2 nm particles. In our study, olfactory deposition in Model 1A was 0.93% of inhaled 2 nm particles (Figure 4), which is almost twice as high as the olfactory dose estimated by Shi et al. (2008). Although Shi et al. (2008) did not explicitly mention the olfactory surface area of their CFD model, a visual comparison of Figure 1(b) in their paper with Figure 1 in this manuscript reveals that their CFD model had a much smaller olfactory region than our Model 1A, and possibly their olfactory surface area was closer to our Model 1B. Given that the olfactory dose is strongly dependent on the extent of the olfactory surface area (Figure 7), we attribute any differences between our estimates of olfactory dose and the results reported by Shi et al. (2008) to differences in the surface area of the region mapped as olfactory epithelium on the CFD model and to inter-individual nasal anatomy differences.
This is the first study to compare the olfactory dose of inhaled nanoparticles in humans vs. rats. One strength of our study is that the same methods were used to simulate particle transport in humans and rats, thus allowing a consistent comparison of the olfactory dose in the two species. As expected based on the relationship between particle size and particle diffusivity, olfactory deposition efficiency was highest for the smallest particles in both humans and rats (Figure 9B). However, olfactory deposition efficiency was predicted to be substantially higher in rats than in humans. Olfactory deposition efficiency of 1-nm particles was predicted to be 2-fold higher in rats than in humans, with the rat-to-human difference increasing with particle size, to the point that olfactory deposition efficiency of 100-nm particles is 23-fold higher in rats than in humans (Figure 9C). However, due to the 26-fold higher inhalation rate in humans as compared to rats, the actual dose of nanoparticles deposited in the olfactory region was higher in humans in the 1–7nm size range. Olfactory dose of 7–100nm was similar in rats and humans (Figure 9D). One should note that the comparisons above refer to the average olfactory dose in humans and rats. Doses in other anatomic regions, including localized doses within the olfactory region, or the whole-nose average dose, may not follow the same pattern (see Appendix B).
In addition to our previous study of nanoparticle deposition in a rat model (Garcia & Kimbell, 2009), other CFD studies have also reported estimates of olfactory dose of 1–100 nm in rodents, including two studies on rats (Jiang & Zhao, 2010; Schroeter et al., 2012) and one study on a mouse and a mole vole (Moshkin et al., 2014). Generally speaking, these studies reported that olfactory dose is maximum for 3–5 nm particles with approximately 6–20% of inhaled particles in this size range depositing in the olfactory region of rodents. Interestingly, Moshkin and coauthors (2014) reported that olfactory deposition was lower in the subterranean mole vole, despite total nasal deposition being higher in that species. They interpreted the lower olfactory deposition in the subterranean mole vole as an adaption to habitation in an environment with dust excess aimed at decreasing nose-to-brain particle transport.
Some limitations of our research methods should be noted. First, the extent of the olfactory surface area in Model 1A (11.2 cm2) was based on the anatomy book by Lang (1989), and may not reflect the exact extent of the olfactory region in the subject whose CT scans were used to develop the CFD model. Second, the Eulerian model used to compute particle transport in this study may under-predict nasal deposition for particle sizes greater than 50 nm (Ge et al., 2012; Xi & Longest, 2008). However, previous research has shown that the Eulerian model is accurate for particle sizes < 50nm (Ge et al., 2012; Xi & Longest, 2008), which is the size range with the greatest olfactory deposition. Third, our simulations assumed that nasal airflow is laminar. This assumption is supported by experimental measurements of air velocity in nasal replicas which show that nasal airflow is mostly laminar for airflow rates below 30 L/min (Chung et al., 2006; Kelly et al., 2000), and by CFD studies comparing laminar vs. turbulent models which concluded that nasal airflow is mostly laminar for rest breathing (Shi et al., 2008; Xi & Longest, 2008). Finally, experimental studies have reported interindividual variation in total nasal deposition due to differences in nasal anatomy (Cheng et al., 1996; Cheng et al., 1995; Cheng et al., 1996; Golshahi et al., 2010). Likewise, olfactory dose is expected to vary among individuals. Therefore, our olfactory dose estimates, which were based on a single individual, may not be representative of average deposition in the larger population.
CONCLUSIONS
The dose of inhaled nanoparticles that deposit in the human olfactory region was estimated for particle sizes from 1 to 100 nm and inhalation rates from 15 to 30 L/min. Our simulations suggest that olfactory deposition is greatest for 1–2 nm particles with approximately 1% of inhaled particles of that size range depositing in the olfactory region. When compared to humans, rats have a higher olfactory deposition efficiency, which can be attributed to (a) the olfactory epithelium accounting for a larger percentage of the nasal surface area in rodents and (b) the narrower nasal passages in the rat. However, after taking into account the higher minute volume in humans, olfactory dose per unit surface area is greater in humans than in rats for 1–10 nm particles. The dosimetry data and fitted curves reported for humans in this manuscript and for rats in Garcia and Kimbell (2009) are expected to be useful in the risk assessment of inhaled nanoparticle toxicity.
Acknowledgments
We are grateful to Dr. Eileen Kuempel (National Institute for Occupational Safety and Health) for providing the original concept for this study.
APPENDIX A
Conservation of mass and momentum for laminar incompressible flow is described, respectively, by the equations
where u⃗ = u⃗(x, y, z, t) is the velocity vector, t is time, ρ = 1.2 kg/m3 is air density, p is pressure, and μ = 1.8 × 10⁻⁵ Pa.s is air dynamic viscosity (White, 2008). The transport of nanoparticles in air is described by the convection-diffusion equation
where Cp = Cp(x, y, z, t) is the nanoparticle concentration in air and Dp is the mass-diffusivity of nanoparticles in air (Hinds, 1999). The mass-diffusivity Dp is a function of particle size (Table 1).
Steady-state versions of these equations were solved on a 16-processor workstation (Dell Precision T7600, Intel Xeon 3.10 GHz, 64 GB of RAM) using Fluent™ 14. Fluent™ utilizes the finite volume method to solve the differential equations numerically. The segregated solver with SIMPLEC pressure-velocity coupling and second-order upwind discretization were utilized. Since the physical properties of the air-particle mixture are assumed constant, an uncoupled solution strategy was employed, namely the flow field was obtained first and then the convection-diffusion equation was solved.
The boundary conditions for the flow simulations were (a) inlet pressure = 0 at the nostrils, (b) no-slip at the walls, and (c) outlet pressure set to a negative value such that the desired airflow rate (15 L/min, 22.5 L/min, or 30 L/min) was reached. For the nanoparticle transport simulations, the concentration of nanoparticles at the nostril was set to unity (Cp|nostrils = 1), while the concentration was set to 0 at the walls (Cp|wall = 0). For the calculation of wall fluxes, the simulation results were re-scaled for an inlet nanoparticle concentration of 160 μg/m3, which is the atmospheric nanoparticle concentration used by Oberdorster et al (2004) in their experimental investigation of nanoparticle deposition in the rat.
Fluent™ does not provide the option of plotting nanoparticle flux (equivalent to nanoparticle deposition; flux = (−Dp∇Cp)wall) at the domain walls. Therefore, a User-Defined Function (UDF) was used to make the nanoparticle flux data available as a User-Defined Memory Variable so that wall fluxes could be visualized and hotspots of nanoparticle deposition described. The UDF also reported the fraction of nanoparticles deposited in each of the 2 epithelium types (olfactory vs. non-olfactory), so that olfactory deposition could be quantified. The olfactory deposition obtained via the UDF was confirmed by typing “report species” in Fluent’s Text User Interface (TUI).
APPENDIX B
To gain insight into the different nanoparticle deposition patterns in humans and rats, let us calculate the average olfactory dose as a function of the inhalation rate and olfactory surface area. Conservation of mass requires that
where Øinlet, Øoutlet, and Øwall (units of kg/s) are respectively the mass fluxes of nanoparticles through the nostrils (inlet), nasopharynx (outlet), and nasal walls, QV (units of m3/s) is the volumetric airflow rate, and cinlet and coutlet (units of kg/m3) are respectively the nanoparticle concentrations at the nostrils and nasopharynx. Thus, the average wall flux per unit surface area (Ø̄nose) is given by
where SA is the total nasal surface area. Using the definition of total deposition efficiency (η = 1 − coutlet/cinlet), the average wall flux in the nasal cavity can be written as
Similarly, the average wall flux per unit surface area in the olfactory region (Ø̄olf) is
where ηO is the olfactory deposition efficiency and SAO is the olfactory surface area.
The above equations, in combination with the total deposition [η = η(QV, SA)] and olfactory deposition [ηO = ηO(QV, SAO)] derived from CFD simulations, allow us to compare the average nanoparticle doses in rats and humans. For example, based on the minute volumes of humans and rats ( and ), the total nasal surface area of the human and rat nasal models (SAhuman = 201.6 cm2 and SArat = 18.3 cm2), and the total deposition efficiency of 5 nm particles in humans and rats (ηhuman = 0.128 and ηrat = 0.473), we estimate that for 5 nm particles the average nasal dose per unit surface area is higher in rats than in humans:
In contrast, we estimate that the average olfactory dose per unit surface area is higher in humans than in rats for 5 nm particles:
where the olfactory areas ( and ) and olfactory depositions of 5 nm particles ( and ) were used. These results illustrate that the average olfactory dose (per unit surface area) can be higher in humans than in rats, despite the fact the average nasal dose (per unit surface area) is higher in rats than in humans.
Footnotes
DECLARATION OF INTEREST
Financial support provided by the National Institute for Occupational Safety and Health (NIOSH) via purchase order #211-2008-M-27275. This publication was supported in part by the National Center for Research Resources, the National Center for Advancing Translational Sciences, and the Office of the Director, National Institutes of Health, through Grant Number 8KL2TR000056. Its contents are solely the responsibility of the authors and do not necessarily represent the official views of the NIH.
References
- Antonini JM, Santamaria AB, Jenkins NT, Albini E, Lucchini R. Fate of manganese associated with the inhalation of welding fumes: potential neurological effects. Neurotoxicology. 2006;27:304–310. doi: 10.1016/j.neuro.2005.09.001. [DOI] [PubMed] [Google Scholar]
- Balasubramanian SK, Poh KW, Ong CN, Kreyling WG, Ong WY, Yu LE. The effect of primary particle size on biodistribution of inhaled gold nano-agglomerates. Biomaterials. 2013;34:5439–5452. doi: 10.1016/j.biomaterials.2013.03.080. [DOI] [PubMed] [Google Scholar]
- Block ML, Calderon-Garciduenas L. Air pollution: mechanisms of neuroinflammation and CNS disease. Trends in neurosciences. 2009;32:506–516. doi: 10.1016/j.tins.2009.05.009. [DOI] [PMC free article] [PubMed] [Google Scholar]
- Calderon-Garciduenas L, Azzarelli B, Acuna H, Garcia R, Gambling TM, Osnaya N, Monroy S, DELT MR, Carson JL, Villarreal-Calderon A, Rewcastle B. Air pollution and brain damage. Toxicologic pathology. 2002;30:373–389. doi: 10.1080/01926230252929954. [DOI] [PubMed] [Google Scholar]
- Calderon-Garciduenas L, Maronpot RR, Torres-Jardon R, Henriquez-Roldan C, Schoonhoven R, Acuna-Ayala H, Villarreal-Calderon A, Nakamura J, Fernando R, Reed W, Azzarelli B, Swenberg JA. DNA damage in nasal and brain tissues of canines exposed to air pollutants is associated with evidence of chronic brain inflammation and neurodegeneration. Toxicologic pathology. 2003;31:524–538. doi: 10.1080/01926230390226645. [DOI] [PubMed] [Google Scholar]
- Calderon-Garciduenas L, Mora-Tiscareno A, Ontiveros E, Gomez-Garza G, Barragan-Mejia G, Broadway J, Chapman S, Valencia-Salazar G, Jewells V, Maronpot RR, Henriquez-Roldan C, Perez-Guille B, Torres-Jardon R, Herrit L, Brooks D, Osnaya-Brizuela N, Monroy ME, Gonzalez-Maciel A, Reynoso-Robles R, Villarreal-Calderon R, Solt AC, Engle RW. Air pollution, cognitive deficits and brain abnormalities: A pilot study with children and dogs. Brain Cognition. 2008;68:117–127. doi: 10.1016/j.bandc.2008.04.008. [DOI] [PubMed] [Google Scholar]
- Calderon-Garciduenas L, Solt AC, Henriquez-Roldan C, Torres-Jardon R, Nuse B, Herritt L, Villarreal-Calderon R, Osnaya N, Stone I, Garcia R, Brooks DM, Gonzalez-Maciel A, Reynoso-Robles R, Delgado-Chavez R, Reed W. Long-term air pollution exposure is associated with neuroinflammation, an altered innate immune response, disruption of the blood-brain barrier, ultrafine particulate deposition, and accumulation of amyloid beta-42 and alpha-synuclein in children and young adults. Toxicologic pathology. 2008;36:289–310. doi: 10.1177/0192623307313011. [DOI] [PubMed] [Google Scholar]
- Calderon-Garciduenas L, Torres-Jardon R, Kulesza RJ, Park SB, D’Angiulli A. Air pollution and detrimental effects on children’s brain. The need for a multidisciplinary approach to the issue complexity and challenges. Frontiers in human neuroscience. 2014;8:613. doi: 10.3389/fnhum.2014.00613. [DOI] [PMC free article] [PubMed] [Google Scholar]
- Cheng KH, Cheng YS, Yeh HC, Guilmette RA, Simpson SQ, Yang YH, Swift DL. In vivo measurements of nasal airway dimensions and ultrafine aerosol deposition in the human nasal and oral airways. J Aerosol Sci. 1996;27:785–801. [Google Scholar]
- Cheng KH, Cheng YS, Yeh HC, Swift DL. Deposition of ultrafine aerosols in the head airways during natural breathing and during simulated breath holding using replicate human upper airway casts. Aerosol Sci Technol. 1995;23:465–474. [Google Scholar]
- Cheng YS. Aerosol deposition in the extrathoracic region. Aerosol Sci Tech. 2003;37:659–671. doi: 10.1080/02786820300906. [DOI] [PMC free article] [PubMed] [Google Scholar]
- Cheng YS, Smith SM, Yeh HC, Kim DB, Cheng KH, Swift DL. Deposition of ultrafine aerosols and thoron progeny in replicas of nasal airways of young children. Aerosol Sci Technol. 1995;23:541–552. [Google Scholar]
- Cheng YS, Yeh HC, Guilmette RA, Simpson SQ, Cheng KH, Swift DL. Nasal deposition of ultrafine particles in human volunteers and its relationship to airway geometry. Aerosol Sci Tech. 1996;25:274–291. [Google Scholar]
- Chung SK, Son YR, Shin SJ, Kim SK. Nasal airflow during respiratory cycle. American journal of rhinology. 2006;20:379–384. doi: 10.2500/ajr.2006.20.2890. [DOI] [PubMed] [Google Scholar]
- Cobb MJ, Hwang JH, Upton MP, Chen Y, Oelschlager BK, Wood DE, Kimmey MB, Li X. Imaging of subsquamous Barrett’s epithelium with ultrahigh-resolution optical coherence tomography: a histologic correlation study. Gastrointestinal endoscopy. 2010;71:223–230. doi: 10.1016/j.gie.2009.07.005. [DOI] [PMC free article] [PubMed] [Google Scholar]
- Dastan A, Abouali O, Ahmadi G. CFD simulation of total and regional fiber deposition in human nasal cavities. J Aerosol Sci. 2014;69:132–149. [Google Scholar]
- Dorman DC, Struve MF, Wong BA, Dye JA, Robertson ID. Correlation of brain magnetic resonance imaging changes with pallidal manganese concentrations in rhesus monkeys following subchronic manganese inhalation. Toxicological sciences: an official journal of the Society of Toxicology. 2006;92:219–227. doi: 10.1093/toxsci/kfj209. [DOI] [PubMed] [Google Scholar]
- Doty RL. The olfactory vector hypothesis of neurodegenerative disease: is it viable? Annals of neurology. 2008;63:7–15. doi: 10.1002/ana.21327. [DOI] [PubMed] [Google Scholar]
- Elder A, Gelein R, Silva V, Feikert T, Opanashuk L, Carter J, Potter R, Maynard A, Finkelstein J, Oberdorster G. Translocation of inhaled ultrafine manganese oxide particles to the central nervous system. Environ Health Persp. 2006;114:1172–1178. doi: 10.1289/ehp.9030. [DOI] [PMC free article] [PubMed] [Google Scholar]
- Garcia GJ, Kimbell JS. Deposition of inhaled nanoparticles in the rat nasal passages: dose to the olfactory region. Inhal Toxicol. 2009;21:1165–1175. doi: 10.3109/08958370902882713. [DOI] [PubMed] [Google Scholar]
- Garcia GJ, Schroeter JD, Segal RA, Stanek J, Foureman GL, Kimbell JS. Dosimetry of nasal uptake of water-soluble and reactive gases: a first study of interhuman variability. Inhal Toxicol. 2009;21:607–618. doi: 10.1080/08958370802320186. [DOI] [PubMed] [Google Scholar]
- Garcia GJ, Tewksbury EW, Wong BA, Kimbell JS. Interindividual variability in nasal filtration as a function of nasal cavity geometry. Journal of aerosol medicine and pulmonary drug delivery. 2009;22:139–155. doi: 10.1089/jamp.2008.0713. [DOI] [PubMed] [Google Scholar]
- Ge QJ, Inthavong K, Tu JY. Local deposition fractions of ultrafine particles in a human nasal-sinus cavity CFD model. Inhal Toxicol. 2012;24:492–505. doi: 10.3109/08958378.2012.694494. [DOI] [PubMed] [Google Scholar]
- Ghalati PF, Keshavarzian E, Abouali O, Faramarzi A, Tu JY, Shakibafard A. Numerical analysis of micro- and nano-particle deposition in a realistic human upper airway. Comput Biol Med. 2012;42:39–49. doi: 10.1016/j.compbiomed.2011.10.005. [DOI] [PubMed] [Google Scholar]
- Golshahi L, Finlay WH, Olfert JS, Thompson RB, Noga ML. Deposition of Inhaled Ultrafine Aerosols in Replicas of Nasal Airways of Infants. Aerosol Sci Tech. 2010;44:741–752. [Google Scholar]
- Gradon L, Yu CP. Diffusional particle depositioon in the human nose and mouth. Aerosol Sci Technol. 1989;11:213–220. [Google Scholar]
- Harkema JR, Carey SA, Wagner JG. The nose revisited: a brief review of the comparative structure, function, and toxicologic pathology of the nasal epithelium. Toxicologic pathology. 2006;34:252–269. doi: 10.1080/01926230600713475. [DOI] [PubMed] [Google Scholar]
- Hinds WC. Aerosol technology: properties, behavior, and measurement of airborne particles. John Wiley & Sons, Inc; 1999. [Google Scholar]
- Hopkins LE, Patchin ES, Chiu PL, Brandenberger C, Smiley-Jewell S, Pinkerton KE. Nose-to-brain transport of aerosolised quantum dots following acute exposure. Nanotoxicology. 2014;8:885–893. doi: 10.3109/17435390.2013.842267. [DOI] [PMC free article] [PubMed] [Google Scholar]
- Illum L. Transport of drugs from the nasal cavity to the central nervous system. European journal of pharmaceutical sciences: official journal of the European Federation for Pharmaceutical Sciences. 2000;11:1–18. doi: 10.1016/s0928-0987(00)00087-7. [DOI] [PubMed] [Google Scholar]
- Ingham DB. Diffusion of Aerosols in the Entrance Region of a Smooth Cylindrical Pipe. J Aerosol Sci. 1991;22:253–257. [Google Scholar]
- Inthavong K, Zhang K, Tu JY. Numerical modelling of nanoparticle deposition in the nasal cavity and the tracheobronchial airway. Comput Method Biomec. 2011;14:633–643. doi: 10.1080/10255842.2010.493510. [DOI] [PubMed] [Google Scholar]
- Jackson RT. The olfactory pigment. Journal of cellular and comparative physiology. 1960;55:143–147. doi: 10.1002/jcp.1030550205. [DOI] [PubMed] [Google Scholar]
- Jiang J, Zhao K. Airflow and nanoparticle deposition in rat nose under various breathing and sniffing conditions: a computational evaluation of the unsteady effect. J Aerosol Sci. 2010;41:1030–1043. doi: 10.1016/j.jaerosci.2010.06.005. [DOI] [PMC free article] [PubMed] [Google Scholar]
- Kao YY, Cheng TJ, Yang DM, Wang CT, Chiung YM, Liu PS. Demonstration of an olfactory bulb-brain translocation pathway for ZnO nanoparticles in rodent cells in vitro and in vivo. Journal of molecular neuroscience: MN. 2012;48:464–471. doi: 10.1007/s12031-012-9756-y. [DOI] [PubMed] [Google Scholar]
- Kelly JT, Asgharian B, Kimbell JS, Wong BA. Particle deposition in human nasal airway replicas manufactured by different methods. Part I: inertial regime particles. Aerosol Sci Tech. 2004a;38:1063–1071. [Google Scholar]
- Kelly JT, Asgharian B, Kimbell JS, Wong BA. Particle deposition in human nasal airway replicas manufactured by different methods. Part II: ultrafine particles. Aerosol Sci Tech. 2004b;38:1072–1079. [Google Scholar]
- Kelly JT, Prasad AK, Wexler AS. Detailed flow patterns in the nasal cavity. Journal of Applied Physiology. 2000;89:323–337. doi: 10.1152/jappl.2000.89.1.323. [DOI] [PubMed] [Google Scholar]
- Kimbell JS, Segal RA, Asgharian B, Wong BA, Schroeter JD, Southall JP, Dickens CJ, Brace G, Miller FJ. Characterization of deposition from nasal spray devices using a computational fluid dynamics model of the human nasal passages. Journal of aerosol medicine: the official journal of the International Society for Aerosols in Medicine. 2007;20:59–74. doi: 10.1089/jam.2006.0531. [DOI] [PubMed] [Google Scholar]
- Kittelson DB, Watts WF, Johnson JP. Nanoparticle emissions on Minnesota highways. Atmos Environ. 2004;38:9–19. [Google Scholar]
- Lang J. Clinical Anatomy of the nose, nasal cavity and paranasal sinuses. New York: Thieme Medical Publishers, Inc; 1989. [Google Scholar]
- Liu Y, Gao Y, Liu Y, Li B, Chen C, Wu G. Oxidative stress and acute changes in murine brain tissues after nasal instillation of copper particles with different sizes. Journal of nanoscience and nanotechnology. 2014;14:4534–4540. doi: 10.1166/jnn.2014.8290. [DOI] [PubMed] [Google Scholar]
- Lucchini RG, Dorman DC, Elder A, Veronesi B. Neurological impacts from inhalation of pollutants and the nose-brain connection. Neurotoxicology. 2012;33:838–841. doi: 10.1016/j.neuro.2011.12.001. [DOI] [PMC free article] [PubMed] [Google Scholar]
- Martonen TB, Zhang Z, Yue G, Musante CJ. Fine particle deposition within human nasal airways. Inhal Toxicol. 2003;15:283–303. doi: 10.1080/08958370304458. [DOI] [PubMed] [Google Scholar]
- Mistry A, Stolnik S, Illum L. Nanoparticles for direct nose-to-brain delivery of drugs. International journal of pharmaceutics. 2009;379:146–157. doi: 10.1016/j.ijpharm.2009.06.019. [DOI] [PubMed] [Google Scholar]
- Mittal D, Ali A, Md S, Baboota S, Sahni JK, Ali J. Insights into direct nose to brain delivery: current status and future perspective. Drug delivery. 2014;21:75–86. doi: 10.3109/10717544.2013.838713. [DOI] [PubMed] [Google Scholar]
- Moshkin MP, Petrovski DV, Akulov AE, Romashchenko AV, Gerlinskaya LA, Ganimedov VL, Muchnaya MI, Sadovsky AS, Koptyug IV, Savelov AA, Troitsky SY, Moshkn YM, Bukhtiyarov VI, Kolchanov NA, Sagdeev RZ, Fomin VM. Nasal aerodynamics protects brain and lung from inhaled dust in subterranean diggers, Ellobius talpinus. Proceedings. Biological sciences/The Royal Society. 2014;281 doi: 10.1098/rspb.2014.0919. [DOI] [PMC free article] [PubMed] [Google Scholar]
- Oberdorster G, Sharp Z, Atudorei V, Elder A, Gelein R, Kreyling W, Cox C. Translocation of inhaled ultrafine particles to the brain. Inhal Toxicol. 2004;16:437–445. doi: 10.1080/08958370490439597. [DOI] [PubMed] [Google Scholar]
- Schroeter JD, Kimbell JS, Asgharian B. Analysis of particle deposition in the turbinate and olfactory regions using a human nasal computational fluid dynamics model. Journal of aerosol medicine: the official journal of the International Society for Aerosols in Medicine. 2006;19:301–313. doi: 10.1089/jam.2006.19.301. [DOI] [PubMed] [Google Scholar]
- Schroeter JD, Kimbell JS, Asgharian B, Tewksbury EW, Singal M. Computational fluid dynamics simulations of submicrometer and micrometer particle deposition in the nasal passages of a Sprague-Dawley rat. J Aerosol Sci. 2012;43:31–44. [Google Scholar]
- Schroeter JD, Tewksbury EW, Wong BA, Kimbell JS. Experimental measurements and computational predictions of regional particle deposition in a sectional nasal model. Journal of aerosol medicine and pulmonary drug delivery. 2015;28:20–29. doi: 10.1089/jamp.2013.1084. [DOI] [PubMed] [Google Scholar]
- Shah SA, Berger RL, McDermott J, Gupta P, Monteith D, Connor A, Lin W. Regional deposition of mometasone furoate nasal spray suspension in humans. Allergy and asthma proceedings: the official journal of regional and state allergy societies. 2015;36:48–57. doi: 10.2500/aap.2015.36.3817. [DOI] [PubMed] [Google Scholar]
- Shi H, Kleinstreuer C, Zhang Z. Laminar airflow and nanoparticle or vapor deposition in a human nasal cavity model. Journal of Biomechanical Engineering-Transactions of the Asme. 2006;128:697–706. doi: 10.1115/1.2244574. [DOI] [PubMed] [Google Scholar]
- Shi H, Kleinstreuer C, Zhang Z. Dilute suspension flow with nanoparticle deposition in a representative nasal airway model. Phys Fluids. 2008;20:013301. [Google Scholar]
- Shiga H, Taki J, Yamada M, Washiyama K, Amano R, Matsuura Y, Matsui O, Tatsutomi S, Yagi S, Tsuchida A, Yoshizaki T, Furukawa M, Kinuya S, Miwa T. Evaluation of the olfactory nerve transport function by SPECT-MRI fusion image with nasal thallium-201 administration. Molecular imaging and biology: MIB: the official publication of the Academy of Molecular Imaging. 2011;13:1262–1266. doi: 10.1007/s11307-010-0461-3. [DOI] [PubMed] [Google Scholar]
- Si XA, Xi J, Kim J, Zhou Y, Zhong H. Modeling of release position and ventilation effects on olfactory aerosol drug delivery. Respiratory physiology & neurobiology. 2013;186:22–32. doi: 10.1016/j.resp.2012.12.005. [DOI] [PubMed] [Google Scholar]
- Sood S, Jain K, Gowthamarajan K. Intranasal therapeutic strategies for management of Alzheimer’s disease. Journal of drug targeting. 2014;22:279–294. doi: 10.3109/1061186X.2013.876644. [DOI] [PubMed] [Google Scholar]
- Sunderman FW., Jr Nasal toxicity, carcinogenicity, and olfactory uptake of metals. Annals of clinical and laboratory science. 2001;31:3–24. [PubMed] [Google Scholar]
- Swift DL. Inspiratory inertial deposition of aerosols in human nasal airway replicate casts: implication for the proposed NCRP lung model. Radiation Protection Dosimetry. 1991;38:29–34. [Google Scholar]
- Swift DL, Montassier N, Hopke PK, Kim KH, Cheng YS, Su YF, Yeh HC, Strong JC. Inspiratory Deposition of Ultrafine Particles in Human Nasal Replicate Casts. J Aerosol Sci. 1992;23:65–72. [Google Scholar]
- Wang JX, Liu Y, Jiao F, Lao F, Li W, Gu YQ, Li YF, Ge CC, Zhou GQ, Li B, Zhao YL, Chai ZF, Chen CY. Time-dependent translocation and potential impairment on central nervous system by intranasally instilled TiO2 nanoparticles. Toxicology. 2008;254:82–90. doi: 10.1016/j.tox.2008.09.014. [DOI] [PubMed] [Google Scholar]
- Wang SM, Inthavong K, Wen J, Tu JY, Xue CL. Comparison of micron- and nanoparticle deposition patterns in a realistic human nasal cavity. Respiratory physiology & neurobiology. 2009;166:142–151. doi: 10.1016/j.resp.2009.02.014. [DOI] [PubMed] [Google Scholar]
- White FM. Fluid Mechanics. New York: McGraw-Hill Companies, Inc; 2008. [Google Scholar]
- Xi J, Berlinski A, Zhou Y, Greenberg B, Ou X. Breathing resistance and ultrafine particle deposition in nasal-laryngeal airways of a newborn, an infant, a child, and an adult. Annals of biomedical engineering. 2012;40:2579–2595. doi: 10.1007/s10439-012-0603-7. [DOI] [PubMed] [Google Scholar]
- Xi J, Zhang Z, Si XA. Improving intranasal delivery of neurological nanomedicine to the olfactory region using magnetophoretic guidance of microsphere carriers. International journal of nanomedicine. 2015;10:1211–1222. doi: 10.2147/IJN.S77520. [DOI] [PMC free article] [PubMed] [Google Scholar]
- Xi JX, Longest PW. Numerical predictions of submicrometer aerosol deposition in the nasal cavity using a novel drift flux approach. Int J Heat Mass Tran. 2008;51:5562–5577. [Google Scholar]
- Yu G, Zhang Z, Lessmann R. Fluid flow and particle diffusion in the human upper respiratory system. Aerosol Sci Tech. 1998;28:146–158. [Google Scholar]
- Yu LE, Yung LYL, Ong CN, Tan YL, Balasubramaniam KS, Hartono D, Shui GH, Wenk MR, Ong WY. Translocation and effects of gold nanoparticles after inhalation exposure in rats. Nanotoxicology. 2007;1:235–242. [Google Scholar]
- Zamankhan P, Ahmadi G, Wang ZC, Hopke PK, Cheng YS, Su WC, Leonard D. Airflow and deposition of nano-particles in a human nasal cavity. Aerosol Sci Tech. 2006;40:463–476. [Google Scholar]
- Zhang Z, Kleinstreuer C. Computational analysis of airflow and nanoparticle deposition in a combined nasal-oral-tracheobronchial airway model. J Aerosol Sci. 2011;42:174–194. [Google Scholar]
- Zhang Z, Martonen T. Deposition of ultrafine aerosols in human tracheobronquial airways. Inhal Toxicol. 1997;9:99–110. [Google Scholar]
- Zwartz GJ, Guilmette RA. Effect of flow rate on particle deposition in a replica of a human nasal airway. Inhal Toxicol. 2001;13:109–127. doi: 10.1080/089583701300001050. [DOI] [PubMed] [Google Scholar]


