Abstract
A reaction-time task was used to determine the visual motion thresholds in humans and in macaque monkeys for sinusoidally modulated shearing motion of a random dot display, It was found that humans and macaques were very similar in their spatial frequency sensitivity profiles for shearing motion. These profiles were of a U-shape for all human and monkey subjects tested. Temporal frequency, varied over a wide range, did not influence the shape of the spatial frequency sensitivity curve, but only the threshold amplitudes. The above results held both for single and multiple temporal cycles of shearing motion. Previous reports for the human, using these same shearing motion stimuli, indicated no increase in threshold at the lower spatial frequencies. The reason for this discrepancy is that thresholds in the previous studies were not determined at a low enough spatial frequency to see clearly this increase in thresholds. Because of the striking similarity of the data for man and macaque, it is suggested that similar neural mechanisms underly the shearing motion sensitivity of the two species.
Keywords: Visual motion, Shearing motion, Motion thresholds, Macaque monkey psychophysics, Relative motion, Spatial perception, Motion parallax, Random dot motion stimuli
INTRODUCTION
Relative motion requires differential movement of observed elements of the visual field. Such motion has a vital role in visual processing. It has been implicated as a monocular depth cue (Gibson, 1950, 1966, 1979; Nakayama and Loomis, 1974; Koenderink and van Doorn, 1976; Longuet-Higgins and Prazdny, 1980; Rogers and Graham, 1979, 1982) in figure-ground separation (von Helmholtz, 1925; Reichardt and Poggio, 1979; Reichardt et al., 1983), and discrimination of self-motion from object motion, allowing perceptual stability during eye, head, and body movements (Bridgeman, 1972; Miezen et al., 1982; Frost and Nakayama, 1983).
Neurons sensitive to relative motion have been isolated electrophysiologically in various visually responsive areas of the brain. Frost and Nakayama (1983) examined pigeon optic tectum and observed single visual neurons which code opposing motion independent of direction. Hammond and MacKay (1977) found in cat striate cortex that 70% of simple cells showed a change in responsiveness to conventional bar stimuli when these were presented in moving rather than stationary static noise backgrounds, and that complex cells had their direction bias modified according to the direction and velocity of background motion. Hammond and Smith (1982) further examined these relative motion effects. In monkey striate cortex (Bridgeman, 1972). cat striate cortex (Burns et al., 1972), and cat superior colliculus (Mandl, 1974) neurons have been examined whose responsiveness is greater when the stimulus moves with respect to a structured background.
Motter and Mountcastle (1981) noted a possible mechanism for relative motion sensing in the posterior parietal lobe of macaques where “opponent vector organization” was common among light sensitive neurons with bilateral response areas; that is, direction sensitivity vectors point in opposite directions in the two half-fields of these cells. Such cells would probably be most active during translations of the head forward or backward in a complex visual environment. Miezen et al. (1982) examined area MT (the middle temporal area) in owl monkeys, where most cells responded best to the preferred direction of motion in the receptive field against a stationary background or a background moving in the opposite direction. These cells did not respond to the preferred direction of motion if the background also moved in that direction. This center-surround organization for motion could play a role in the processing of motion parallax.
Electrophysiological evidence such as that cited above provides a basis from which to examine human psychophysical motion perception data; conversely, electrophysiological and anatomical data from animals are evaluated in the wake of psychophysical reports from humans. Attempts are thereby launched at integrating behavior and substrate into a consistent and meaningful framework.
As a step in determining the extent to which electrophysiological findings in monkeys can realistically be extrapolated to humans, we undertook a psychophysical comparison of the motion detection abilities of rhesus monkeys and man.
We selected a form of relative motion, “shearing motion”, with potentially broad relevance. Shearing motion is a form of relative motion in which the velocity of the moving elements varies, or changes sign, as a function of position along the axis perpendicular to the axis of motion. Shearing motion is implicated in foreground-background separation and the extraction of depth from motion parallax (Graham and Rogers, 1979), and thus is an important relative motion cue for spatial perception available to a moving organism.
METHODS
Shearing motion stimulus
The stimulus consisted of a random dot display on the face of a cathode ray tube (HP 1311b) with a visible screen measuring 15 cm horizontally by 19 cm vertically. Random dots were used to minimize familar position cues and to isolate detection of motion from the contaminating effects of position sensitivity (Lappin and Bell, 1976; Nakayama and Tyler, 1981). Pixel size was 2 mm horizontally by 2.4 mm vertically. At the most common viewing distance used (57 cm), the pixels were 12 min horizontally by 14.4 min vertically and the entire screen subtended angles of 15 deg horizontally by 19 deg vertically. Mean luminance of the display was approximately 24 cd/m2 with contrast approximately 50%.
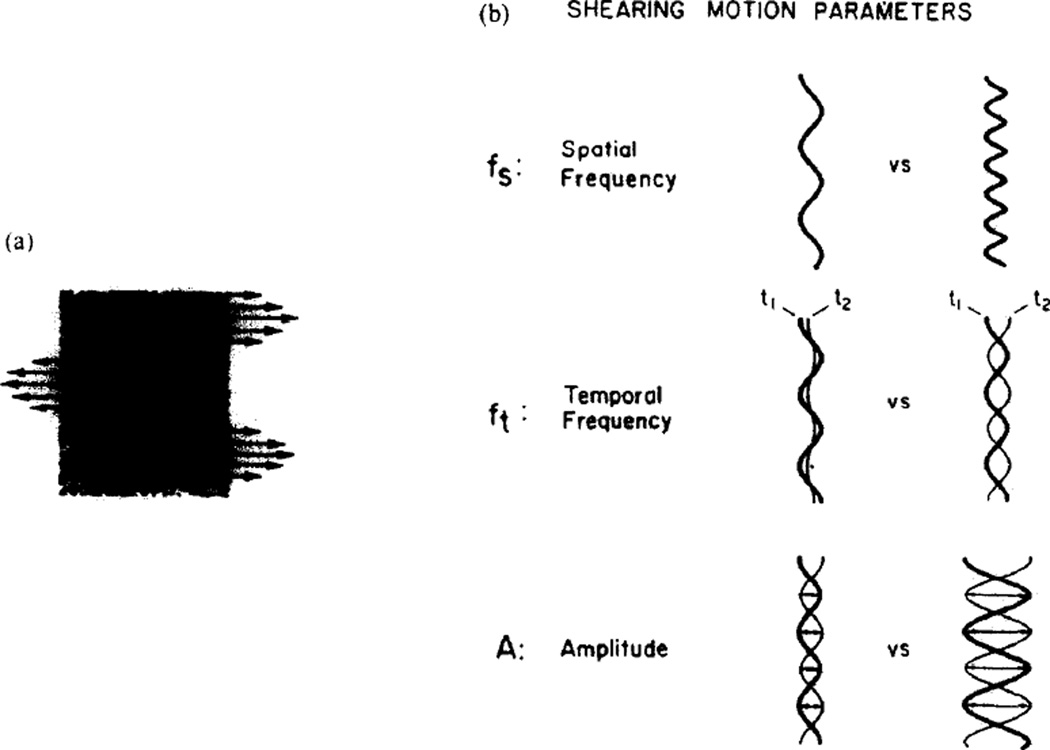
The method of motion generation was essentially the same as the one used by Nakayama and Tyler (1981). The refresh rate was 400/sec. Only horizontal shearing motion was used. Shearing motion was mediated by two function generators. One was synchronized to the vertical sweep of the random dot generator and was connected to the horizontal oscilloscope axis, creating a displacement of dots with a spatial frequency corresponding to the carrier frequency of the function generator. This function generator was then amplitude modulated by another function generator, whose frequency thus represented the temporal frequency of shearing motion. Generally a single sinuosidal cycle triggered at the first zero crossing was used for temporal modulation. The spatial waveform was also sinusoidally varying with the top of the screen synchronized to the first zero crossing. For the spatial frequencies used in these experiments from just under 1 to just over 35 cycles were visible on the screen. In essence, the motion of the dots was that of a transverse standing wave with amplitude, temporal frequency and spatial frequency under experimental control. Figure 1 illustrates the parameters of the motion involved.
Fig. 1.
(a) A random dot display which undergoes a horizontal shearing motion. Each horizontal row of dots moves as a rigid unit with a velocity that is a sinusoidal function of the vertical position of the row. The arrows represent the instantaneous velocity vectors. Note that the direction of motion reverses at the zero crossings of the sinusoidal velocity function. (b) Displacement profiles which schematize the parameters of motion used in this study. The spatial frequency parameter (fs = c/deg) determines the vertical distance between (nonnodal) random dot rows moving with the same instantaneous velocity vector. The function of sinusoidatly varying velocities diagrammed on the left is of a lower spatial frequency than the one on the right. The temporal frequency (ft = Hz) parameter determines the speed of peak-to-peak movement of the random dot rows. The displacement profiles illustrating this point have the same spatial frequency and amplitude of modulation parameters; however, the temporal frequency of modulation is less for the example on the left. As a result the dots in the display with the parameters on the left traverse less of a distance between times t1, and t2, than they do for the display with the parameters on the right. Amplitude represents peak-to-peak distance moved by the horizontal rows of random dots corresponding to the antinodes of the driving spatial frequency. The functions in the figure representing the amplitude parameter show two amplitudes of modulation for motion displays having the same spatial frequency and temporal modulation characteristics.
Subjects
Our subjects included two male rhesus monkeys (Macaca mulatta) represented as M83-1 and M83-2 in the figures, and the five human subjects R.A., B.G., D.M., B.R., and A.W. The monkeys were refracted under cycloplegia, and found to be emmetropic, with no astigmatism. All human subjects had normal or corrected vision.
Motion detection task
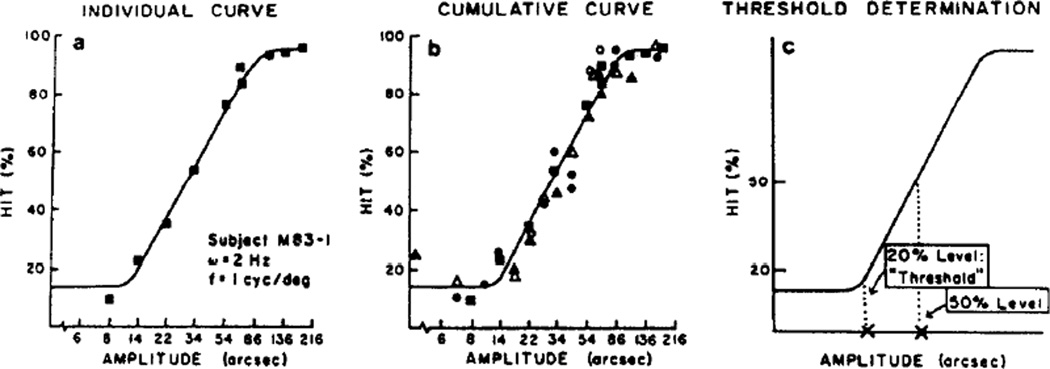
The monkeys and humans performed a reaction-time task for motion detection which was administered under computer control. Subjects sat in a chair (a primate chair for macaques) at either 57 or 200 cm from the screen. All experiments were performed with binocular viewing conditions. When the stationary random dot display flashed on, the subject fixated the display and pulled back a lever. A variable foreperiod ensued, randomly distributed among seven foreperiod classes ranging from 500 to 3500 msec. At the end of the variable foreperiod the display sheared whereupon the subject released the lever. The response was monitored by computer. A Hit was scored if the lever was released within the allotted reaction-time window after motion onset (150–800 msec was used). Following each Hit the screen blanked, a computer controlled noise was sounded, and, for the animal subjects, a drop of apple juice was delivered through a feeding tube. A False Alarm was registered when the lever release preceded the response window or was made within the first 150 msec of the reaction-time window. A Miss was registered if the response succeeded the response window. A No Response signified that no lever pull had occurred within 1200 msec after display onset (the screen was then blanked). A No response was not counted as a Trial; the Trial category embraced False Alarms, Misses and Hits. Randomized intertrial intervals of 500, 1000, or 1500 msec were used. These randomized trials ensured that the animal was looking at the display when it appeared rather than pulling back the key using a timing behavior. There were no differential time outs for False Alarm and Hit trials. 50 Trials were performed for each amplitude tested at a specified spatial and temporal frequency of shearing motion. Amplitudes were measured as the peak-to-peak distances of the shearing modulations [Fig. 1(B)]. The results from several amplitudes permitted the plotting of hit percentages as a function of amplitude of motion [Fig. 2(a)]. All data were collected and displayed on line by a DEC PDP 11/34 computer.
Fig. 2.
(a) Individual curve shows data from one set of conditions for a monkey subject. Hit % is the percentage of correct detections the animal made within the reaction-time window plotted as a function of log amplitude-of-motion. (b) Cumulative curve demonstrates consistency of data across testing days. The same curve was superimposed on this collected data of subject M83-1 as on the single-day data of (a). (c) Threshold determination was done by finding the amplitude of motion corresponding to 20% Hit response. 50% Hit values were also used.
Threshold determination
The “Hit %” (percent hits out of 50 trials) was scored for several amplitudes for a given spatial and temporal frequency, leading to a psychometric function plot; a semilog rendition of the data revealed a linear region flanked by transitions to minimum and maximum response zones (Fig. 2).
We ascertained both the 50%- and 20%-Hit amplitudes [those amplitudes of motion for which, respectively, the subject responded correctly with a Hit in 50% and 20% of the Trials, Fig. 2(c)] based on a linear regression of the linear portion of the curve, that is, those data points representing between about 20 and 85% Hits.
The probability of getting a randomly correct response for the 650 msec response window over the range of trial durations was calculated by [1 − A/(FP + D)] [(D − RT)/(FP + D − A)] where RT is the first 150 msec of the response window that is always a False Alarm, A is the first foreperiod of 500 msec plus the RT and represents the initial 650 msec after the key is pulled back (and is always a False Alarm), D is the response delay that includes the 650 msec reaction time hit window plus RT, and FP is the foreperiod range of 3500 msec. The 15% probability of a hit made by this calculation was compared to the real situation by running the animal on several sets of trials in which there was no shearing motion at all. These tests were interleaved with trials with motion so the animal did not change his strategy or become frustrated. We found the Hit rate to be 14–18% under these stimulus conditions and thus in good agreement with the calculated values.
The method of adjustment for threshold determination was also used, for comparison to the reaction-time method just outlined. This involved fixating the display with continuous shearing motion while manually adjusting the motion amplitude via a logarithmic potentiometer until a subjective determination of threshold had been reached.
RESULTS
Spatial frequency curve
In the first experiment we determined the motion sensitivity of both monkeys and humans as a function of spatial frequency of the shearing motion. A single temporal sinusoidal cycle of shearing motion was used, at 2 Hz, for the several spatial frequencies. We hoped to compare the spatial motion abilities of rhesus monkeys to those of man, and to previous results for man. A temporal frequency of 2 Hz was selected for this comparison because it yielded the lowest threshold values in previous experiments with humans (Tyler and Torres, 1972; Nakayama and Tyler, 1981).
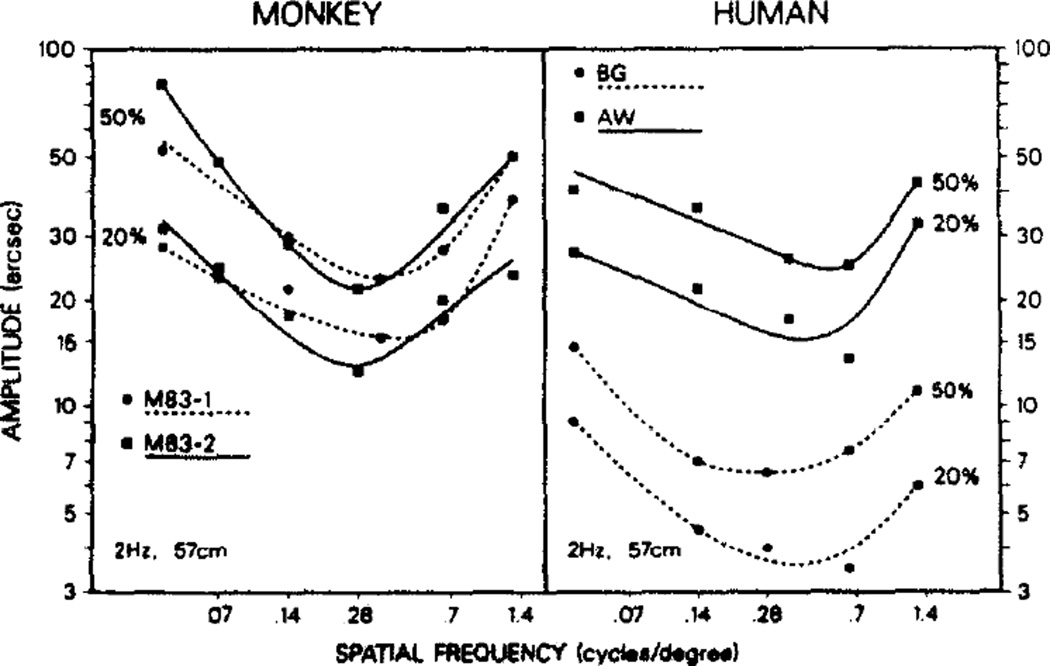
Results were similar for man and monkey and are portrayed in Fig. 3. Both demonstrated a smallest threshold somewhere in the range of 0.1–0.6 c/deg of visual angle, at 57 cm viewing distance. The threshold amplitudes increased on either side of this optimum. The actual threshold value varied among individuals by up to a factor of four. Those with lower values consistently showed lower values throughout the testing, and those with higher thresholds were similarly constant. Consistency of data across testing days can be seen in the psychometric curve of Fig. 2(b). Additionally, those whose best spatial frequency was at the low or high end of the optimum frequency range maintained this characteristic for all temporal frequencies in all shearing motion paradigms used. Although there is some individual variation in the optimum spatial frequency and considerable individual variation for absolute threshold amplitudes, in general the “U“ shape of the spatial frequency sensitivity curve was apparent for all individuals tested. The monkey thresholds and optimum spatial frequencies fell within the range of the human data.
Fig. 3.
Comparison of spatial frequency profiles at 57 cm viewing distance for monkeys (M83-1 and M83-2) and humans (A.W. and B.G.); 50% and 20% hit values are shown. Both monkey profiles fell within the range defined by the human curves. All subjects did best at spatial frequencies of around 0.14–0.65 c/deg, demonstrating both a low and high frequency upturn in threshold.
Temporal frequency
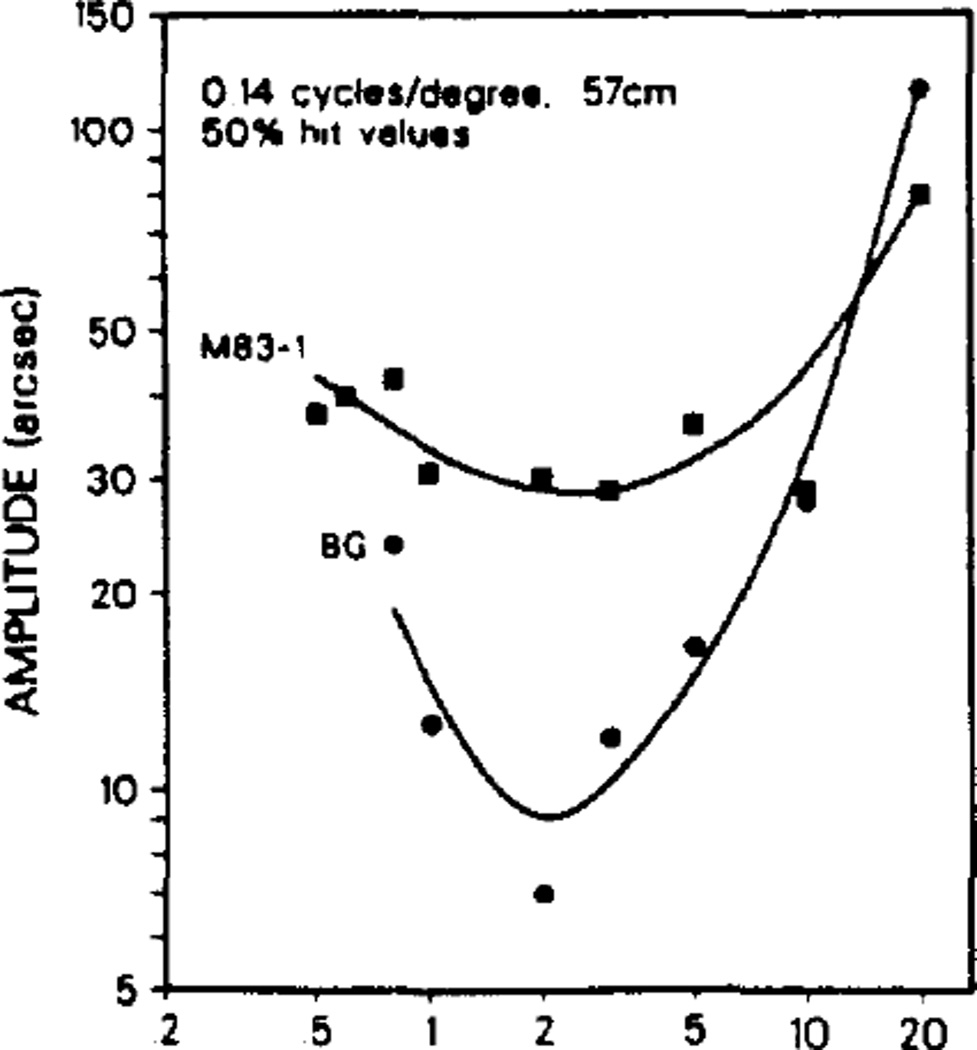
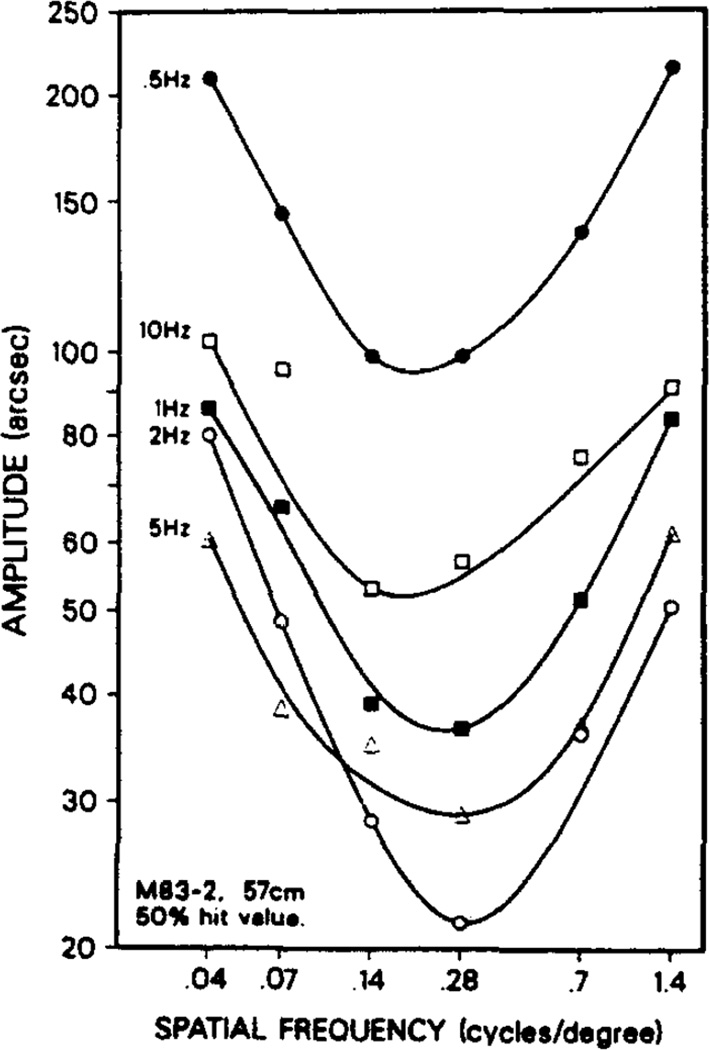
In agreement with Nakayama and Tyler’s (1981) experiments with humans we found the lowest thresholds for the optimum spatial frequencies to be at temporal frequencies of approximately 2 Hz, with thresholds increasing for higher and lower temporal frequencies. The macaques resembled the human subjects in this regard (Fig. 4). The shape of the spatial frequency sensitivity curve was independent of the temporal modulation in the range of 0.5–10 Hz; the only systematic changes recorded among these curves were in the absolute levels of the thresholds (Fig. 5).
Fig. 4.
Temporal frequency profiles for monkey (M83-1) and human (B.G.) at a spatial frequency of 0.14 c/deg. All subjects exhibited best performance at around 2 Hz (1–5 Hz range).
Fig. 5.
Spatial frequency plots for M83-2 showed the characteristic U-shaped curve for all temporal frequencies in the range of 0.5–10 Hz.
Multiple temporal cycles and method of adjustment
Nakayama and Tyler (1981) did not report an upturn in the spatial frequency threshold curve for low spatial frequency values for human subjects. They used a method of adjustment procedure in which thresholds were determined by viewing multiple temporal cycles in the stimulus. To determine whether their lack of a low frequency rise might be due to such multiple cycles of motion, we allowed the sinusoidal motion to continue for more than one cycle during the detection period of the trials. The number of temporal cycles possible is limited by the time allotted for the monkey to release the lever during the detection time window. This put different number-of-cycle constraints on different temporal frequencies of motion, while allowing the same time-of-viewing-motion for each, thus inverting the considerations of the single-cycle situation.
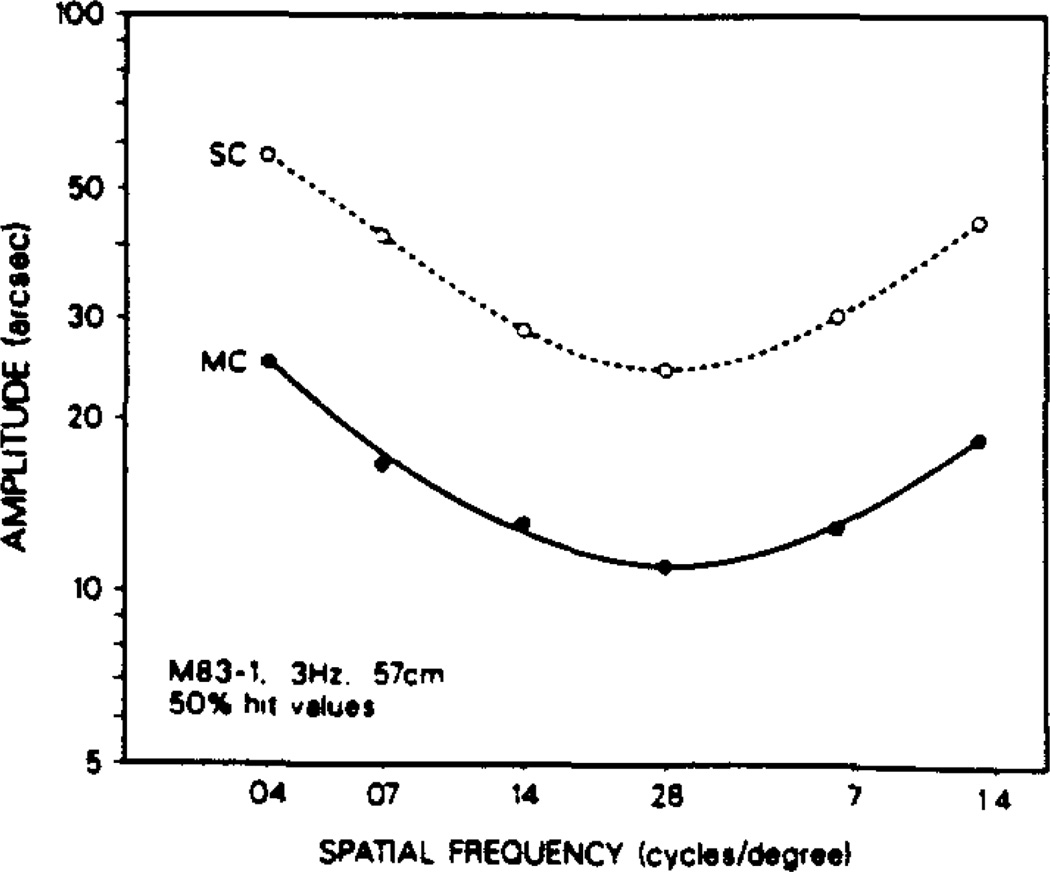
We compared single- and multiple-cycle motion thresholds. There is obvious parallelism in the spatial frequency profiles for single- and multiple-cycle motion (Fig. 6); thus multiple-cycle viewing does not remove the low frequency elevation in threshold. A superiority was seen in multiple-cycle performance over single-cycle performance at the lower temporal frequencies tested (2–5 Hz) which reversed between 5 and 10 Hz whereupon single cycles elicited better motion detection performance. This single-cycle superiority faded by 20 Hz by which point single- and multiple-cycle motion were equally effective stimuli. This performance pattern was present for both the monkey (M83-1) and human (B.G.) subjects tested.
Fig. 6.
Comparison of single cycle (SC) with multiple-cycle (MC) motion at 3 Hz (subject M83-1) revealed parallelism of the respective spatial frequency sensitivity profiles. The threshold advantage seen for multiple-cycle motion was maximum at this 3 Hz value, decreasing with lower or higher temporal frequencies, indeed reversing at a value between 5 and 10 Hz, and finally equalizing by 20 Hz, for both the human and monkey subjects tested. At all temporal frequencies tested, regardless of whether single or multiple cycles were used, there was an elevation in threshold at the low spatial frequencies.
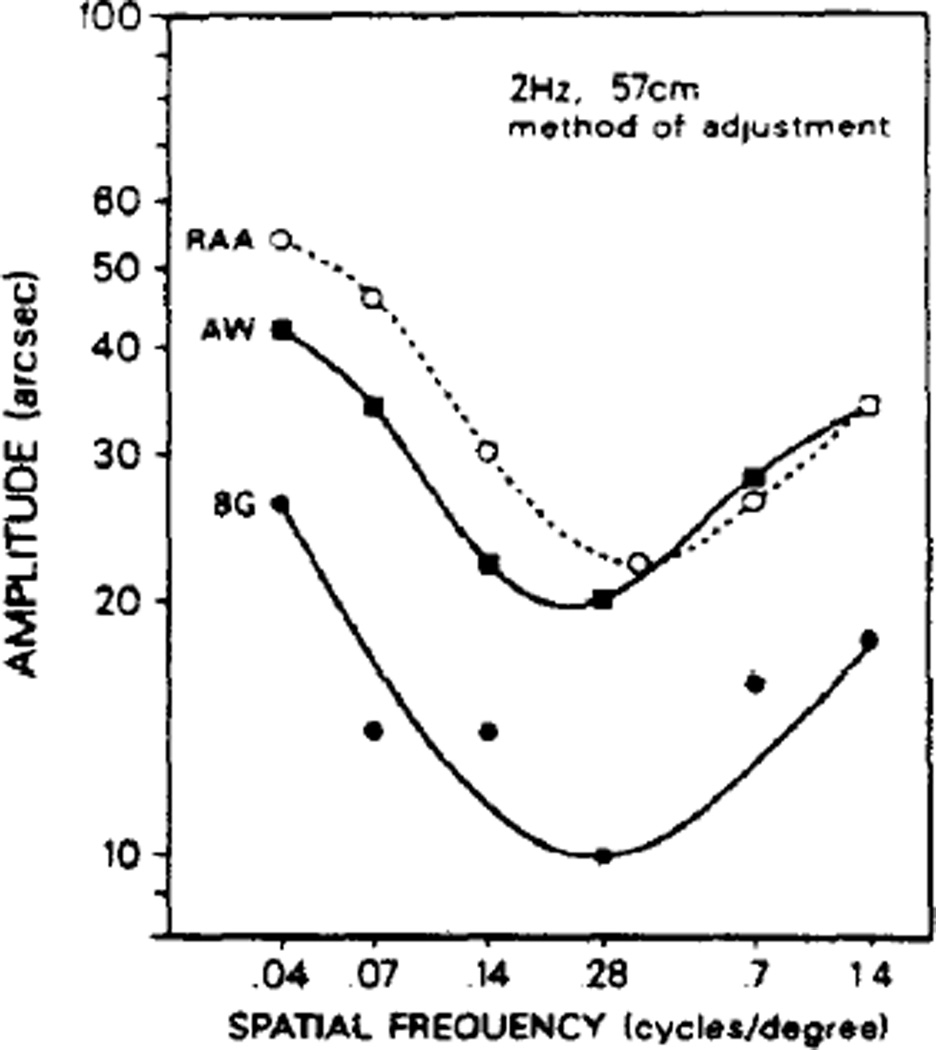
Despite the persistence of the low frequency upturn in the face of multiple cycles, there could conceivably remain factors in the method-of-adjustment which might eradicate the upturn found with our reaction-time paradigm. To examine this possibility our human subjects tried the method of adjustment (Fig. 7). The low frequency upturn persisted.
Fig. 7.
Human thresholds obtained using the method of adjustment. This figure shows that the low spatial frequency upturn persisted for all subjects tested.
2 m vs 57 cm comparison
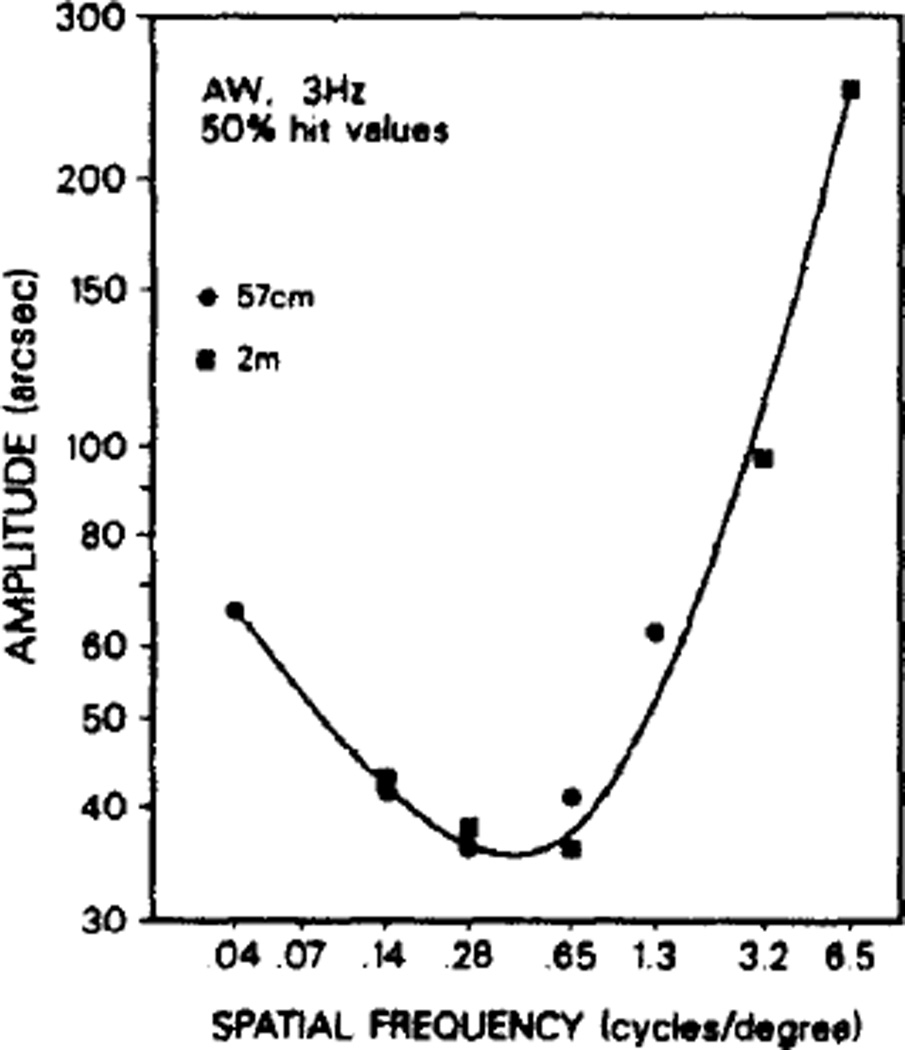
The screen size and pixel limitations were such that 57 cm was inadequate for obtaining high spatial frequency thresholds, and 2 m was too distant for low ones. Subjects were tested at both positions and the thresholds were found to be comparable for comparable spatial frequencies, suggesting that the data from each distance could be used to extend the results from the other distance (Fig. 8). Together the data describe a U-shaped relationship of threshold amplitude as a function of spatial frequency over the range 0.04–6.5 c/deg.
Fig. 8.
Spatial frequency sensitivity profiles at 57 cm and 2 m (subject A.W., 3 Hz). Results at the two distances were similar allowing coplotting of high and low spatial frequency values.
DISCUSSION
The rhesus monkey (Macaca mulatta) showed psychophysical threshold properties similar to those of man for shearing-motion detection. Both monkeys tested were similar to human subjects in spatial and temporal frequency preferences and in actual threshold values. This observation extends previous reports claiming similarity of rhesus monkeys to man for such visual functions as acuity (Weinstein and Grether, 1940; Cowey and Ellis, 1967), stereoacuity (Sarmiento, 1975), luminosity and color vision (De Valois et al., 1974a), and visual spatial abilities (Smith et al., 1982; De Valois et al., 1974b).
Both monkey and man deviated from the previously reported view of Nakayama and Tyler (1981) that, for man, there is no low frequency upturn in thresholds for shearing motion but instead a flattening. We attribute this discrepancy largely to the range of spatial frequencies that they used. Nakayama and Tyler took their lowest spatial frequency reading at about 0.15 c/deg, whereas we explored the region nearly four times lower than this value. For some individuals the threshold elevation, though present, was not great at this spatial frequency. It should be noted that at 0.04 c/deg, the lowest spatial frequency we tested, the areas of maximum differential motion are 12.5 deg apart and the pickup of motion must require the peripheral retina which has higher motion amplitude thresholds (McKee and Nakayama, 1983). Indeed, Rogers and Graham (1982) found identically shaped tuning curves to those reported here for an identical stimulus in a somewhat different experiment; they required human subjects to determine thresholds at which depth sensation was first detected in random dot patterns that sheared in phase with the swaying motion of the head. The Rogers and Graham thresholds were high compared to ours, possibly due to components of common motion generated by the retinal slip that resulted from the head motion; small amplitudes of common motion added to shearing motion have been shown to increase thresholds substantially for shearing motion detection (Nakayama, 1981).
We can also compare our results to an analogous set of experiments on the spatial frequency tuning of binocular disparity sensitivity. Tyler (1975) found much lower bandpass frequencies than the profile for contrast sensitivity. The similarity in the shape of the curves for stereopsis and motion parallax and the similarity of the depth sensations produced by shear and disparity in random dots have led Rogers and Graham (1979) to propose that the two depth systems are convergent or derivative at some point in the nervous system. Our absolute thresholds for shear without egocentric motion are similar to theirs for stereoacuity across all spatial frequencies tested, adding support to this hypothesis.
The earliest stages in the nervous system which may be involved in motion detection are at the very front end of the system. The retinal ganglion cells respond to small movements within their receptive fields (Scobey and Horowitz, 1972). Cells in striate cortex add the feature of directional selectivity, particularly for cells in layers 4b and 6 (Dow, 1974; Livingstone and Hubel, 1984). These neurons project to the middle temporal area (MT), an extrastriate visual field that appears to be specialized for motion analysis (Zeki, 1974; Van Essen et al., 1981; Maunsell and Van Essen, 1983a; Albright et al., 1984). The response of some MT cells indicates that the aperture problem may be solved at this level in the visual pathway since cells in this area have been found which respond to the overall direction of motion of an object irrespective of the component motions of its local contours (Movshon et al., 1985).
One would predict that lesions to the striate cortex would greatly increase the thresholds reported here by denying the remainder of the nervous system access to the results of the early stages of motion processing. Moreover, by comparing spatial frequency sensitivity profiles for shearing and compression motion, Nakayama et al. (1984) propose that the basic motion detectors have receptive fields similar in shape to those of striate cortical neurons. No loss in sensitivity after such a lesion would suggest that the collicular-pretectal pathways can provide a parallel path for fine motion sensitivity.
On the other hand, lesions to area MT may also severely affect the thresholds measured in this experiment by interfering with the perception of motion. A current hypothesis holds that motion information is funneled into this area from striate cortex and that MT is one of the major access routes for motion information available to the perceptual and motor systems. Lesions in humans, in an area that may be homologous to area MT in monkeys, can produce a motion blindness in the absence of overt defects in pattern vision (Zihl et al., 1983). Chemical lesions of MT in monkeys disrupt their ability to estimate velocity or direction of movement in visual pursuit tasks (Newsome et al., 1983). Area MT projects to premotor areas including the frontal eye fields and prefrontal cortex and thus has access to some motor systems that VI does not. However, there are alternative pathways from V1 to the frontal lobe through other extrastriate visual areas including V2 (Maunsell and Van Essen, 1983b).
MT may be in part responsible for the extremely low thresholds seen for relative motion. Thresholds for absolute motion are much higher than for relative motion, at least in the foveal region (Nakayama, unpublished). Miezen et al. (1982) have found that the cells of MT have opponent surrounds for the motion of textured fields. Thus MT neurons are maximally activated when the direction of the surround is opposite that at the center of the receptive field and likewise these neurons are often completely inhibited with motion in the same direction for center and surround. This center-surround organization for motion has also been observed in V2 and V1 but to a lesser degree in terms of sensitivity and size of the receptive fields. Thus, the added sensitivity to relative motion may be a result of such a receptive field structure in MT. The reduced sensitivity to shearing motion at very low spatial frequencies may be another consequence of this center-surround antagonism.
Finally, we do not know the role spatial summation plays in the extremely low thresholds recorded in these experiments. If spatial summation is a factor, and since the maximum sensitivity for motion is at very low spatial frequencies, it would be expected that large receptive fields would be required. Large receptive fields exist in MT and may boost perceptual sensitivity by correlating the activity in groups of convergent V1 neurons. We have calculated the expected size of an opponent center-surround motion receptive field from our threshold-spatial frequency data. The center diameter was estimated to be 0.6 deg and the surround diameter 6 deg.
Acknowledgments
This study supported by NIH Grant NS17562, a McKnight Foundation Scholars Award, and a Sloan Foundation Fellowship to R.A. Andersen. This research was conducted in part by the Clayton Foundation for Research-California Division. R.A.A. is a Clayton Foundation Investigator. We thank Dr R. M. Siegel for comments on the manuscript. We also thank P. Thomas for secretarial assistance and K. Trulock for photographic assistance.
REFERENCES
- Albright JD, Desimone R, Gross CG. Columnar organization of directionally selective cells in visual area MT of the macaque. J. Neurophysiol. 1984;51:16–31. doi: 10.1152/jn.1984.51.1.16. [DOI] [PubMed] [Google Scholar]
- Bridgeman B. Visual receptive fields sensitive to absolute and relative motion during tracking. Science. 1972;178:1106–1108. doi: 10.1126/science.178.4065.1106. [DOI] [PubMed] [Google Scholar]
- Burns BD, Gassanov V, Webb AC. Responses of neurones in the cat visual cerebral cortex to relative movement patterns. J. Physiol. 1972;226:133–151. doi: 10.1113/jphysiol.1972.sp009977. [DOI] [PMC free article] [PubMed] [Google Scholar]
- Cowey A, Ellis CM. Visual acuity of rhesus and squirrel monkeys. J. comp. Physiol. Psychol. 1967;64:80–84. doi: 10.1037/h0024821. [DOI] [PubMed] [Google Scholar]
- DeValois RL, Morgan HC, Polson MC, Mead WR, Hull EM. Psychophysical studies of monkey vision—I. Macaque luminosity and color vision tests. Vision Res. 1974;14:53–67. doi: 10.1016/0042-6989(74)90116-3. [DOI] [PubMed] [Google Scholar]
- DeValois RL, Morgan HC, Snodderly DM. Psychophysical studies of monkey vision—III. Spatial luminance contrast sensitivity tests of macaque and human observers. Vision Res. 1974;14:75–81. doi: 10.1016/0042-6989(74)90118-7. [DOI] [PubMed] [Google Scholar]
- Dow BM. Functional classes of cells and their laminar distribution in monkey visual cortex. J. Neurophysiol. 1974;37:927–946. doi: 10.1152/jn.1974.37.5.927. [DOI] [PubMed] [Google Scholar]
- Frost BJ, Nakayama K. Single visual neurons code opposing motion independent of direction. Science. 1983;13(220):744–745. doi: 10.1126/science.6836313. [DOI] [PubMed] [Google Scholar]
- Gibson JJ. The Perception of the Visual World. Boston, MA: Houghton Mifflin; 1950. [Google Scholar]
- Gibson JJ. The Senses Considered as Perceptual Systems. Boston, MA: Houghton Mifflin; 1966. [Google Scholar]
- Gibson JJ. The Ecological Approach to Visual Perception. Boston, MA: Houghton Mifflin; 1979. [Google Scholar]
- Hammond P, MacKay DM. Differential responsiveness of simple and complex cells in cat striate cortex to visual texture. Expl Brain Res. 1977;30:275–296. doi: 10.1007/BF00237256. [DOI] [PubMed] [Google Scholar]
- Hammond P, Smith AT. On the sensitivity of complex cells in feline striate cortex to relative motion. Expl Brain Res. 1982;47:457–460. doi: 10.1007/BF00239363. [DOI] [PubMed] [Google Scholar]
- Helmholtz H von. In: Treatise or Physiological Optics. Southhull JPC, editor. New York: Dover; 1925. [Google Scholar]
- Koenderink JJ, Van Doorn AJ. Local structure of movement parallax of the plane. J. opt. Soc. Am. 1976;66:717–721. [Google Scholar]
- Lappin JS, Bell HH. The detection of coherence in moving random-dot patterns. Vision Res. 1976;16:161–168. doi: 10.1016/0042-6989(76)90093-6. [DOI] [PubMed] [Google Scholar]
- Livingstone MS, Hubel DH. Anatomy and physiology of a color system in the primate visual cortex. J. Neurosci. 1984;4:309–356. doi: 10.1523/JNEUROSCI.04-01-00309.1984. [DOI] [PMC free article] [PubMed] [Google Scholar]
- Longuet-Higgins HC, Prazdny K. The interpretation of a moving retinal image. Proc. R. Soc. Lond. B. 1980;208:385–397. doi: 10.1098/rspb.1980.0057. [DOI] [PubMed] [Google Scholar]
- Mandl G. The influence of visual pattern combinations on responses of movement sensitive cells in the cat’s superior colliculus. Brain Res. 1974;75:215–240. doi: 10.1016/0006-8993(74)90743-4. [DOI] [PubMed] [Google Scholar]
- Maunsell JHR, Van Essen DC. Functional properties of neurons in middle temporal visual area of the macaque monkey. I. Selectivity for stimulus direction, speed, and orientation. J. Neurophysiol. 1983a;49:1127–1147. doi: 10.1152/jn.1983.49.5.1127. [DOI] [PubMed] [Google Scholar]
- Maunsell JHR, Van Essen DC. The connections of the middle temporal visual area (MT) and their relationship to a cortical hierarchy in the macaque monkey. J. Neurosci. 1983b;3:2563–2586. doi: 10.1523/JNEUROSCI.03-12-02563.1983. [DOI] [PMC free article] [PubMed] [Google Scholar]
- McKee S, Nakayama K. The detection of motion in the peripheral field. Vision Res. 1983;24:25–32. doi: 10.1016/0042-6989(84)90140-8. [DOI] [PubMed] [Google Scholar]
- Miezen F, McGuinness E, Allman J. Antagonistic direction specific mechanisms in area MT in the owl monkey. Neurosci. Abstr. 1982;8:681. [Google Scholar]
- Motter BC, Mountcastle VB. The functional properties of the light sensitive neurons of posterior parietal cortex studied in waking monkeys: foveal sparing and opponent vector organization. J. Neurosci. 1981;1(1):3–26. doi: 10.1523/JNEUROSCI.01-01-00003.1981. [DOI] [PMC free article] [PubMed] [Google Scholar]
- Movshon JA, Adelson EH, Gizzi M, Newsome WT. The analysis of moving visual patterns. Expl Brain Res. 1985 In press. [Google Scholar]
- Nakayama K. Differential motion hyperacuity under conditions of common image motion. Vision Res. 1981;21:1475–1482. doi: 10.1016/0042-6989(81)90218-2. [DOI] [PubMed] [Google Scholar]
- Nakayama K, Loomis JM. Optical velocity patterns, velocity-sensitive neurons, and space perception: a hypothesis. Perception. 1974;3:63–80. doi: 10.1068/p030063. [DOI] [PubMed] [Google Scholar]
- Nakayama K, Tyler CW. Psychophysical isolation of movement sensitivity by removal of familiar position cues. Vision Res. 1981;21:427–433. doi: 10.1016/0042-6989(81)90089-4. [DOI] [PubMed] [Google Scholar]
- Nakayama K, Silverman G, MacLeod DIA, Mulligan J. Sensitivity to shearing and compressive motion in random dots. Perception. 1984 doi: 10.1068/p140225. [DOI] [PubMed] [Google Scholar]
- Newsome WT, Wurtz RH, Dursteler MR, Mikami A. Deficits in pursuit eye movements after chemical lesions of motion-related visual areas in the superior temporal sulcus of the macaque monkey. Neurosci. Abstr. 1983;9:154. [Google Scholar]
- Reichardt W, Poggio T. Figure-ground discrimination by relative movement in the visual system of the fly. Biol. Cybernet. 1979;35:81–100. [Google Scholar]
- Reichardt W, Poggio T, Hausen K. Figure-ground discrimination by relative movement in the visual system of the fly. Part II: Towards the neural circuitry. Biol. Cybernet. Suppl. 1983;46:1–30. [Google Scholar]
- Rogers B, Graham M. Motion parallax as an independent cue for depth perception. Perception. 1979;8:125–134. doi: 10.1068/p080125. [DOI] [PubMed] [Google Scholar]
- Rogers B, Graham M. Similarities between motion parallax and stereopsis in human depth perception. Vision Res. 1982;22:261–270. doi: 10.1016/0042-6989(82)90126-2. [DOI] [PubMed] [Google Scholar]
- Sarmiento RF. The stereoacuity of macaque monkey. Vision Res. 1975;15:493–498. doi: 10.1016/0042-6989(75)90026-7. [DOI] [PubMed] [Google Scholar]
- Scobey RP, Horowitz JM. The detection of small image displacements by cat retinal ganglion cells. Vision Res. 1972;12:2133–2143. doi: 10.1016/0042-6989(72)90062-4. [DOI] [PubMed] [Google Scholar]
- Smith EL, III, Harweth RS, Levi DM, Boltz RL. Contrast increment thresholds of rhesus monkeys. Vision Res. 1982;22:1153–1161. doi: 10.1016/0042-6989(82)90080-3. [DOI] [PubMed] [Google Scholar]
- Tyler CW. Spatial organization of binocular disparity sensitivity. Vision Res. 1975;15:583–590. doi: 10.1016/0042-6989(75)90306-5. [DOI] [PubMed] [Google Scholar]
- Tyler CW, Torres JT. Frequency response characteristics for sinusoidal movement in the fovea and periphery. Percept. Psychophys. 1972;12:232–236. [Google Scholar]
- Van Essen DC, Maunsell JHR, Bixby JL. The middle temporal visual area in the macaque: myeloarchitecture, connections, functional properties, and topographic organization. J. comp. Neurol. 1981;199:293–326. doi: 10.1002/cne.901990302. [DOI] [PubMed] [Google Scholar]
- Weinstein B, Grether WF. A comparison of visual acuity in the rhesus monkey and man. J. comp. Psychol. 1940;30:187–195. [Google Scholar]
- Zeki SM. Functional organization of a visual area in the posterior bank of the superior temporal sulcus of the rhesus monkey. J. Physiol. 1974;236:549–573. doi: 10.1113/jphysiol.1974.sp010452. [DOI] [PMC free article] [PubMed] [Google Scholar]
- Zihl J, Von Cramon D, Mai N. Selective disturbance of movement vision after bilateral brain damage. Brain. 1983;106:313–340. doi: 10.1093/brain/106.2.313. [DOI] [PubMed] [Google Scholar]


