

Abstract
Background
Magnetic resonance imaging (MRI) can provide in vivo assessment of tissue damage, allowing evaluation of multiple sclerosis (MS) lesion evolution over time – a perspective not obtainable with postmortem histopathology. Relapsing-remitting experimental autoimmune encephalomyelitis (EAE) is an experimental model of MS that can be induced in the common marmoset, a small new world primate, and that causes perivenular white matter lesions similar to those observed in MS.
Methods
Brain lesion development and evolution were studied in vivo and postmortem in 4 marmosets with EAE through serial T2- and T2*-weighted scans at 7 tesla. Supratentorial white matter lesions were identified and characterized.
Results
Of 97 lesions observed, 86 (88%) were clearly perivenular, and 62 (72%) developed around veins that were visible even prior to EAE induction. The perivenular configuration was confirmed by postmortem histopathology. Most affected veins, and their related perivascular Virchow-Robin spaces, passed into the subarachnoid space rather than the ventricles.
Conclusion
As in human MS, the intimate association between small veins and EAE lesions in the marmoset can be studied with serial in vivo MRI. This further strengthens the usefulness of this model for understanding the process of perivenular lesion development and accompanying tissue destruction in MS.
Keywords: Veins, Multiple sclerosis, Experimental autoimmune encephalomyelitis, Magnetic resonance imaging, Susceptibility weighted imaging
Introduction
MS lesions in white matter (WM) are pathologically heterogeneous (1), but in most cases they develop around small veins (2, 3) and expand outward from an inflammatory cuff localized in the perivascular Virchow-Robin spaces (4, 5). In MS, T2*-weighted MRI can depict lesions and veins in a single image (3), as signal loss due to deoxyhemoglobin increases contrast between them (6). At 7 tesla (T) MRI, a central vessel can be identified in 87% of visible WM lesions (7), a characteristic that seems specific to MS and may be useful for differentiating MS from other causes of WM lesions (8).
In MS, whether perivenular inflammation precedes or follows biological disease onset is difficult to determine, which has led to controversy regarding the mechanisms of MS lesion development. Focal, early perivascular inflammation would support a primary inflammatory pathogenesis deriving from the Virchow-Robin spaces. On the other hand, diffuse inflammation without focal prelesional damage would suggest a primary degenerative process with a reactive inflammatory response. As premorbid imaging is virtually never available in MS itself, the time course of lesion development can only be studied in relevant animal models. In this context, a particularly important model is EAE induced in the common marmoset, a disease that is pathologically and immunologically similar to human MS. In this model, ultrahigh magnetic field MRI evaluation of WM lesion development, before and after lesion onset, as well as follow-up of different stages of lesion development, are now possible (9-11).
Two main marmoset EAE models have been described. The first model is induced with WM homogenate (WMH) and is characterized pathologically by multiple inflammatory demyelinating lesions in the WM, mainly around veins, with predominantly mononuclear perivascular inflammation (12). The second model is induced with recombinant human myelin oligodendrocyte glycoprotein (rhMOG), and no clear evidence of a relationship between lesions and veins is available for this model (11).
The primary objective of the current study was to monitor the development over time of focal WM lesions in both types of EAE using serial MRI. The secondary objective was to detect and characterize the vessels at the center of these developing lesions.
Materials and Methods
Animals
Experiments were performed in six common marmosets (Callithrix jacchus), mean age 3.8y (range: 2.8-4.6), body weight 477g (standard deviation: 111), 4 females, selected from the NINDS colony. The marmosets were divided into three experimental units: two animals with rhMOG-EAE, two with WMH-EAE, and two healthy animals. Pre-immunization baseline data were also obtained from the EAE marmosets. The size of the experimental groups was the minimum necessary to address the primary and secondary objectives of this study.
Animal care
Marmosets were housed two to a cage with a 12-hour light/dark cycle on an ad libitum diet of canned marmoset food (ZuPreem, Shawnee, KS, USA), Purina 5040 biscuits, unfiltered water, PRANG™ rehydrator (BioServ, Frenchtown, NJ, USA), and fruit and vegetable treats.
EAE induction
Two animals were immunized with 100μg of rhMOG1-125 emulsified in complete Freund's adjuvant (Difco Laboratories, BD, Franklin Lakes, NJ, USA) (13). Two other animals were immunized with 0.2mg fresh-frozen human WMH, obtained from a temporal lobectomy and emulsified in complete Freund's adjuvant containing 1.8mg/ml of killed Mycobacterium tuberculosis (9). Intradermal injections were divided over four areas – two in the dorsal axilla and two in the dorsal inguinal region. Disease induction was performed at the same time in all animals.
Clinical evaluation
A scoring scale (10) was used to record the severity of clinical disease: 0=normal; 0.5=apathy, loss of appetite; 1=lethargy, anorexia, weight loss; 2=ataxia; 2.5=brainstem syndrome, mono/paraparesis and/or sensory loss; 3=para/hemiplegia; 4=quadriplegia; 5=spontaneous death. Animals were assessed three times each week by a trained observer and weekly by a neurologist; neither was blinded to the experimental group. The experiment was terminated, following local ethical guidelines, at a minimum disease score of 3. The brain and spinal cord were removed and fixed in 10% formalin.
Animal preparation for in vivo MRI experiments
The animals were fasted for 12-16 hours prior to MRI experiments. On the day of the scan, the animals were retrieved from their cages and transported to the MRI laboratory. Pre-anesthetic sedation was obtained with an intramuscular injection of 10mg/kg ketamine. The sedated marmosets were orally intubated and connected to a mechanical ventilator that delivered a mixture of medical air and oxygen (FiO2∼40%) containing isoflurane. An indwelling 27.5 gauge butterfly needle was inserted in the lateral tail vein for the delivery of fluids and contrast agents. The animal was placed in the sphinx position in a custom-designed MR-compatible cradle. Head fixation was achieved by means of earpieces, which were placed in the ear canals after pretreatment of the nonpiercing 45° tips with 2% lidocaine gel and attached to an MRI-compatible stereotaxic frame. The isoflurane concentration was varied around 2% to maintain anesthesia. Physiological monitoring of end-tidal CO2, heart rate, and SPO2 was obtained via capnograph and pulse oximeter (Surgivet, Waukesha, WI, USA). Rectal temperature was continuously monitored and maintained at 38.5°C with a water heating pad.
MRI setup
In vivo imaging was performed in a 7T/30cm Bruker scanner (Bruker Biospin, Ettlingen, Germany) equipped with a 15cm gradient set of 450mT/m strength (Resonance Research, Billerica, MA, USA). Data acquisition was performed in Transmit Only-Receive Only mode using a homemade linear birdcage coil (120mm inner diameter) as a radiofrequency transmitter and a homemade, 5-channel radiofrequency surface-array receiver coil assembly placed over the head of the animal. The receive coil assembly had one elliptical loop (18×36mm diameter) on top and two pairs of overlapped circular loops (22mm diameter) that were obliquely wrapped laterally around the head (14).
In vivo scanning protocol
Animals were scanned at baseline, every other week after immunization, and weekly after lesions were first observed. Two healthy marmosets were scanned serially as controls. The following coronal scans covered the whole brain:
2D T1-weighted magnetization prepared rapid acquisition gradient echo (MPRAGE); nominal in-plane resolution=0.15×0.15mm; slice thickness=0.3mm; inversion time (TI)=1200ms; repetition time (TR)=10.5ms; echo time (TE)=3.4ms; flip angle (FA)=12°; acquisition time (AT)=25min.
2D proton density (PD) and T2-weighted rapid acquisition of refocused echoes (RARE); nominal in-plane resolution=0.15×0.15mm; slice thickness=0.6mm; TR=1700/1200ms; TE=17/72ms; FA=90°; echo-train length=1/8; number of excitations=1; AT=7/6min.
2D T2*-weighted multi-gradient-echo; nominal in-plane resolution=0.15×0.15mm; slice thickness=0.6mm; TR=57ms; TE=3.5/10.5/17.5/24.5/31.5/38.5ms; FA=16°; AT=10min.
Ex vivo scanning protocol
Ex vivo T2*-weighted MRI was performed on brains from all six animals. Tissues were placed in a plastic tube filled with Fomblin (Solvay, Brussels, Belgium) and inserted into a homemade single-channel radiofrequency coil. A whole-brain, T2*-weighted multi-gradient-echo sequence was repeated 8 times and averaged (nominal resolution=0.1mm isotropic; TR=57ms; TE=3/7/11/15/19/23/27/31ms; FA=16°; AT=1.1hour).
Image post-processing
In vivo PD and T2-weighted images were arithmetically averaged to form a “PDT2” image that provided excellent visualization of WM lesions. The PDT2 and the first echo of the T2*-weighted images were rigidly registered to the T1-weighted images at each time point; each T1-weighted scan was also registered to the baseline study. All echoes of the T2*-weighted scans were arithmetically averaged at each time point, and the averaged images were stacked into a single dataset for each animal.
Supratentorial lesions seen at least in two slices, were identified on the T2*-weighted images and at least one of the other sequences (T1-weighted or PDT2). A neurologist and a third-year neurology resident, who were specifically trained for this task and blinded to the identity of the animals, counted lesions. Recordings at each time point included the perivenular distribution of lesions and presence or absence of visible veins where lesions later developed. The topography of affected supratentorial veins was marked as “superficial” (passing through subcortical WM and the cortex and draining into the subarachnoid space) or “deep” (draining into the deep cerebral venous system). Lesions and veins in the infratentorial area and optic nerve were excluded because image artifacts limited visualization.
The ex vivo T2* was repeated 8 times, and images were averaged and rigidly registered to the baseline in vivo averaged T2* images using the software MIPAV (http://mipav.cit.nih.gov). The presence or absence of suspected hemorrhage (spherical areas of signal loss) was recorded.
Histopathology
Animals were necropsied within one hour of death. Brains and spinal cords were fixed in 10% NBF and 4% PFA, respectively, embedded in paraffin, and subsequently sectioned at 5μm. Sections were stained with hematoxylin and eosin (HE) and luxol fast blue (LFB). Perls' Prussian blue stain was also used to investigate whether MRI-detected spherical areas of signal loss could in fact represent perivascular iron deposition rather than frank blood.
Statistical methods
This study was designed to be descriptive and exploratory. As the number of animals in each experimental group was very small, formal statistical comparisons are not reported.
Results
Disease characteristics
Table 1 provides a clinical summary. In the rhMOG animals, the onset of clinical signs was abrupt and severe (acute paraplegia 8 weeks after immunization in rhMOG1 and acute quadriplegia 10 weeks after induction in rhMOG2) and required termination of the experiment. Review of the ex vivo MRI showed that brain and spinal cord lesions were confluent and likely hemorrhagic in rhMOG1. In rhMOG2, brain lesions were scattered, but spinal cord lesions were confluent and likely hemorrhagic.
Table 1. Clinical summary.
| Animal | Age | Sex | Baseline Weight | Time to lesion Development | Time to 10% Weight loss | Symptoms and signs | Euthanasia |
|---|---|---|---|---|---|---|---|
| rhMOG1 | 3.3y | F | 657 | 4w | 4w | 8w | 8w |
| rhMOG2 | 3.3y | F | 446 | 5w | 4w | 10w | 10w |
| WMH1 | 4.5y | M | 401 | 4w | 4w | 4w | 7w |
| WMH2 | 2.6y | M | 417 | 16w | 15w | 11w | 28w |
| Control1 | 4y | F | 507 | ||||
| Control2 | 3.7y | F | 386 |
Abbreviations. rhMOG: recombinant human myelin oligodendrocyte glycoprotein; WMH: white matter homogenate; w: weeks; y: years; F: female; M: male.
WMH1 developed minor clinical signs and presented several small lesions disseminated throughout the brain and spinal cord. WMH2 developed mild clinical signs suggestive of sensory dysfunction 11 weeks after immunization, which then completely resolved. It then presented acute paraplegia 28 weeks after immunization, leading to termination of the experiment. Ex vivo MRI showed disseminated medium-sized brain and spinal cord lesions, with small amounts of bleeding in some.
Lesion and vein characteristics
Brain lesion volume for the EAE animals is summarized in Figure 1A. A total of 97 white matter lesions were counted, 29 in the rhMOG animals and 68 in the WMH animals. Central veins were detected in 86 (88%) of these lesions – 88% of lesions in the rhMOG animals and 89% of lesions in the WMH animals (Figures 1B, 2B, 2C). Of 86 perivenular lesions, 28 developed around deep cerebral veins (DCV) (Figures 1C, 3D, 3E) and 58 around more superficial cerebral veins (SCV) (Figures 1C, 3B). Healthy animals did not develop lesions or changes in vein characteristics.
Figure 1.

Lesion and vein characteristics. A. Cumulative supratentorial lesion volume vs. time for all marmosets, two of which were immunized with recombinant human myelin oligodendrocyte glycoprotein (rhMOG) and two with human white matter homogenate (WMH). B. Supratentorial WM Total number of lesions, number of perivenular lesions, and number of perivenular lesions for which pre-existing veins could be detected on the baseline MRI. C. Vein topography. Number and location (deep vs. superficial) of veins involved in lesions. D. Number of lesions with deep cerebral veins (total and pre-existing). E. Number of lesions with superficial cerebral veins (total and pre-existing).
Figure 2.

Perivenular white matter lesion. A. Ex vivo T2* MRI. Note that after brain perfusion the central vein is not well seen; this is due to replacement of blood with perfusate, which is invisible on MRI. B. Luxol-fast blue staining for myelin. The demyelinated lesion is centered on a small vein (yellow arrow), which is surrounded by a thick inflammatory cuff (orange arrow). C. In vivo averaged T2* showing the hypointense central vein. D. Ex vivo T2* MRI. Note that after brain perfusion the blood is not replaced with perfusate. E. Hematoxilin and Eosin staining. Acute area of hemorrhage – note the extravascular red blood cells. F. Perls' Prussian blue stainin. The staining is negative for iron deposition.
Figure 3.
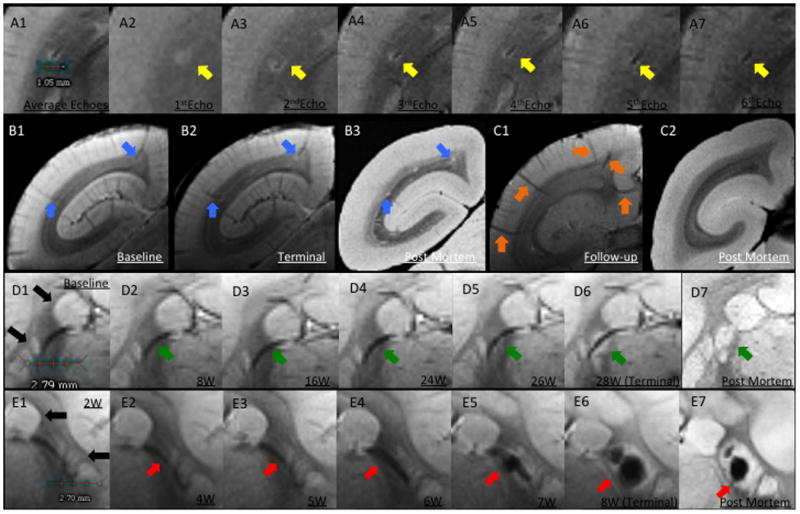
Perivenular development of lesions. A. In vivo T2*. A1, Average of all 6 echoes: A2, TE (echo time)=3.5ms; A3, TE=10.5ms; A4, TE=17.5ms; A5, TE=24.5ms; A6, TE=31.5ms; A7, TE=38.5ms. In A1, the dark line represents the lesion's central vessel, which is surrounded by the bright lesion. A2-A7, Progressive darkening of the central vessel relative to the surrounding lesion, reflecting increasing magnetic susceptibility. B. Left brain hemisphere of WMH1. B1, Arrows point to two pre-existing superficial veins visible at baseline, before EAE induction; B2, Lesions surround these two veins on the final scan; B3, Removal of intravascular blood at time of perfusion allows clear visualization of lesions, but not associated veins, on postmortem MRI. C, Left hemisphere of a control animal. C1, Arrows point to five representative superficial veins; C2, Postmortem MRI with nonvisualized superficial veins. D. Lesion development around a deep white matter vein in WMH2. D1, Baseline (pre-immunization) T2* average. Note that basal ganglia structures have similar signal intensity to lesions (black arrows). D2-D6, Consecutive averaged T2*-weighted images at different time points (W=weeks after immunization). Arrows point to a deep vein that was detected at baseline and was unchanged until 24 weeks, when the earliest sign of the developing lesion could be detected. D7, Postmortem T2*, showing the apparent absence of a central vein due to removal of intravascular blood. E. Lesion development surrounding a deep white matter vein in rhMOG1, with eventual hemorrhage. E1-E6, Consecutive averaged T2*-weighted images at different time points. E5-E6, Arrows point to a lesion with central hemorrhage. E7, Postmortem MRI shows persistent central low signal related to the intralesional hemorrhage. Similar to D, the vein itself is not visualized on the postmortem scan due to removal of intravascular blood.
Vein appearance prior to lesion development
In 62 of 86 perivenular lesions (72%), a clear vein could be detected on the baseline MRI (Figures 1B, 3B, 3D). Of these, 13 (21%) involved deep WM veins (Figures 1D, 3D, 3E), and 49 (79%) involved superficial veins (Figures 1E, 3B). In the remaining 22 lesions, veins became visible only at the time of lesion development.
Postmortem MRI
Based on postmortem MRI we did not detect possible hemorrhage in WMH1 and rhMOG2. Four brain WM lesions were suspected to be hemorrhagic in rhMOG1, one around a superficial vein and 3 evolving deep veins (Figure 3E and 2D). WMH had two clear large areas of suspected hemorrhage, one in a lesion that developed around a superficial vein and the other in a cortical area. In addition, multiple perivenular lesions were centered by dark areas that could either represent hemorrhage or intravascular blood products that were not completely removed at the time of perfusion.
Histopathology correlation
Luxol-fast blue staining for myelin demonstrated that lesions were demyelinated and centered by a small vein. There was a correlation between the hypointense area shown in the T2* lesions and the vein detected by pathology (Figure 2B). Perls' Prussian blue staining was performed in a section where intralesional bleeding was suspected in the postmortem MRI. The staining was negative, ruling out iron deposition as a cause of the large area of signal loss on MRI (Figure 2F).
Discussion
Consistent with our hypothesis, we found that the great majority of focal WM lesions in the marmoset model of MS develop around small veins, and that this development can be detected by serial MRI using a T2*-weighted gradient-echo pulse sequence. Most of these veins were visible prior to disease induction. Given the immunological and pathological similarity of marmoset EAE to human MS, our findings support the notion that in MS lesion development may occur in the same way. This would explain the propensity of lesions to form in areas where relevant veins are commonly found – in marmosets, primarily the subcortical WM (around superficial medullary veins). In human beings, lesions have a more widespread distribution, including the periventricular WM (around deep medullary veins); the subcortical WM (superficial medullary veins); the optic nerves and chiasm; the cerebellar peduncles; and the lateral columns of the spinal cord (15).
A clear vein could be detected on the baseline (pre-EAE) MRI in 72% of perivenular lesions. In the remaining 28% of perivenular lesions, veins became visible only at the time of lesion development. As it is highly unlikely that veins form de novo following immunization, other explanations must be sought for the lack of baseline visualization of veins in some WM lesions. One possible explanation is simply that signal hyperintensity within lesions increased the contrast with existing veins, improving their conspicuity. A more biological explanation could be that developing lesions require more metabolic support, leading to increased extraction of oxygen from the bloodstream through a blood-brain barrier that is more permeable than normal. As deoxyhemoglobin itself is the source of the T2* contrast used to detect veins on MRI (6), such veins would become gradually more visible over time (16). Another possible explanation is perivenular deposition of iron (17), another source of T2* contrast; direct staining of postmortem tissues for iron, which is in progress in our lab, could evaluate this possibility.
One apparent difference between marmoset EAE and human MS is that lesions appear more likely to form around superficial veins (67%) in the marmosets, whereas in MS they are more prominent in the periventricular region drained by the deep medullary veins. This may simply be due to species differences, with less developed periventricular WM in marmosets compared to humans (18). In the baseline studies of EAE marmosets and in the healthy control marmosets, we observed that superficial veins were more clearly seen than deep veins. These superficial veins run through the cortex after exiting the WM, the site of lesion development. By analogy to MS, it seems reasonable that the close relationship between superficial veins and cerebrospinal fluid within the perivascular Virchow-Robin spaces may play a role.
Limitations
The primary limitation of this study is the small size of the experimental groups. An additional limitation is that the in vivo imaging resolution was probably inadequate to detect changes in vessel characteristics over time; such changes, which may include enlargement and diminution of the veins, have been observed in MS (19).
In summary, our findings provide new imaging evidence that marmoset EAE recapitulates important features of MS, including lesion development around WM veins, and that this process can be monitored over time by serial in vivo MRI. Further investigations using this model are likely to shed light on the earliest events in inflammatory demyelinating diseases.
Acknowledgments
The Intramural Research Program of the NINDS supported this research. We thank Lisa Zhang for animal preparation and technical support and Lucinda Prevost and Sam Antonio for assistance in the animal center. We also thank Sheila M. Cummings Macri and Susan Westmoreland for staining and analysis of the section in Figure 2.
Support: This work was supported by the Intramural Research Program of the National Institute of Neurological Disorders and Stroke, National Institutes of Health.
Footnotes
Ethics. All experimental procedures were approved by the NINDS/NIDCD Animal Care and Use Committee.
Disclosure/Conflict of Interest: The authors have no conflicts of interest to disclose.
References
- 1.Lucchinetti C, Bruck W, Parisi J, Scheithauer B, Rodriguez M, Lassmann H. Heterogeneity of multiple sclerosis lesions: implications for the pathogenesis of demyelination. Annals of neurology. 2000;47(6):707–17. doi: 10.1002/1531-8249(200006)47:6<707::aid-ana3>3.0.co;2-q. Epub 2000/06/14. [DOI] [PubMed] [Google Scholar]
- 2.Charcot JM. Histologie de la sclérose en plaques. Paris: Imprimerie L. Pupart-Davyl; 1869. p. 23. [Google Scholar]
- 3.Tallantyre EC, Brookes MJ, Dixon JE, Morgan PS, Evangelou N, Morris PG. Demonstrating the perivascular distribution of MS lesions in vivo with 7-Tesla MRI. Neurology. 2008;70(22):2076–8. doi: 10.1212/01.wnl.0000313377.49555.2e. Epub 2008/05/29. [DOI] [PubMed] [Google Scholar]
- 4.Adams CW. The onset and progression of the lesion in multiple sclerosis. Journal of the neurological sciences. 1975;25(2):165–82. doi: 10.1016/0022-510x(75)90138-0. Epub 1975/06/01. [DOI] [PubMed] [Google Scholar]
- 5.Henderson AP, Barnett MH, Parratt JD, Prineas JW. Multiple sclerosis: distribution of inflammatory cells in newly forming lesions. Ann Neurol. 2009;66(6):739–53. doi: 10.1002/ana.21800. Epub 2009/12/26. [DOI] [PubMed] [Google Scholar]
- 6.Ge Y, Zohrabian VM, Osa EO, Xu J, Jaggi H, Herbert J, et al. Diminished visibility of cerebral venous vasculature in multiple sclerosis by susceptibility-weighted imaging at 3.0 Tesla. Journal of magnetic resonance imaging : JMRI. 2009;29(5):1190–4. doi: 10.1002/jmri.21758. Epub 2009/04/24. [DOI] [PMC free article] [PubMed] [Google Scholar]
- 7.Tallantyre EC, Morgan PS, Dixon JE, Al-Radaideh A, Brookes MJ, Evangelou N, et al. A comparison of 3T and 7T in the detection of small parenchymal veins within MS lesions. Invest Radiol. 2009;44(9):491–4. doi: 10.1097/RLI.0b013e3181b4c144. Epub 2009/08/05. [DOI] [PubMed] [Google Scholar]
- 8.Tallantyre EC, Dixon JE, Donaldson I, Owens T, Morgan PS, Morris PG, et al. Ultra-high-field imaging distinguishes MS lesions from asymptomatic white matter lesions. Neurology. 2011;76(6):534–9. doi: 10.1212/WNL.0b013e31820b7630. Epub 2011/02/09. [DOI] [PMC free article] [PubMed] [Google Scholar]
- 9.Massacesi L, Genain CP, Lee-Parritz D, Letvin NL, Canfield D, Hauser SL. Active and passively induced experimental autoimmune encephalomyelitis in common marmosets: a new model for multiple sclerosis. Annals of neurology. 1995;37(4):519–30. doi: 10.1002/ana.410370415. Epub 1995/04/01. [DOI] [PubMed] [Google Scholar]
- 10.'t Hart BA, Bauer J, Muller HJ, Melchers B, Nicolay K, Brok H, et al. Histopathological characterization of magnetic resonance imaging-detectable brain white matter lesions in a primate model of multiple sclerosis: a correlative study in the experimental autoimmune encephalomyelitis model in common marmosets (Callithrix jacchus) Am J Pathol. 1998;153(2):649–63. doi: 10.1016/s0002-9440(10)65606-4. Epub 1998/08/26. [DOI] [PMC free article] [PubMed] [Google Scholar]
- 11.'t Hart BA, Massacesi L. Clinical, pathological, and immunologic aspects of the multiple sclerosis model in common marmosets (Callithrix jacchus) J Neuropathol Exp Neurol. 2009;68(4):341–55. doi: 10.1097/NEN.0b013e31819f1d24. Epub 2009/04/02. [DOI] [PubMed] [Google Scholar]
- 12.Genain CP, Hauser SL. Experimental allergic encephalomyelitis in the New World monkey Callithrix jacchus. Immunological reviews. 2001;183:159–72. doi: 10.1034/j.1600-065x.2001.1830113.x. Epub 2002/01/10. [DOI] [PubMed] [Google Scholar]
- 13.Brok HP, Uccelli A, Kerlero De Rosbo N, Bontrop RE, Roccatagliata L, de Groot NG, et al. Myelin/oligodendrocyte glycoprotein-induced autoimmune encephalomyelitis in common marmosets: the encephalitogenic T cell epitope pMOG24-36 is presented by a monomorphic MHC class II molecule. J Immunol. 2000;165(2):1093–101. doi: 10.4049/jimmunol.165.2.1093. Epub 2000/07/06. [DOI] [PubMed] [Google Scholar]
- 14.Silva AC, Liu JV, Hirano Y, Leoni RF, Merkle H, Mackel JB, et al. Longitudinal functional magnetic resonance imaging in animal models. Methods Mol Biol. 2011;711:281–302. doi: 10.1007/978-1-61737-992-5_14. Epub 2011/02/01. [DOI] [PMC free article] [PubMed] [Google Scholar]
- 15.Lassmann H. The pathologic substrate of magnetic resonance alterations in multiple sclerosis. Neuroimaging Clin N Am. 2008;18(4):563–76. ix. doi: 10.1016/j.nic.2008.06.005. Epub 2008/12/11. [DOI] [PubMed] [Google Scholar]
- 16.Nathoo N, Agrawal S, Wu Y, Haylock-Jacobs S, Yong VW, Foniok T, et al. Susceptibility-weighted imaging in the experimental autoimmune encephalomyelitis model of multiple sclerosis indicates elevated deoxyhemoglobin, iron deposition and demyelination. Mult Scler. 2012 doi: 10.1177/1352458512460602. Epub 2012/10/03. [DOI] [PubMed] [Google Scholar]
- 17.Adams CW. Perivascular iron deposition and other vascular damage in multiple sclerosis. Journal of neurology, neurosurgery, and psychiatry. 1988;51(2):260–5. doi: 10.1136/jnnp.51.2.260. Epub 1988/02/01. [DOI] [PMC free article] [PubMed] [Google Scholar]
- 18.Hofman MA. On the evolution and geometry of the brain in mammals. Progress in neurobiology. 1989;32(2):137–58. doi: 10.1016/0301-0082(89)90013-0. Epub 1989/01/01. [DOI] [PubMed] [Google Scholar]
- 19.Gaitan MI, de Alwis MP, Sati P, Nair G, Reich DS. Multiple sclerosis shrinks intralesional, and enlarges extralesional, brain parenchymal veins. Neurology. 2013;80(2):145–51. doi: 10.1212/WNL.0b013e31827b916f. Epub 2012/12/21. [DOI] [PMC free article] [PubMed] [Google Scholar]