

Abstract
Objective
Achieving patient recruitment goals is critical for the successful completion of a clinical trial. We designed and developed a web-based dashboard for assisting in the management of clinical trial screening and enrollment.
Materials and methods
We use the dashboard to assist in the management of two observational studies of community-acquired pneumonia. Clinical research associates and managers using the dashboard were surveyed to determine its effectiveness as compared with traditional direct communication.
Results
The dashboard has been in use since it was first introduced in May of 2014. Of the 23 staff responding to the survey, 77% felt that it was easier or much easier to use the dashboard for communication than to use direct communication.
Conclusion
We have designed and implemented a visualization dashboard for managing multi-site clinical trial enrollment in two community acquired pneumonia studies. Information dashboards are useful for clinical trial management. They can be used in a standalone trial or can be included into a larger management system.
Keywords: Clinical trials, Visualization, Data quality
1. Background and significance
Clinical trials are necessary to test and validate new therapies and to advance the quality of care in healthcare. Consequently, the number of trials being conducted globally is increasing each year. A significant barrier to the successful completion of a clinical trial is failure to recruit the appropriate number of subjects. Common contributing factors to low trial participant accrual are short enrollment periods, insufficient numbers of staff available for recruiting patients, and disparate clinical research sites which are difficult to manage as a single unit; any of these problems can lead to a trial being terminated without gaining the knowledge for which it was designed [1].
Numerous approaches to improve patient recruitment have been proposed in the literature and in practice. Integrating trial recruitment more closely with patient care could reduce recruitment overhead [2], [3], [4]. Better access to data from previous trials could aid in planning successful future trials [5]. Many systems to streamline access to medical records for the purpose of recruitment have been proposed and implemented [6], [7], [8]. Efficient and accurate screening is also critical for the success of a clinical trial [9], [10], [11]. Systems for automated trial recruitment have been implemented along with systems specifically addressing time-sensitive recruitment [12], [13]. Clinical Trial Recruitment Support Systems have been designed to integrate clinical workflow with the entire clinical trial and regulatory process [14], [15], [16].
Recently, approaches to conducting multisite clinical trials have become an active area of research because workflows and methodologies for single site trials often do not scale, and systems for managing regional site networks allow for a broader patient pool to be used for recruitment [17], [18]. In addition, mobile and web-based technologies have become important in facilitating these efforts [19].
A tool for stakeholders to follow the progress of a trial could improve communication across multiple clinical trial sites encompassing multiple trial staff. A visual information dashboard coupled with the trial management system can provide this ability. An information dashboard is a visual representation of a body of information displayed on a computer screen. It is meant to show only the information most critical to a user's tasks and to provide timely updates to the information [20]. Some software products like Tableau can be used to help visualize clinically relevant data [21], [22]. Clinical scorecards, which arrange common qualitative clinical information in an easy to understand list format, are similar to dashboards and are used to provide clinical decision support [23].
Patient enrollment is critical to the success of a clinical trial, and an information dashboard can provide real-time data regarding enrollment to assist trial investigators, sponsors, and research staff in making timely decisions about recruiting policies and organizational decisions.
2. Objective
We developed a web-based clinical enrollment dashboard to provide clinical trial personnel with current information regarding enrollment progress for clinical trials. We identified three objectives for our system. The system must:
-
1.
Compactly show current enrollment statistics for the study.
-
2.
Allow clinical trial personnel to update and view enrollment numbers remotely
-
3.
Display data in a way that allows easy comparison of enrollment across different sites
3. Materials and methods
An informational dashboard was designed to support two IRB approved observational studies of community-acquired pneumonia (CAP) managed by the University of Louisville Division of Infectious Diseases. Enrollment sites for both studies include all nine adult hospitals in Jefferson County, Kentucky. Clinical research coordinators working on the study screen, consent, and enroll patients seven days a week. The screening process began with coordinators accessing daily hospital admission records. Patients who meet study criteria were approached, consented, and enrolled into the study. Each hospital provided a partial privacy waiver for accessing medical records for the purpose of determining signs and symptoms consistent with CAP.
3.1. Needs assessment
Prior to developing the enrollment dashboard, our team conducted a needs assessment to determine the relevant information to display to stakeholders of the trial. The following items were selected for inclusion in the dashboard:
-
1.
The number of patients enrolled per hospital per day. This serves as the primary means of quantifying the progress of enrollment.
-
2.
The number of patients eligible to be enrolled per hospital per day. This number serves as the upper limit for possible enrollment.
-
3.
The number of patients admitted to each hospital each day. This places the number of eligible patients within the context of a hospital's total admissions.
-
4.
The number of patients screened per hospital per day. This highlights the efficiency of the screening process.
-
5.
Name of person providing enrollment numbers at a given site. This provides a point of contact for enrollment numbers that may not match case report forms.
Requirements for the implementation of the system were also identified as follows:
-
1.
Flexible software design to support changing project requirements.
-
2.
Real-time capability.
-
3.
Easy to develop and maintain.
In our view a web-based solution best satisfied these requirements; the following components were outlined for implementation of the system: a web server with a database to store enrollment numbers, an interface to allow enrollers to enter enrollment numbers remotely via smartphone or laptop, and a role-specific web page to display enrollment data as an information dashboard. To keep the system simple it only stores enrollment numbers, not any data associated with patients. This reduces the complexity, security, and privacy requirements of the software. Fig. 1 shows an example of the enrollment process using the software.
Fig. 1.

Workflow diagram for patient screening and enrollment. A research associate performs patient screening by connecting to hospital EMR. Screening results are visualized on the dashboard. Research associates enrolling patients on site update enrollment numbers using a mobile device. Managers and Investigators can check dashboard for current enrollment progress.
3.2. Data storage
The backend of the enrollment dashboard uses the Linux-Apache-MySQL-PHP (LAMP) application stack. That is, a Linux-based operating system running an apache web server and MySQL database. A web browser is used to interact with the data using the PHP server-side scripting language. This is a popular backend setup, and there is a large selection of information on how to set up this stack quickly and easily [24]. We chose a cloud-based implementation of this stack as it provides the benefits of automatic scaling to handle traffic, and removes the space and maintenance overhead of using local equipment. Many cloud providers such as Amazon Web Services and Linode offer reasonably priced virtual servers with a LAMP stack configured and ready to deploy.
3.3. Mobile data entry
Each of the trial personnel possesses a smartphone capable of accessing the Internet through a cellular data plan or locally accessible WiFi. Consequently, we implemented a web-based method for staff using their personal computer or smartphone to enter data. We designed a user interface with the Bootstrap framework that allows a web page design to be optimized for display on either desktop browsers or smartphones. Fig. 2 shows an enrollment entry screen on a mobile device. OAuth, a protocol that allows users to access secure online content using third party login information from Google or Twitter accounts, provides authentication for the app. This allows coordinators to login using their Google account name. The data entry app verifies that the name and Google ID of the person logging in is a coordinator with access rights to the system. This type of authentication is especially useful on mobile devices where typing credentials can be challenging. Each coordinator was initially given a 1-h training session on how to enter enrollment data using the app. Additional questions were addressed at weekly meetings as the app began to be used in the field.
Fig. 2.
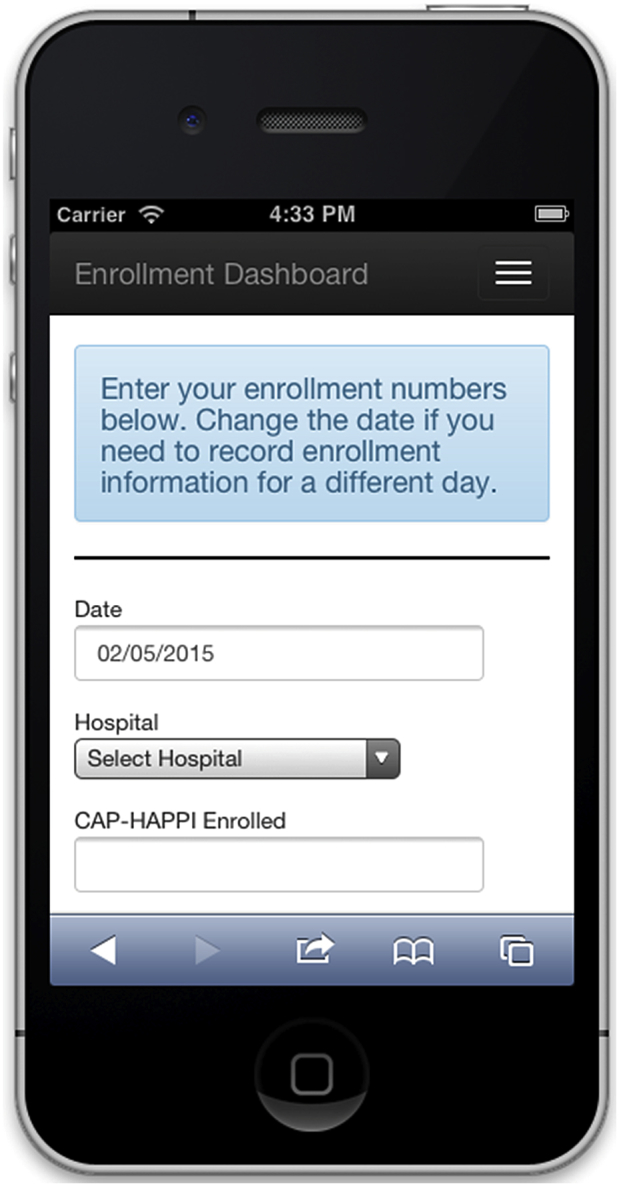
Mobile data entry web page.
3.4. Enrollment dashboard screen
The information dashboard was designed to provide a visualization of enrollment data on a screen accessible to various clinical research personnel. The dashboard was implemented as a web app accessing a secure remote database and graphics were created using the d3 JavaScript library [25]. The primary graphics displayed by the dashboard are nested bar charts for each hospital showing total enrollment per hospital, shown in Fig. 3. Nested bar charts represent a group of bar charts that are overlaid to save space. This works well with daily enrollment visualization, as the bars will always be in descending order within a group. The largest bar will represent the number admitted to the hospital on a particular day, and the following groups will decrease in quantity for the number screened, eligible, and enrolled.
Fig. 3.

Layered bar chart for enrollment data. The number of admitted, screened, eligible and enrolled is different for each site. Representing the graphs in as close a space as possible allows the progress for many sites to be displayed in one view as seen in Fig. 4.
Daily enrollment numbers are also available which show the complete statistics from the enrollment process. For each hospital in the study numbers are shown for how many patients were admitted, prescreened, screened, eligible, and enrolled for each study. The user responsible for uploading the data and update time is also shown.
4. Results
4.1. Dashboard use
The dashboard was made available to users on May 1, 2014 and has been in continuous operation since that time. A public facing version of the dashboard is provided to study sponsors so they can see the enrollment numbers at any time. Research investigators have access to a version that provides data divided by hospital and date, shown in Fig. 4. This data are used to quickly give an impression of enrollment for the two studies. This layout follows the principle of small multiples [26] whereby many similar charts are shown side by side to provide direct comparison. This layout could also be made to scale to a larger numbers of enrollment sites, where charts are grouped in a scrollable window.
Fig. 4.

Enrollment dashboard showing daily enrollment numbers for the nine hospitals participating in the study.
4.2. Improvements to workflow
Research investigators are able to monitor the process of patient enrollment throughout the day. Common problems that occur in the process of having multiple clinical research associates are confusion about which hospitals have patients who need to be screened, which associates will be performing the screening and enrollment, which hospitals have lab samples ready to be retrieved, etc. Management procedures exist for each of these tasks, however there will be day-to-day difficulties that are not covered by policy. In these cases monitoring of the enrollment dashboard can provide increased awareness to clinical investigators and coordinators and improve workflow processes.
4.3. Feedback
Coordinators and managers were asked to complete an optional and confidential survey to assess their opinion of the dashboard's utility. The survey received approval from the Institutional Review Board and was hosted on SurveyMonkey.com. Twenty-three trial staff responded to the survey out of the 48 who were eligible. Seventy-seven percent felt the app made communicating screening and enrollment information easier or much easier than email or other types of messaging. Eighty-seven perccent felt that the app made the screening process more organized than management using direct communication. Results are shown in Table 1.
Table 1.
Survey results from clinical research associates on dashboard utility. Responses were scored on a Likert Scale from Strongly Agree (5) to Strongly Disagree (1).
| Question | Strongly agree (5) | Agree (4) | Neutral (3) | Disagree (2) | Strongly disagree (1) |
|---|---|---|---|---|---|
| Using the daily enrollment website is straightforward. | 15 | 7 | 0 | 1 | 0 |
| Compared to using email and messaging, using the daily enrollment website to communicate screening and enrollment numbers is easier. | 14 | 4 | 3 | 2 | 0 |
| Compared to using email and messaging, using the daily enrollment website makes patient screening more organized. | 13 | 7 | 3 | 0 | 0 |
| Compared to using email and messaging, using the daily enrollment website makes patient enrolling more organized. | 12 | 6 | 4 | 0 | 1 |
| The daily enrollment website has led to changes in enrollment and screening policy. | 7 | 6 | 7 | 2 | 0 |
Survey respondents provided many useful recommendations in the open response questions, many of which are planned for the next iteration of the software. One of the most common requests was to allow the app to retroactively change the number of eligible patients after the patient was approached. Another common request was to have a figure that counts the number of patients who may be eligible but with pending consent, which could happen when the patient was not available to be consented at the time when the coordinator was present in the hospital or when patients were intubated and could not verbally consent. Additionally, it was suggested to stratify the number of unconsented into reasons for refusal, if given.
5. Discussion
As multi-site clinical trials become more common, so will systems for managing the business intelligence required to maintain trial efficiency. While current data collection and trial management solutions like OpenClinica and ClinCapture provide some dashboard functionality, these systems lack the ability to create customized dashboards for highlighting variables of interest or displaying visualizations that differ from the typical bar graph.
Open Source software has the advantage that it can be modified in any way by the users, but this is counterbalanced by the fact that the users must maintain the software and deploy it on their own webserver. Open source trial management software can be extended to include dashboard implementations like the one presented, but the programming experience needed will vary. The REDCap data collection software [27] is not open source, but does provide an accessible software structure that can be customized by end users. The database for REDCap can be accessed using a MySQL database interface, allowing data to be connected to customized information dashboards.
The clinical trial enrollment dashboard would benefit from many additional features. The ability to run reports that can be downloaded as well as the ability to stratify enrollment data according to factors such as country of enrollment or type of enrollment site is currently in development for the next iteration of the software. Also in development are visualizations to show trends for enrollment at each hospital. One approach is to use sparklines [28], which are small line graphs placed next to each site enrollment chart.
5.1. Limitations
While an extensive amount of programming expertise was not required for the creation of the system, adding more complicated features would increase the complexity and development time. Several features such as a comprehensive audit trail that tracks uploads to the system, user-customizable views, and report generation are currently in development.
6. Conclusion
An Information dashboard can be a useful tool to improve the conduct of clinical trials. We have designed and implemented a visualization dashboard for managing multi-site clinical trial enrollment in two community acquired pneumonia studies. Similar dashboards can be implemented as add-ons to existing systems or deployed as a separate web service using available data sources.
Acknowledgements
Support for JHC provided by National Institutes of Health (NIH) grant P20GM103436 (Nigel Cooper, PI).
References
- 1.Peters-Lawrence M. Clinical trial implementation and recruitment: lessons learned from the early closure of a randomized clinical trial. Contemp. Clin. Trials. 2012;33(2):291–297. doi: 10.1016/j.cct.2011.11.018. [DOI] [PMC free article] [PubMed] [Google Scholar]
- 2.Weng C. Using EHRs to integrate research with patient care: promises and challenges. J. Am. Med. Inf. Assoc.: JAMIA. 2012;19(5):684–687. doi: 10.1136/amiajnl-2012-000878. [DOI] [PMC free article] [PubMed] [Google Scholar]
- 3.Weng C. An integrated model for patient care and clinical trials (IMPACT) to support clinical research visit scheduling workflow for future learning health systems. J. Biomed. Inf. 2013;46(4):642–652. doi: 10.1016/j.jbi.2013.05.001. [DOI] [PMC free article] [PubMed] [Google Scholar]
- 4.Ferranti J. The design and implementation of an open-source, data-driven cohort recruitment system: the Duke integrated subject cohort and enrollment research network (DISCERN) J. Am. Med. Inf. Assoc. 2012;19(e1):e68–e75. doi: 10.1136/amiajnl-2011-000115. [DOI] [PMC free article] [PubMed] [Google Scholar]
- 5.Mitchell A., Hirsch B., Abernethy A. Lack of timely accrual information in oncology clinical trials: a cross-sectional analysis. Trials. 2014;15(1):92. doi: 10.1186/1745-6215-15-92. [DOI] [PMC free article] [PubMed] [Google Scholar]
- 6.Bache R., Miles S., Taweel A. An adaptable architecture for patient cohort identification from diverse data sources. J. Am. Med. Inf. Assoc.: JAMIA. 2013;20(e2) doi: 10.1136/amiajnl-2013-001858. [DOI] [PMC free article] [PubMed] [Google Scholar]
- 7.Köpcke F. Secondary use of routinely collected patient data in a clinical trial: an evaluation of the effects on patient recruitment and data acquisition. Int. J. Med. Inf. 2013;82(3):185–192. doi: 10.1016/j.ijmedinf.2012.11.008. [DOI] [PubMed] [Google Scholar]
- 8.Hurdle J. Identifying clinical/translational research cohorts: ascertainment via querying an integrated multi-source database. J. Am. Med. Inf. Assoc.: JAMIA. 2013;20(1):164–171. doi: 10.1136/amiajnl-2012-001050. [DOI] [PMC free article] [PubMed] [Google Scholar]
- 9.Penberthy L. Automated matching software for clinical trials eligibility: measuring efficiency and flexibility. Contemp. Clin. Trials. 2010;31(3):207–217. doi: 10.1016/j.cct.2010.03.005. [DOI] [PMC free article] [PubMed] [Google Scholar]
- 10.Dugas M. Routine data from hospital information systems can support patient recruitment for clinical studies. Clin. Trials Lond. Engl. 2010;7(2):183–189. doi: 10.1177/1740774510363013. [DOI] [PubMed] [Google Scholar]
- 11.Thadani S. Electronic screening improves efficiency in clinical trial recruitment. J. Am. Med. Inf. Assoc.: JAMIA. 2009;16(6):869–873. doi: 10.1197/jamia.M3119. [DOI] [PMC free article] [PubMed] [Google Scholar]
- 12.Beauharnais C. Efficacy and cost-effectiveness of an automated screening algorithm in an inpatient clinical trial. Clin. Trials Lond. Engl. 2012;9(2):198–203. doi: 10.1177/1740774511434844. [DOI] [PMC free article] [PubMed] [Google Scholar]
- 13.Herasevich V. Enrollment into a time sensitive clinical study in the critical care setting: results from computerized septic shock sniffer implementation. J. Am. Med. Inf. Assoc.: JAMIA. 2011;18(5):639–644. doi: 10.1136/amiajnl-2011-000228. [DOI] [PMC free article] [PubMed] [Google Scholar]
- 14.Cuggia M., Besana P., Glasspool D. Comparing semi-automatic systems for recruitment of patients to clinical trials. Int. J. Med. Inf. 2011;80(6):371–388. doi: 10.1016/j.ijmedinf.2011.02.003. [DOI] [PubMed] [Google Scholar]
- 15.Mitchell R. A unified web-based query and notification system (QNS) for subject management, adverse events, regulatory, and IRB components of clinical trials. Clin. Trials Lond. Engl. 2005;2(1):61–71. doi: 10.1191/1740774505cn68oa. [DOI] [PubMed] [Google Scholar]
- 16.Bian J. CLARA: an integrated clinical research administration system. J. Am. Med. Inf. Assoc. 2014;21(e2):e369–e373. doi: 10.1136/amiajnl-2013-002616. [DOI] [PMC free article] [PubMed] [Google Scholar]
- 17.Kernan W. Boosting enrolment in clinical trials: validation of a regional network model. Clin. Trials Lond. Engl. 2011;8(5):645–653. doi: 10.1177/1740774511414925. [DOI] [PMC free article] [PubMed] [Google Scholar]
- 18.Levett K. Site-specific predictors of successful recruitment to a perinatal clinical trial. Clin. Trials. 2014;11(5):584–589. doi: 10.1177/1740774514543539. [DOI] [PubMed] [Google Scholar]
- 19.Russell C. Use of interactive telephone technology for longitudinal data collection in a large trial. Contemp. Clin. trials. 2012;33(2):364–368. doi: 10.1016/j.cct.2011.10.012. [DOI] [PubMed] [Google Scholar]
- 20.Few S. O'Reilly; Sebastopol: 2006. Information Dashboard Design: the Effective Visual Communication of Data; p. 211. [Google Scholar]
- 21.Shih D. Facilitating the analysis of immunological data with visual analytic techniques. J. Vis. Exp.: JoVE. 2011;47 doi: 10.3791/2397. [DOI] [PMC free article] [PubMed] [Google Scholar]
- 22.Im J.-F., McGuffin M., Leung R. GPLOM: the generalized plot matrix for visualizing multidimensional multivariate data. IEEE Trans. Vis. Comput. Graph. 2013;12:2606–2614. doi: 10.1109/TVCG.2013.160. [DOI] [PubMed] [Google Scholar]
- 23.Guth R. Decision analysis for metric selection on a clinical quality scorecard. Am. J. Med. Qual. Off. J. Am. Coll. Med. Qual. 2015 doi: 10.1177/1062860615589117. http://www.ncbi.nlm.nih.gov/pubmed/26038608 [DOI] [PubMed] [Google Scholar]
- 24.Ltd, B.P. Web Server technologies Web Usage Statistics. 2015 [cited 2015 June 15]; Available from: trends.builtwith.com/web-server.
- 25.Bostock M., Ogievetsky V., Heer J. D3 data-driven documents. IEEE Trans. Vis. Comput. Graph. 2011;17(12):2301–2309. doi: 10.1109/TVCG.2011.185. [DOI] [PubMed] [Google Scholar]
- 26.Tufte E.R., Graves-Morris P. vol. 2. Graphics Press Cheshire; CT: 1983. (The Visual Display of Quantitative Information). [Google Scholar]
- 27.Harris P. Research electronic data capture (REDCap)–a metadata-driven methodology and workflow process for providing translational research informatics support. J. Biomed. Inf. 2009;42(2):377–381. doi: 10.1016/j.jbi.2008.08.010. [DOI] [PMC free article] [PubMed] [Google Scholar]
- 28.Tufte E.R. 2006. Beautiful Evidence. New York. [Google Scholar]