

Abstract
Background
NAFLD impacts patient reported outcomes (PROs). Our aim was to assess the impact of NAFLD on patients’ HRQOL.
Methods
National Health and Nutrition Examination Survey (NHANES) 2001–2011 data were used to identify adult patients with NAFLD [Fatty Liver Index (FLI) > 60 in absence of other liver disease and excessive alcohol >20 g/day for men, >10 g/day for women]. Patients with other chronic diseases (ex. HIV, cancer, end-stage kidney disease) were excluded. Subjects without any of these conditions were healthy controls. HCV RNA (+) patients were HCV-controls. All patients completed NHANES HRQOL-4 questionnaire. Linear regression determined the association between NAFLD and HRQOL components adjusting for age, gender, race, and BMI.
Results
Participants with complete data were included (n = 9661); 3333 NAFLD (age 51 years and BMI 34 kg/m2); 346 HCV+ (age 49 years; BMI 27 kg/m2) and 5982 healthy controls (age 48 years and BMI 26 kg/m2). The proportion of subjects rating their health as “fair” or “poor” in descending order were HCV controls (30 %) NAFLD (20 %) and healthy controls (10 %) (p < 0.001). HRQOL-4 components scores 2–4 were lowest for HCV, followed by NAFLD and then healthy controls (p-values p = 0.011 to < .0001). After adjustment for age, gender, race, and BMI, NAFLD patients were 18–20 % more likely to report days when their physical health wasn’t good or were unable to perform daily activities as a result (p < .0001).
Conclusions
NAFLD causes impairment of HRQOL. As NAFLD is becoming the most important cause of CLD, its clinical and PRO impact must be assessed.
Background
Non-alcoholic fatty liver disease (NAFLD) is an important cause of chronic liver disease worldwide [1–5]. NAFLD has been associated with cirrhosis, hepatocellular carcinoma and is currently the second indication for liver transplantation [6].
NAFLD is increasingly being diagnosed in patients with nonspecific symptoms with incidental elevation of aminotransferases [7, 8]. Besides fatigue, NAFLD patients may also experience other symptoms such as anxiety, depression, cognitive impairment, and loss of self-esteem [9]. These symptoms significantly impact patients’ well-being and health-related quality of life (HRQOL) [10]. Although the impact of chronic hepatitis C infection on HRQOL has been reported extensively, there is little published data about HRQOL assessment in patients with NAFLD. Therefore, our aim was to assess the impact of NAFLD on patients’ HRQOL as compared to HRQOL impairment in patients with CH-C and those without liver disease.
Methods
Study design and population
Availability of data and materials: National cross-sectional health survey data [National Health and Nutrition Examination Survey (NHANES) conducted between 2001 and 2011] were used. The Center for Disease Control and Prevention (CDC) collected the data by an interviewer-administered questionnaire conducted in participants’ homes by trained interviewers. Clinical data were obtained through the use of specially designed and equipped mobile examination centers. Participants (n = 49,762) were excluded if they had Alcoholic Liver Disease (ALD) (alcohol consumption of ≥ 20 g/day for men, ≥ 10 g/day for women over past 12 months), other chronic diseases such as HIV, cancer, end-stage kidney disease and/or had missing data on key variables (demographic and HRQOL), (Fig. 1- Flow chart for Eligibility, NHANES, 2001–2012)
Fig. 1.
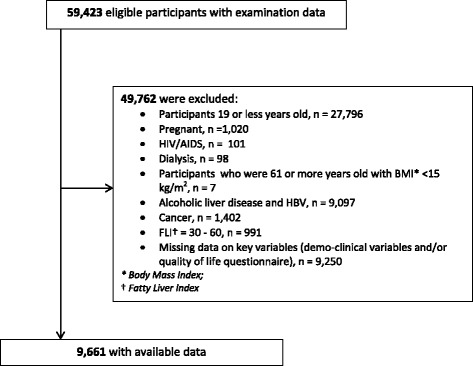
Flow chart for Eligibility, NHANES, 2001-2012
Sociodemographic variables
Age (years), gender, race/ethnicity (white, black, other), education (less than high school, high school, college or above), annual household income (less than $55,000 per year, $55,000 or more) were self-reported. Anthropometric measurements (height, weight) were obtained by trained staff during the medical examination.
Definitions of chronic liver diseases
The following liver diseases were identified and included in the study: (1) Chronic Hepatitis C diagnosis was based on a positive Hepatitis C antibody (ELISA II analysis) or HCV RNA as detected by polymerase chain reaction; (2) NAFLD was determined by the Fatty Liver Index (FLI). A FLI score of 60 or more in the absence of HCV, HBV and significant alcohol consumption was NAFLD; and (3) Participants without any chronic liver diseases and a FLI score ≤ 30 were considered as Healthy Controls.
Assessment of quality of life
Four components of a participants’ health-related quality of life (HRQOL-4) over a previous 30-day period were assessed during the scheduled visit. The four component questions were: Component 1 (C1): Rate your health status as poor, fair, good, very good, or excellent. ; (b) C2 Thinking about your physical health, which includes physical illness and injury, for how many days during the past 30 days was your physical health not good; (c) C3 Thinking about your mental health, which includes stress, depression, and problems with emotions, for how many days during the past 30 days was your mental health not good; and (d) C4 About how many days did poor physical or mental health keep him/her from doing your usual activities, such as self-care, work, or recreation.
Data analyses
For analyses, participants were divided into two groups: fair/poor coded as “1” and good/very good/excellent were coded as “0” for component 1. For components C2–C4, we coded participants who reported no poor days (50 % of participants) as “0” and coded the others who reported any number of days >0 as “1”.
Simple logistic regression models with linearized variance estimation and weighting were used to estimate the association between self-reported quality of life questionnaire (for each component of C1–C4, separately) and liver disease while adjusting for age, gender, race, BMI, smoking, education, diabetes, and heart disease. We did not adjust household income in the final model due to a high correlation with education (Spearman rank-order rho = 0.40, P < .0001). Spearman rank-order correlations were estimated to examine an association between the participants’ ranking their health condition (C1) and demographic variables stratified by liver disease. SAS V9.3 was used for analyses (SAS Institute, Cary, NC). To account for the complex survey design from NHANES, SAS survey command with sampling weight, stratification and clustering variables were used except for Spearman’s rank-order correlation analyses.
Results
Subjects’ baseline characteristics
A total of 9661 participants with complete data were enrolled in the study (Table 1). Of these, 346 patients had HCV, 3333 had NAFLD and 5982 were considered controls. Mean age of the patients was 48.8 years (48.8 ± 0.50, p < .0001 in HCV, 51.3 ± 0.36, p < .0001 in NAFLD and 47.5 ± 0.39, p < .0001 in Control). NAFLD patients had significantly higher body mass index (BMI) as compared to the Controls (33.66 ± 0.14 vs 26.22 ± 0.10, p < .0001) and HCV patients (33.66 ± 0.14 vs 27.26 ± 0.41, p < .0001). Of the NAFLD cohort, 57.8 % were male and 72.4 % were White. Furthermore, metabolic syndrome components such as hyperlipidemia, hypertension, and insulin resistance were more common in the NAFLD group, as well as history of heart disease (all p < .001).
Table 1.
Characteristics of Study by Liver Disease, NHANES, 2001–2012
| Variables | HCV | NAFLD | Control | P valuea | P valueb | P valuec |
|---|---|---|---|---|---|---|
| (n = 346) | (n = 3333) | (n = 5982) | ||||
| Age (years): mean (SE) | 48.86 (0.50) | 51.31 (0.36) | 47.50 (0.39) | 0.058 | <.0001 | <.0001 |
| Body Mass Index (kg/m2): mean (SE) | 27.26 (0.41) | 33.66 (0.14) | 26.22 (0.10) | 0.037 | <.0001 | <.0001 |
| Male | 228 (66.87 %) | 1817 (57.79 %) | 3103 (50.03 %) | <.0001 | <.0001 | 0.014 |
| Race, | <.0001 | 0.034 | <.0001 | |||
| White | 134 (63.53 %) | 1612 (72.46 %) | 3221 (75.15 %) | |||
| Black | 137 (22.87 %) | 684 (10.88 %) | 1164 (9.50 %) | |||
| Other | 75 (13.60 %) | 1037 (16.66 %) | 1597 (15.35 %) | |||
| Comorbid disease, | ||||||
| Diabetes | 56 (13.03 %) | 918 (20.75 %) | 503 (6.05 %) | <.0001 | <.0001 | 0.010 |
| Hyperlipidemia | 177 (44.12 %) | 2051 (57.01 %) | 2286 (32.50 %) | <.0001 | <.0001 | <.0001 |
| High blood pressure | 119 (29.46 %) | 2020 (58.99 %) | 2351 (38.35 %) | 0.009 | <.0001 | <.0001 |
| Insulin resistance | 81 (47.34 %) | 2147 (66.03 %) | 442 (12.24 %) | <.0001 | <.0001 | <.0001 |
| Heart disease | 47 (9.46 %) | 540 (13.83 %) | 558 (6.79 %) | 0.119 | <.0001 | 0.040 |
| Asthma | 44 (14.62 %) | 394 (12.69 %) | 433 (7.87 %) | 0.001 | <.0001 | 0.468 |
| NHANES cycle, | 0.135 | 0.696 | 0.152 | |||
| 2001–2002 | 71 (24.07 %) | 541 (16.24 %) | 1022 (16.73 %) | |||
| 2003–2004 | 49 (16.81 %) | 534 (17.15 %) | 856 (15.29 %) | |||
| 2005–2006 | 41 (13.80 %) | 499 (16.98 %) | 893 (16.47 %) | |||
| 2007–2008 | 75 (18.37 %) | 630 (17.07 %) | 1056 (16.63 %) | |||
| 2009–2010 | 53 (11.37 %) | 602 (15.22 %) | 1117 (16.74 %) | |||
| 2011–2012 | 57 (15.58 %) | 527 (17.35 %) | 1038 (18.13 %) |
Pvalues were reported by chi-square test for categorical variables and t-test for numerical variables;
aComparisons between HCV and Control
bComparisons between NAFLD and Control
cComparisons between HCV and NAFLD
Health related quality of life in NAFLD
Component 1 of HRQOL questionnaire
Component 1 of HRQOL was concerned with overall HRQOL assessment (Table 2, Fig. 2). The proportion of participants who rated their health as excellent or very good was significantly higher in the Control group as compared to both NAFLD and HCV groups (90 vs 78, 68 %, respectively; p < .0001). The overall HRQOL score was lowest for HCV and then NAFLD patients.
Table 2.
HRQOL in Participants with NAFLD and HCV, NHANES, 2001–2012
| Variables | HCV | NAFLD | Control | P valuea | P valueb | P valuec |
|---|---|---|---|---|---|---|
| (n = 346) | (n = 3333) | (n = 5982) | ||||
| HRQOL-4 components, | ||||||
| C1, | <.0001 | <.0001 | 0.005 | |||
| Excellent | 20 (7.19 %) | 201 (6.49 %) | 863 (17.36 %) | |||
| Very good/Good | 201 (60.75 %) | 2112 (71.02 %) | 4215 (72.22 %) | |||
| Fair | 98 (24.81 %) | 831 (18.83 %) | 806 (9.09 %) | |||
| Poor | 27 (7.24 %) | 189 (3.66 %) | 98 (1.32 %) | |||
| C2 (no day = 0) | 187 (52.47 %) | 2000 (61.34 %) | 4048 (68.31 %) | <.0001 | <.0001 | 0.012 |
| C3 (no day = 0) | 175 (46.58 %) | 2174 (64.07 %) | 3868 (62.60 %) | <.0001 | 0.257 | <.0001 |
| C4 (no day = 0) | 230 (64.96 %) | 2663 (79.84 %) | 5050 (84.41 %) | <.0001 | <.0001 | <.0001 |
P values were reported by chi-square test;
aComparisons between HCV and Control
bComparisons between NAFLD and Control
cComparisons between HCV and NAFLD
Fig. 2.
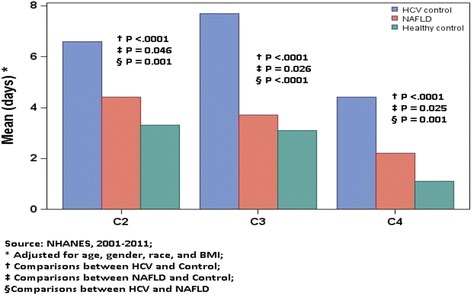
Adjusted* mean HRQOL components (C2-C4) by liver disease, and pair-wise comparisons (t-test), NHANES, 2001–2011
Component 2 of HRQOL questionnaire
Component 2 was mostly involved with number of days with physical health issues. In fact, the control group was more likely to report no days of having physical health problems compared to the NAFLD group (68.3 vs 61.3 %, p < .001). On the other hand, HCV patients were least likely to report no days of having physical health problems (52.4 %).
Component 3 of HRQOL questionnaire
Component 3 was concerned with number of days with mental health issues. In this context, NAFLD patients reported similar mental health issues to the controls (62.6 vs 64 %, p > 0.05). On the other hand, HCV patients were less likely to report no days of having mental health problem, compared to controls and NAFLD patients (46.5 vs 62.6 and 64 %, p < 0.01).
Component 4 of HRQOL questionnaire
Component 4 was concerned with number of days that the physical and mental health issues would prevent patients from their activities. Again, the control group had significantly fewer number of days that physical or mental health kept the participants away from doing their usual activities (self-care, work, or recreation) during last 30-days compared to the NAFLD group (84.4 % in the Control group reported zero effected days vs. 79.8 % in NAFLD; p < .0001). HCV patients had the worst score with only 64.9 % in this group reporting zero effected day (p < .0001).
After adjusting for age, gender, race, and BMI, the association between PRO impairment and the diagnosis of HCV (C1–C4) and NAFLD (C1, C2 and C4) remained significant (Table 3).
Table 3.
Adjusted* odds ratios (OR) with 95 % confidence intervals (CIs) for each outcome of HRQOL, NHANES, 2001-2012 (reference for C1 = excellent/very good/good and for C2–C4 = no days)
| C1 | C2 | C3 | C4 | |
|---|---|---|---|---|
| Variable | OR a (95 % CI) | |||
| Control | Reference | Reference | Reference | Reference |
| HCV | 2.07 (1.48–2.88) | 1.82 (1.36–2.43) | 1.98 (1.52–2.58) | 2.83 (2.05–3.90) |
| NAFLD | 1.22 (1.03–1.44) | 1.18 (1.03–2.08) | 0.95 (0.82–1.10) | 1.20 (1.02–1.41) |
a Adjusted for age, gender, race, BMI, education, income, smoking status, diabetes, and heart disease
(Figure 2: Adjusted* mean HRQOL components (C2–C4) by liver disease, and pair-wise comparisons (t-test), NHANES, 2001–2011).
Discussion
Patient reported outcomes (PROs) such as HRQOL are surrogates for a patient’s experience [11]. Assessing PROs are important to accurately estimate the burden of chronic liver disease and its treatment on patients’ well-being. In this study, we used population-based data to assess HRQOL in patients with NAFLD. Our data analysis showed that NAFLD patients indeed experienced significant impairment of their HRQOL. In this context, almost one fourth (22 %) of NAFLD patients reported their health as being poor or fair which was significantly more than the healthy controls (10 %). Furthermore, this impairment resulted in a reduction of patients’ ability to perform their daily activities. Interestingly, NAFLD patients had more impairment of their physical health than their mental health. These data are partially consistent with the data previously reported showing NAFLD patients have PRO burden related to bodily pain, shortness of breath and muscle cramps as well as anxiety, unhappiness, being irritable and having mood swings [12]. Furthermore, our data is consistent with HRQOL assessment using Short Form-36 questionnaire reporting impairment in physical functioning (how much physical activities are limited), role physical (how much physical health impacts work and daily activities), bodily pain (limitations because of pain), vitality (how tired/full of energy subject feels), and role emotional (the impact of emotional problems on work and daily activities) [13].
Although not exactly clear, the reported poor physical health in NAFLD patients may be related to fatigue. Fatigue has been shown in previous studies to be a significant problem for NAFLD patients [8, 14–16]. In fact, in one such study, autonomic dysfunction and fatigue were both common in NAFLD [14, 17]. This could provide some mechanistic pathway for the development of fatigue in patients with NAFLD.
It is also important to note that impairment of HRQOL in NAFLD was less pronounced than those with HCV. In fact, the mental health aspect of PROs was more profoundly affected in HCV than NAFLD. This is not a surprise given the strong association of HRQOL with depression in patients with HCV [18–20].
Conclusion
In conclusion, NAFLD is associated with impairment of patients’ HRQOL. Since previous studies reporting association of NAFLD with PRO impairment (12–13) were reported from the tertiary care centers, their results could have been associated with referral bias. This current study using large population database from NHANES provides additional data documenting impairment of HRQOL in patients with NAFLD. This integrated approach to understanding the clinical and PRO burden of NAFLD can provide a more comprehensive approach to treatment and management of patients with NAFLD.
Ethics approval
This study was approved by the IRB, the approval number is NHANES IRB: 12.1074.
Availability of data
In this study, NHANES data was used, which is available online at NHANES website.
Acknowledgments
We would like to thank Brian Lam and Beatty Liver & Obesity Research Program staff for their great support during the formation of this study.
Funding
This study was internally funded without any external reimbursement, fee or salary.
Abbreviations
- ALD
alcoholic liver disease
- BMI
body mass index
- CDC
center for disease control and prevention
- CH-C
chronic Hepatitis C
- CLD
chronic liver disease
- FLI
fatty liver index
- HRQOL
health related quality of life
- NAFLD
nonalcoholic fatty liver disease
- NHANES
National Health and Nutrition Examination Survey
- PRO
patient reported outcome
Appendix
Table 4.
Spearman rho correlation for rating* their health status as poor to excellent (C1 component) with demographic variables, stratified health conditions, NHANES, 2001–2012
| rho , P | |||||
|---|---|---|---|---|---|
| Variables | Total (overall), | HCV | NAFLD | Heart disease | Diabetes |
| n = 9661 | n = 346 | n = 3333 | n = 1145 | n = 1477 | |
| Age (years) | 0.14, <0.01 | 0.11, 0.03 | 0.10, <0.01 | −0.12, <0.01 | −0.06, 0.06 |
| Body Mass Index (BMI) (kg/m2) | 0.23, <0.01 | 0.16, 0.04 | 0.12, <0.01 | 0.16, <0.01 | 0.13, <0.01 |
| Gender (1 = male and 0 = female) | −0.06, <0.01 | −0.11, 0.08 | −0.16, <0.01 | −0.12, <0.01 | −0.13, <0.01 |
| White (1 = yes and 0 = no) | −0.19, <0.01 | −0.10, 0.09 | −0.16, <0.01 | −0.20, <0.01 | −0.14, <0.01 |
| Black (1 = yes and 0 = no) | 0.06, <0.01 | 0.08, 0.30 | −0.01, 0.44 | 0.11, <0.01 | 0.02, <0.01 |
| Other (1 = yes and 0 = no) | 0.15, <0.01 | 0.04, 0.43 | 0.18, <0.01 | 0.13, <0.01 | 0.13, <0.01 |
| C2: days physical health, which includes physical illness and injury not good | 0.30, <0.01 | 0.45, <0.01 | 0.34, <0.01 | 0.41, <0.01 | 0.39, <0.01 |
| C3: days mental health, which includes stress, depression, and problems with emotions not good | 0.17, <0.01 | 0.30, <0.01 | 0.21, <0.01 | 0.28, <0.01 | 0.26, <0.01 |
| C4: days poor physical or mental health keep him/her from doing your usual activities, such as self-care, work, or recreation not good | 0.21, <0.01 | 0.39, <0.01 | 0.24, <0.01 | 0.28, <0.01 | 0.27, <0.01 |
*Ranges from 1 to 5 with a higher score indicates worse self-health assessment (1 = excellent; 2 = very good; 3 = good; 4 = fair; and 5 = poor)
Footnotes
Competing interests
The authors declare that they have no competing interests.
Authors’ contributions
PG participated in the study design, helped the interpretation of the data and to draft the manuscript. MO performed the statistical analysis and helped the interpretation of the data. MS participated in the interpretation of the data and revised the manuscript. RC, SF and AK made contributions to the study design as well as interpretation of the data. ZY conceived of the study, participated substantially in its design and coordination, and helped to draft the manuscript. All authors read and approved the final manuscript.
Contributor Information
Pegah Golabi, Email: pegah.golabi@inova.org.
Munkhzul Otgonsuren, Email: munkhzul.otgonsuren@inova.org.
Rebecca Cable, Email: rebecca.cable@inova.org.
Sean Felix, Email: sean.felix@inova.org.
Aaron Koenig, Email: koenigab@gmail.com.
Mehmet Sayiner, Email: mehmet.sayiner@inova.org.
Zobair M. Younossi, Phone: (703) 776-2540, Email: Zobair.younossi@inova.org
References
- 1.Hamaguchi M, Takeda N, Kojima T, Ohbora A, Kato T, Sarui H, et al. Identification of individuals with non-alcoholic fatty liver disease by the diagnostic criteria for the metabolic syndrome. World J Gastroenterol. 2012;18:1508–16. doi: 10.3748/wjg.v18.i13.1508. [DOI] [PMC free article] [PubMed] [Google Scholar]
- 2.Dyson JK, Anstee QM, McPherson S. Non-alcoholic fatty liver disease: a practical approach to treatment. Frontline Gastroenterol. 2014;5:277–86. doi: 10.1136/flgastro-2013-100404. [DOI] [PMC free article] [PubMed] [Google Scholar]
- 3.Younossi ZM, Otgonsuren M, Henry L, Venkatesan C, Mishra A, Erario M, et al. Association of Non-alcoholic Fatty Liver Disease (NAFLD) with Hepatocellular Carcinoma (HCC) in the United States from 2004-2009. Hepatology. 2015 doi: 10.1002/hep.28123. [DOI] [PubMed] [Google Scholar]
- 4.Rinella ME. Nonalcoholic fatty liver disease: a systematic review. JAMA. 2015;313:2263–73. doi: 10.1001/jama.2015.5370. [DOI] [PubMed] [Google Scholar]
- 5.Chalasani N, Younossi Z, Lavine JE, Diehl AM, Brunt EM, Cusi K, et al. The diagnosis and management of non-alcoholic fatty liver disease: practice Guideline by the American Association for the Study of Liver Diseases, American College of Gastroenterology, and the American Gastroenterological Association. Hepatology. 2012;55:2005–23. doi: 10.1002/hep.25762. [DOI] [PubMed] [Google Scholar]
- 6.Wong RJ, Aguilar M, Cheung R, Perumpail RB, Harrison SA, Younossi ZM, et al. Nonalcoholic steatohepatitis is the second leading etiology of liver disease among adults awaiting liver transplantation in the United States. Gastroenterology. 2015;148:547–55. doi: 10.1053/j.gastro.2014.11.039. [DOI] [PubMed] [Google Scholar]
- 7.Younossi ZM, Henry L. Economic and quality-of-life implications of Non-alcoholic fatty liver disease. Pharmacoeconomics. 2015;33(12):1245–53. doi: 10.1007/s40273-015-0316-5. [DOI] [PubMed] [Google Scholar]
- 8.Newton JL. Systemic symptoms in non-alcoholic fatty liver disease. Dig Dis. 2010;28:214–9. doi: 10.1159/000282089. [DOI] [PubMed] [Google Scholar]
- 9.Mahmood S. Assessment of health related quality of life in chronic liver disease patients using the Japenese versions of CLDQ and SF-36. Open Gastroenterol J. 2008;2:57–63. doi: 10.2174/1874259900802010057. [DOI] [Google Scholar]
- 10.Loria A, Escheik C, Gerber NL, Younossi ZM. Quality of life in cirrhosis. Curr Gastroenterol Rep. 2013;15:301. doi: 10.1007/s11894-012-0301-5. [DOI] [PubMed] [Google Scholar]
- 11.Younossi ZM, Stepanova M, Nader F, Lam B, Hunt S. The patient’s journey with chronic hepatitis C from interferon plus ribavirin to interferon- and ribavirin-free regimens: a study of health-related quality of life. Aliment Pharmacol Ther. 2015;42:286–95. doi: 10.1111/apt.13269. [DOI] [PubMed] [Google Scholar]
- 12.Dan AA, Kallman JB, Wheeler A, Younoszai Z, Collantes R, Bondini S, et al. Health-related quality of life in patients with non-alcoholic fatty liver disease. Aliment Pharmacol Ther. 2007;26:815–20. doi: 10.1111/j.1365-2036.2007.03426.x. [DOI] [PubMed] [Google Scholar]
- 13.Afendy A, Kallman JB, Stepanova M, Younoszai Z, Aquino RD, Bianchi G, et al. Predictors of health-related quality of life in patients with chronic liver disease. Aliment Pharmacol Ther. 2009;30:469–76. doi: 10.1111/j.1365-2036.2009.04061.x. [DOI] [PubMed] [Google Scholar]
- 14.Newton JL, Pairman J, Wilton K, Jones DE, Day C. Fatigue and autonomic dysfunction in non-alcoholic fatty liver disease. Clin Auton Res. 2009;19:319–26. doi: 10.1007/s10286-009-0031-4. [DOI] [PubMed] [Google Scholar]
- 15.Newton JL, Jones DE, Henderson E, Kane L, Wilton K, Burt AD, et al. Fatigue in non-alcoholic fatty liver disease (NAFLD) is significant and associates with inactivity and excessive daytime sleepiness but not with liver disease severity or insulin resistance. Gut. 2008;57:807–13. doi: 10.1136/gut.2007.139303. [DOI] [PubMed] [Google Scholar]
- 16.Gerber L, Otgonsuren M, Mishra A, Escheik C, Birerdinc A, Stepanova M, et al. Non-alcoholic fatty liver disease (NAFLD) is associated with low level of physical activity: a population-based study. Aliment Pharmacol Ther. 2012;36:772–81. doi: 10.1111/apt.12038. [DOI] [PubMed] [Google Scholar]
- 17.Kallman J, O’Neil MM, Larive B, Boparai N, Calabrese L, Younossi ZM. Fatigue and health-related quality of life (HRQL) in chronic hepatitis C virus infection. Dig Dis Sci. 2007;52:2531–9. doi: 10.1007/s10620-006-9708-x. [DOI] [PubMed] [Google Scholar]
- 18.Cinar S, Ozdogan OC, Alahdab Y. Impact of education provided by nurses on quality of life, anxiety, and depression in patients receiving hepatitis C virus therapy. Gastroenterol Nurs. 2015;38(5):343–7. doi: 10.1097/SGA.0000000000000130. [DOI] [PubMed] [Google Scholar]
- 19.Fabregas BC, de Avila RE, Faria MN, Moura AS, Carmo RA, Teixeira AL. Health related quality of life among patients with chronic hepatitis C: a cross-sectional study of sociodemographic, psychopathological and psychiatric determinants. Braz J Infect Dis. 2013;17:633–9. doi: 10.1016/j.bjid.2013.03.008. [DOI] [PMC free article] [PubMed] [Google Scholar]
- 20.Teuber G, Schafer A, Rimpel J, Paul K, Keicher C, Scheurlen M, et al. Deterioration of health-related quality of life and fatigue in patients with chronic hepatitis C: Association with demographic factors, inflammatory activity, and degree of fibrosis. J Hepatol. 2008;49:923–9. doi: 10.1016/j.jhep.2008.07.025. [DOI] [PubMed] [Google Scholar]