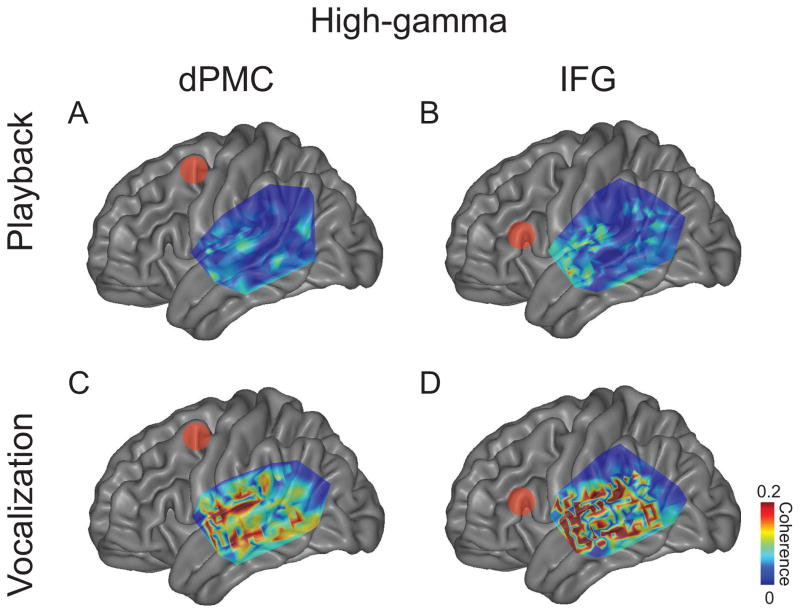
Figure 4.
Average theta coherence between frontal contacts and temporal grids. Coherence from all significant contacts is plotted for playback between temporal grids and (A) dPMC and (B) IFG and for vocalization (C–D). Red dots indicate dPMC in A and C, and IFG in B and D. All significant contacts across subjects were plotted on an average MNI brain. Coherence plotted only for significant contacts as determined by 95% confidence intervals on average MNI brains.

