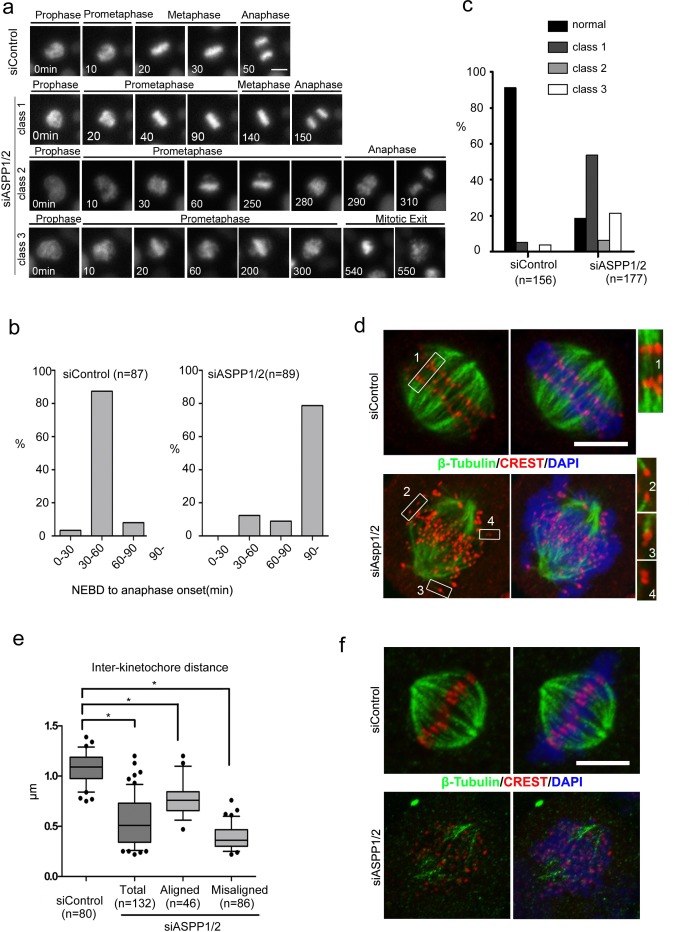
Figure 3. ASPP1/2 are required for proper kinetochore-microtubule attachments.
a. Live-cell imaging of HeLa cells stably expressing H2B-mCherry and transfected with control or ASPP1/2 siRNAs. T= 0 min was defined as the time point at which chromosome condensation became evident (prophase). Scale bar = 10μmm. b. Prolonged mitosis in ASPP1/2 co-depleted cells. The time from nuclear envelope breakdown (NEBD) to anaphase onset was measured in live-cell imaging and categorized. The percentages of cells in each category are shown in the graph. c. Quantitative analysis of different mitotic phenotypes in control or ASPP1/2 co-depleted cells. d. Defective kinetochore–microtubule attachments in ASPP1/2 co-depleted cells. HeLa cells were transfected with control or ASPP1/2 siRNAs for 48 hr, and with MG132 for the final 2 hr. Cells were stained with anti-β-tubulin (red), anti-CREST (green) antibodies, and DAPI (blue). Scale bar = 10 μm. Numbers point to magnified areas and indicate the mode of attachment of k-fibres to kinetochores (1, 2, bi-oriented; 3, mono-oriented kinetochores; 4, unattached). e. Quantitative analysis of inter-kinetochore distance in ASPP1/2 co-depleted cells. HeLa cells were treated as in (d). The distance between CREST on sister kinetochores was measured. Error bars, SEM. *p<0.01 from triplicates. f. Instability of kinetochore microtubules in ASPP1/2 co-depleted cells. HeLa cells were treated as in (d), and then incubated on ice for 10 min before fixation. Cells were stained with anti-β-tubulin (red), anti-CREST (green) antibodies, and DAPI (blue). Scale bar = 10 μm.

