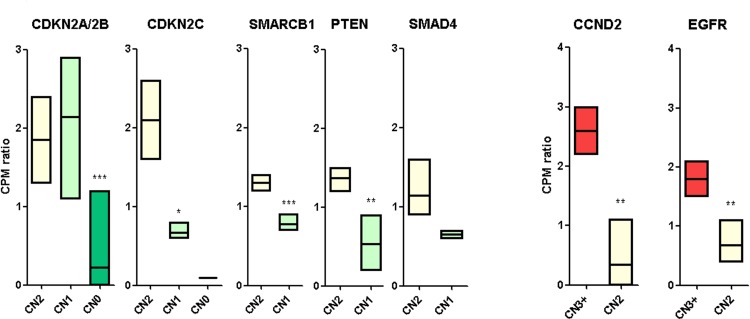
Figure 3. mRNA expression of candidate cancer-related genes.
mRNA expression level of cancer related genes are shown according to their CN status. Tumor suppressor genes are shown in the left panel, oncogenes in the right. Gene expression levels were evaluated using the cpm (normalized count of reads mapping each gene) normalized on the mean cpm of the cohort. The p value of differential expression was estimated with a t test: *p < 0,05; **p < 0,01; ***p < 0,001.

