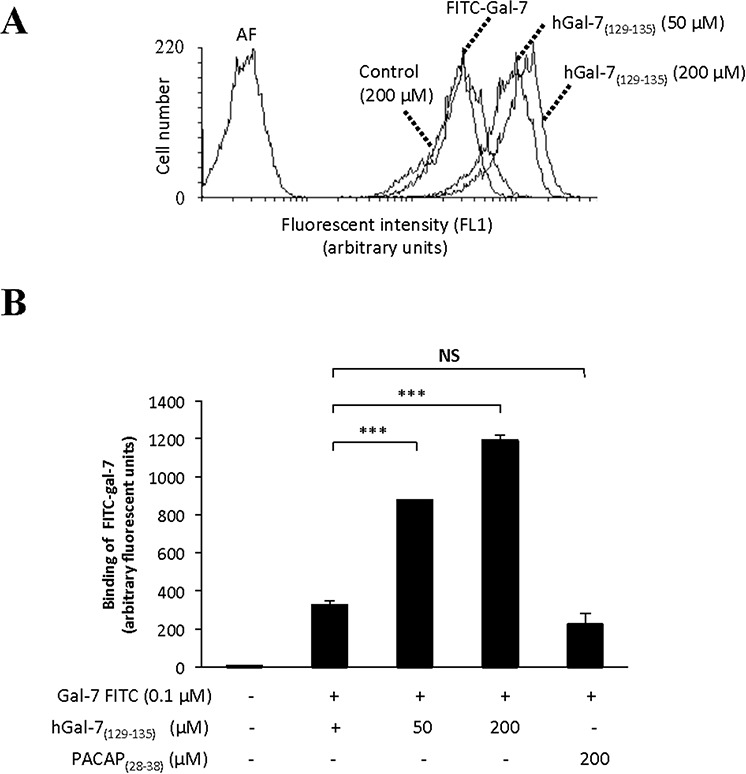
Figure 4. Increased binding of hGal-7 on Jurkat T cells due to increasing concentrations of hGal-7(129–135).

A. Histogram showing the mean fluorescence intensities (MFI) of cells following binding of fluorescein isothiocyanate (FITC)-labeled hGal-7 on the surface of Jurkat T cells. B. Binding of FITC-labeled hGal-7 (0.1 μM) on Jurkat T cells following pre-incubation with increasing concentrations of hGal-7(129–135). The PACAP(28–38) peptide was used as a control. Results are representative of three independent experiments. ***p ≤ 0.05. Error bars represent standard deviations.
