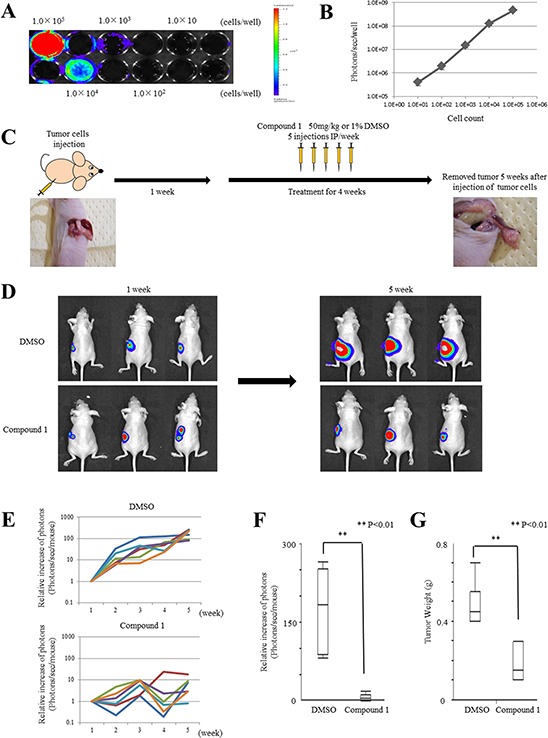
Figure 4. Compound 1 suppresses cancer cell growth in orthotopic mouse models.

A. In vitro imaging of luciferase-expressing MIAPaCa-2 cells. Cells were seeded at 1 × 101, 102, 103, 104, and 105 per well. A representative image is shown. B. Relationship between the cell number and luminescent signal intensity in MIAPaCa-2.Fluc cells. The experiment was performed three times. C. Therapy schedule for orthotopic mouse models. D. Representative examples of bioluminescence imaging after tumor cell injection at 1 week and 5 weeks (4 weeks after initiation of therapy). Three cases are shown for each group (1% DMSO only- and compound 1-treated groups). E. Mice were analyzed by optical bioluminescence imaging at 1, 2, 3, 4, and 5 weeks after tumor cell injection. Treatment with 1% DMSO only or compound 1 was started at 1 week after tumor cell injection. The graph shows the signal intensities recorded from individual mice for each week and group. The signal intensity at 1 week was set at 1 as a control for each mouse. Each group had six mice. F. Relative signal intensity at 5 weeks compared with 1 week after tumor cell injection in each group. Data are presented as the mean ± SEM (1% DMSO only-treated group; N = 6, compound 1-treated group; N = 6). **P < 0.01. G. Tumor weights at 5 weeks after tumor cell injection in each group. Data are presented as the mean ± SEM (1% DMSO only-treated group; N = 6, compound 1-treated group; N = 6). **P < 0.01.
