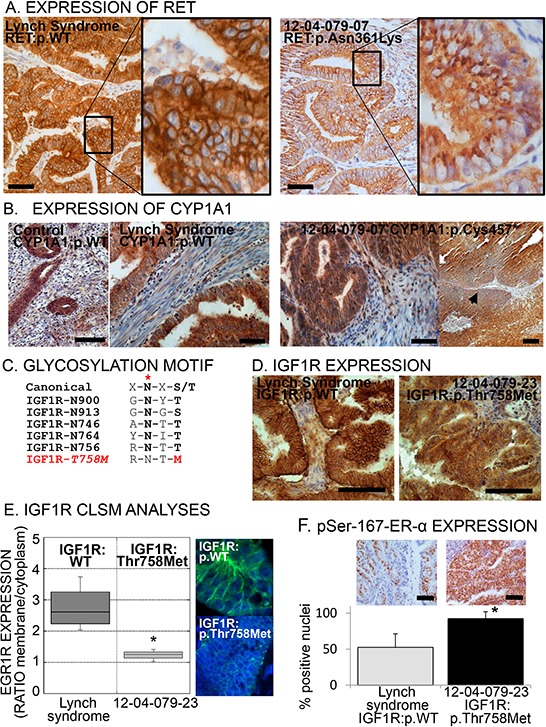
Figure 2. Aberrant expression or localization of RET, CYP1A1 and IGF1R in specimens carrying the respective risk-variants.

A. Immunohistochemical images of tumors bearing the common allele (WT) of RET or the risk-variant RET:p.(Asn631Lys). Note the punctuated cytoplasmic pattern in the risk-variant carrying tumor indicative of trapping of the receptor inside the cell. Scale bar = 100 μm. B. Immunohistochemical images of endometrial specimens bearing the common allele (WT) of CYP1A1 (control post-menopausal endometrium and Lynch syndrome endometrial cancer: left images). Right images, CYP1A1 expression on tumor specimen bearing the p.(Cys457*) risk-variant, showing one area with loss of expression (arrowhead). Scale bar = 100 μm. C. Canonical consensus and the five glycosylation sequences (glycosylation site indicated by red asterisk) in the IGF1R plus the consequent disruption of this consensus caused by risk-variant IGF1R:p.(Thr768Met). D. Immunohistochemical images of tumor specimens with common allele (WT) of IGF1R or with risk-variant p.(Thr758Met). Scale bar = 100 μm. E. Representative confocal laser scanning microscopic (CLSM) images and fluorescence quantification of the membrane/cytoplasmic fractions of IGF1R in tumor with common allele or with p.(Thr758Met) IGF1R. The box plot represents the distribution of four independent samples for common allele and four areas of sample 12–04-079–23 [carrying the p.(Thr758Met) risk-variant]. Asterisk indicates a p-value < 0.05, Wilcoxon-Mann-Whitney Rank Sum Test. F. Representative immunohistochemical images (top) and quantification of the percentage of nuclei positive to phospho-Ser-167-ER-α among endometrial cancer with wild type IGF1R (the grey bar indicates the mean ± SD of seven Lynch syndrome tumor specimens) and with IFG1R:p.(Thr758Met) (black bar, mean ± SD of four independent areas of the tumor from subject 12–04-079–23, bearing the variant). Asterisk indicates a p-value < 0.05 compared to common allele (t-test). Scale bar = 100 μm.
