Abstract
Management of neuropathic foot ulcers in patients with diabetes (DFUs) has changed little over the past decade, and there is currently no objective method to gauge probability of successful healing. We hypothesized that studies of stem/progenitor cells (SPCs) in the early weeks of standard wound management could predict who will heal within 16 weeks. Blood and debrided wound margins were collected for 8 weeks from 100 patients undergoing weekly evaluations and treatment. SPC number and intracellular content of hypoxia-inducible factors (HIFs) were evaluated by flow cytometry and immunohistochemistry. More SPCs entered the bloodstream in the first 2 weeks of care in patients who healed (n = 37) than in those who did not (n = 63). Logistic regression demonstrated that the number of blood-borne SPCs and the cellular content of HIFs at study entry and the first-week follow-up visit predicted healing. Strong correlations were found among week-to-week assessments of blood-borne SPC HIF factors. We conclude that assays of SPCs during the first weeks of care in patients with DFUs can provide insight into how well wounds will respond and may aid with decisions on the use of adjunctive measures.
Introduction
The goal of this investigation was to determine whether circulating and wound margin stem/progenitor cells (SPCs) and intracellular contents of hypoxia-inducible factors (HIFs) differed between patients with diabetes with neuropathic foot ulcers (DFUs) that healed and patients with DFUs that failed to heal promptly with aggressive care. SPCs capable of multipotent differentiation can be mobilized from bone marrow and adipose tissue, enter the bloodstream, and migrate to peripheral sites where they may facilitate recovery from injuries (1). It has been estimated that SPCs contribute up to 25% of endothelial cells in newly formed vessels, and by synthesizing growth factors they have a paracrine stimulatory impact on resident cell angiogenesis (2,3).
DFU management is a major clinical problem, and guidelines on the standard care of individuals with DFUs have changed little in the past decade (4,5). There are no objective measures for prospectively evaluating the probability of success with standard treatment or for selecting adjuncts that may improve healing and lower the risk of amputations in those who fail to heal promptly. The success rate of standard therapy in randomized controlled trials involving subjects with adequate arterial flow in their lower extremities is only ∼30% within 16 weeks of care (6).
SPC mobilization to the bloodstream occurs after wounding and physical exertion and in response to a variety of chemical agents (7–10). Clinical and animal studies provide evidence that SPCs are critical for neovascularization (3,7,11–15). Metabolic abnormalities associated with the diabetes state compromise SPC characteristics and thus may contribute to healing impairment (7). A number of studies have demonstrated that wound healing can be improved by increasing the number of circulating SPCs and/or enhancing wound site recruitment (2,7,16,17). There also is evidence that some adjuncts to standard treatment such as negative pressure dressings and hyperbaric oxygen will mobilize SPCs to blood and may also modify regulatory protein content that improves vasculogenic function (11,15,18,19). Pharmacological agents that might be used incidental to DFU treatment or as an adjunct may also influence SPCs (20–32).
Because many clinical variables may impact SPCs, attention to assessing their number or other characteristics may render many confounding variables manageable in evaluating healing potential. One recent report of 29 patients with DFUs found that circulating SPCs with the surface marker CD34 and receptor for the vascular endothelial growth factor-2 decreased over a 12-week time span among those who healed (33). Animal studies have indicated that not only cell number but also content of regulatory proteins such as HIFs influence vasculogenic potential (14,34). A small clinical study suggested that insight into SPC function may be gained by performing these analyses (15). However, there are technical challenges to measuring SPC proteins, particularly when assays are performed at different points in time, because of heterogeneity that occurs as SPCs differentiate (35–38). Moreover, use of “housekeeping” markers such as β-actin to normalize gene or protein content in these and some other cells has been called into question because measurements are so varied (35,37,39). HIF-1 and HIF-2 have “proneovascularization” functions, whereas HIF-3 negatively impacts SPC vasculogenic function (34,40,41). Given these differences and because all three are regulated at the protein versus gene level, we investigated whether the HIF ratio ([HIF-1 + HIF-2]/HIF-3) measured in SPCs may predict wound healing.
The goal of this investigation was to determine whether patients whose DFUs heal within 16 weeks of care versus those whose DFUs do not exhibit differences in circulating and DFU wound margin cells with surface markers that are currently considered consistent with SPCs, CD34+ and CD45-dim (i.e., fluorescence for CD45 was below the Fluorescence Minus One [FMO] threshold) (42).
Research Design and Methods
Study Approval
All subjects were patients presenting to the University of Pennsylvania Medical Center, Philadelphia, PA; wound care clinics managed by Healogics, Inc., located at Roxborough Memorial Hospital, Philadelphia, PA; or Greater Baltimore Medical Center, Baltimore, MD. The study was approved by institutional review boards at each participating center, and written informed consent was obtained from all subjects prior to inclusion in the study.
Patient Recruitment and Management
All patients had type 2 diabetes with a plantar surface foot wound due to neuropathy documented as loss of protective sensation by Semmes-Weinstein examinations and adequate arterial perfusion assessed as an ankle-brachial blood pressure ratio >0.65 or skin perfusion pressure >25 mmHg. In those patients with an ankle-brachial blood pressure ratio >1.2, additional vascular evaluations were performed as outlined previously (43). Exclusion criteria were as follows: inadequate arterial perfusion, institutionalization, previously received dialysis (peritoneal and/or hemodialysis) lasting >1 month, prior organ or bone marrow transplant, life expectancy <3 years as judged by the participant’s primary physician, immunosuppression or other immunotherapy for renal disease within the past 6 months, self-reported New York Heart Association (NYHA) Class III or IV heart failure at baseline, receipt of chemotherapy or alkylating agents for systemic cancer other than nonmelanoma skin cancer within 2 years prior to enrollment, receipt of treatment for systemic vasculitis that affects the kidneys, previous diagnosis of myeloma, known cirrhosis, HIV infection and/or AIDS based on participant self-report, or current participation in an interventional clinical trial, and being unable or unwilling to comply with standard clinical practice guidelines or to provide informed consent.
Study subjects were approached when they first presented to wound clinics. The protocol spanned 8 weeks, during which subjects returned to clinics for monitoring and wound care at approximately weekly intervals. At these visits, blood was collected for SPC analysis, and when DFUs were sharply debrided, wound margins were placed in vials filled with 2% buffered formalins for later analysis. All clinical management decisions were made by primary wound care providers; these decisions played no role in the study. Characteristics of the study population are shown in Table 1. Medications (listed in Supplementary Table 1) included the following: insulin (n = 85), statin drugs (n = 55), one or more oral antibiotics (n = 39), an ACE inhibitor (n = 42), metformin (n = 35), a β-blocker (n = 37), a sulfonylurea (n = 24), a calcium channel blocker (n = 19), clopidogrel (n = 11), a steroid (n = 3), a sympatholytic (n = 2), a glucagon receptor blocker (n = 4), and a peroxisome proliferator–activated receptor γ inhibitor (n = 1). Specific wound care interventions are shown in Supplementary Table 2.
Table 1.
Characteristics of study population over 16 weeks
| Healed | Nonhealing | |
|---|---|---|
| N | 37 | 63 |
| Female [n (%)] | 11 (29.7) | 16 (25.4) |
| Age (years) | 58.4 ± 1.9 | 57.2 ± 1.5 |
| HbA1c, % (mmol/L) | 5.7 ± 0.3 (39.2 ± 3.3) | 6.5 ± 0.3 (47.8 ± 2.9) |
| Wound duration (m) | 4.0 (1, 10.5) | 4.0 (1, 10.5) |
| Wound volume at entry (cm3) | 0.36 (0.04, 0.87) | 0.42 (0.18, 2.08)* |
| Wound volume at 8 wks (cm3) | 0.00 (0.0, 0.07) | 0.56 (0.09, 4.24)* |
| Circ. SPCs/μL at entry (n) | 0.98 (0.48, 1.54) | 0.79 (0.62, 1.36) |
| Circ. SPCs/μL at wk 1 | 1.09 (0.80, 1.89) | 0.80 (0.59, 1.13)* |
Age and HbA1c (%) are presented as mean ± SE. All other data are presented as median (25th, 75th percentiles) unless stated otherwise.
*Statistically significant difference between groups by Mann-Whitney rank sum test. Circ., circulating; wk, week.
After the 8-week study protocol, patients were monitored by maintaining contact with their wound care providers, as the primary outcome variable was whether a patient’s wound was healed by 16 weeks after study entry. Healing was defined as full epithelialization with the absence of drainage and in those managed with split thickness grafting as graft coverage/survival exceeding 95%. Two patients underwent a below-the-knee amputation and one a partial foot amputation prior to 16 weeks and were placed in the nonhealing group.
Blood for SPC analysis was collected in Cyto-Chex BCT test tubes (Streck, Inc., Omaha, NE) that contain a proprietary preservative. Samples were transported to the laboratory where analyses were performed within a time span of 1.5 weeks (preliminary work demonstrated that cell analysis is unchanged when studies are performed within 3 weeks on samples kept at room temperature or stored at 4°C). Formalin-fixed wound margins were typically shipped to the laboratory in formalin by overnight mailer and always transferred to phosphate-buffered saline within 48 h and stored at 4°C until immunohistochemistry analysis. As wounds improved, clinicians deferred debridements, so fewer samples were analyzed in later weeks. Similarly, when wounds healed within 8 weeks, ongoing clinic care ceased and blood samples were no longer collected.
Materials
Chemicals were purchased from Sigma-Aldrich (St. Louis, MO) unless otherwise noted. Antibodies for flow cytometry were purchased from the following sources: Brilliant Violet 421–conjugated mouse anti-human CD34 and Brilliant Violet 510–conjugated mouse anti-human CD45 (BD Pharmingen, San Jose, CA), R-phycoerythrin (RPE)-conjugated mouse anti-human HIF-1 (R&D Systems, Minneapolis, MN), fluorescein isothiocyanate–conjugated mouse anti-human HIF-2 and Cy7-conjugated mouse anti-human HIF-3 (Bioss, Inc., Woburn, MA), and allophycocyanin-conjugated mouse anti-human CD133 (Miltenyi Biotec, Auburn, CA). For immunohistochemistry, the following antibodies were used: fluorescein isothiocyanate–conjugated mouse anti-human CD34 (Invitrogen, Grand Island, NY), RPE-conjugated mouse anti-human CD45 (Santa Cruz Biotechnology, Dallas, TX), allophycocyanin-conjugated mouse anti-human CD133 (Miltenyi Biotec), RPE-conjugated goat anti-human HIF-1 (R&D Systems), and A647-conjugated rabbit anti-human HIF-2 and RPE-conjugated rabbit anti-human HIF-3 (Bioss, Inc.). The antibodies for Western blots were as follows: rabbit anti-human HIF-1, mouse anti-human HIF-2, and mouse anti-human HIF-3 (Abcam, Cambridge, MA). mRNA probes for vascular endothelial growth factor type 1, locus NM_003376 (VEGF), and stromal derived factor-1α, locus NM_000609 (SDF-1), were purchased from Affymetrix eBioscience (Santa Clara, CA).
Flow Cytometry and Cell Analysis
Most analyses were performed using an 8-color, triple laser flow cytometer MACSQuant (Miltenyi Biotec) using the manufacturer’s acquisition software; early studies were done with a 10-color FACSCanto (Becton Dickinson, San Jose, CA). Flow cytometry was performed using 2 mL whole blood lysed with ammonium chloride, washed twice, permeabilized using saponin, and incubated with antibodies following published techniques. Nucleated cells were segregated from debris using DRAQ5 DNA staining and gated based on CD34 and CD45 surface markers. The fraction of SPCs that expressed surface CD133 was also determined. All cell surface and intracellular marker analyses were performed using the FMO Control Test. The merit of this approach has been well described by others, and further discussion can be found in the Supplementary Data and in prior publications (14,15,34,44). The total counted events/sample ranged from 2.2 × 10⁶ to 3.2 × 10⁷ so that from 252 to 2.8 × 10⁴ SPCs/sample were counted. The HIF ratio was calculated as median fluorescence for HIF-1 plus HIF-2 divided by median fluorescence of HIF-3. On occasion, fluorescence for one intracellular protein was not detectable. When a median fluorescence value for HIF-3 was 0, the HIF ratio was calculated by substituting the 0 with a value that was 10% below the lowest value recorded for the flow cytometer. Using a median fluorescence value of 0 for HIF-3, as reported by the cytometer, would make the HIF ratio infinite. Using a value that is 10% below the lowest value recorded for the flow cytometer reduces the calculated HIF ratio, but the value is a real number. The modification also renders our analysis more conservative. As the same method was used for all data, our approach allows all values to be comparable. Expression of VEGF and SDF-1 mRNA was analyzed in CD34+/CD45-dim surface-stained cells by flow cytometry using the FlowRNA II Assay kit (Affymetrix eBioscience) according to the manufacturer’s protocols (45). Representative histograms for flow cytometry analyses are shown in results, and indicate overlaps between isotype controls and each marker of interest; thus, components of some signals are not entirely specific.
Western Blot Analysis
CD34+/CD45-dim cells were isolated from blood using magnetic beads following published techniques (11). Isolated cells were suspended in PBS with 200 μmol/L deferoxamine to impede HIF degradation, and then lysed, and a total of 3–6 µg lysate protein was loaded and separated on 4–12% polyacrylamide by electrophoresis followed by overnight transfer to a nitrocellulose membrane. The sheet was blocked with Odyssey blocking solution (no. 927-40000; LI-COR Biosciences, Inc., Lincoln, NE) diluted 1:1 with PBS at 4°C overnight and then incubated with primary anti-HIF (1:1,000), HIF-2 (1:250), and HIF-3 (1:500) antibodies suspended in a 1:1 solution of blocking buffer plus 0.1% Tween20 in PBS. Membranes were washed four times in 0.1% Tween-PBS for 5 min under agitation and then incubated with appropriate secondary antibodies, followed by treatment with enhanced chemiluminescence reagents (Amersham, Arlington Heights, IL). Densitometric analysis (mean gray intensity) of gel films was performed with an Odyssey CLx Imager (LI-COR Biosciences, Lincoln, NE). Positive identity of protein band locations was verified using cell lysates purchased from Abcam.
Tissue Staining
Within 48 h of formalin fixation, tissue was transferred to PBS and rinsed for three 30-min intervals. Samples were cryo-protected with three successive overnight incubations in 10%, 20%, and then 30% sucrose before being embedded in optimal cutting temperature cryo-medium, frozen at −20°C, and cut into 20-µm-thick sections. Images were analyzed on a Nikon inverted stage confocal microscope by first quantifying the background fluorescence. A minimum of three sections from each tissue sample were visualized, with a total of 30–40 images taken per section. Each image reflected a wound tissue area of 225 µm2. With each image, background fluorescence was first assessed so that positive staining could be defined as fluorescence of at least 150% over background. Then, with use of a standardized matrix for cell counting on each image, data were recorded as the mean number of CD34+ cells/image, the fraction of cells that also express CD45 (thus a calculation can be made for CD34+/CD45-dim cell recruitment), and the fraction of CD34+ cells also expressing CD133. The fraction of CD34+ cells that contained HIF-1, HIF-2, and HIF-3 was also assessed.
Statistics
Patient age, sex, and hemoglobin A1c were summarized as mean ± SE, and wound characteristics, SPC enumeration, and HIF ratio as median (25th, 75th percentiles). Correlations of measurements with healing by 16 weeks were evaluated by the Spearman rank order test. Log transformations of SPCs, HIF ratio, wound size, and patient age were used for logistic regression analyses. SigmaStat software (Systat, Point Richmond, CA) was used for data analysis.
Results
Patient Characteristics
Circulating and wound-margin SPCs from 100 patients with neuropathic DFUs were studied. Table 1 shows general characteristics between patients whose wounds healed within 16 weeks from study entry (n = 37) versus those whose wounds failed to heal (n = 63). There were no statistically significant differences between groups for age, sex distribution, hemoglobin A1c, or the duration of the wound prior to study entry. Wounds among those who did not heal had significantly larger volume at time of entry and after 8 weeks of wound care compared with those who healed. There were eight patients in the nonhealing group and five in the healed group (not significantly different [NS]) with wounds that extended to tendon or bone at time of entry. No statistically significant differences between groups were present for medications or wound-management interventions (Supplementary Tables 1 and 2).
Circulating SPC Analysis
SPC values at time of study entry and the first-week follow-up visit are shown in Table 1. Analyses were also performed adding the CD133 surface marker for early-generation progenitor cells (33). Because this analysis followed the same pattern as SPCs and added little information, results are not shown. At study entry, the number of circulating SPCs was not statistically significantly different between those who healed and those who did not heal, but SPCs/µL blood increased significantly by the time of the first follow-up visit for patients who healed (Table 1). Thereafter, values at follow-up visits that occurred at approximately weekly intervals were not significantly different. Logistic regression analysis of log-transformed data found that the circulating SPC number at the first follow-up clinic visit was associated with successful wound healing with an odds ratio (OR) of 3.9 (95% CI 1.7, 8.9) (Table 2). No significant associations were found between use of medications (see research design and methods) and healing, and there was not an association between wound duration at study entry and healing. The wound size at study entry had a marginal predictive value, with an OR 0.79 (95% CI 0.63, 0.98, P = 0.03). When adjusted by including factors as described in Table 2, the values changed nominally: OR 0.73 (95% CI 0.57, 0.98, P = 0.033). Including wound size in multiple logistic regression improved the predictive value for the blood-borne SPCs number at study entry and at the first follow-up visit (Table 2).
Table 2.
Association of SPC characteristics with wound healing
| SPCs/μL | HIF ratio | |||
|---|---|---|---|---|
| Start | Week 1 | Start | Week 1 | |
| OR | 0.99 | 3.9 | 3.5 | 2.12 |
| CI | 0.54–1.82 | 1.7–8.9 | 1.5–8.2 | 1.2–4.3 |
| P | NS | 0.001 | 0.003 | 0.021 |
| Adj. OR | 2.66 | 4.7 | 4.6 | 2.85 |
| CI | 1.11–6.34 | 1.8–12.0 | 1.8–12.1 | 1.3–6.3 |
| P | 0.028 | 0.001 | 0.002 | 0.010 |
Logistic regression was performed on log-transformed data to assess the unadjusted OR for healing using values of SPCs/µL blood and HIF ratio at study entry and the first week follow-up visit. Adjusted (Adj.) ORs were calculated by including values for SPC number/µL blood, HIF ratio, patient age, and wound size at study entry.
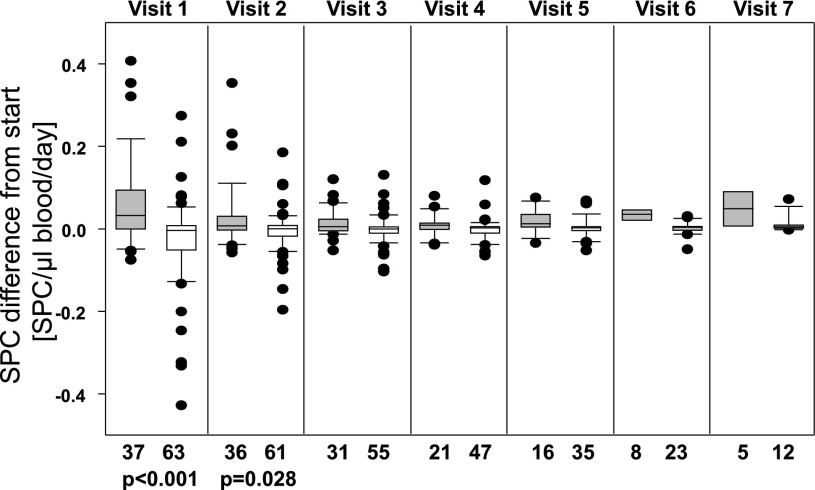
Because follow-up visits were not always performed at exactly 7-day increments and at times patients missed appointments, we felt a more accurate way to evaluate SPC changes over time was to compare follow-up values with those recorded at study entry and express the results as the difference in number of SPCs/µL blood/day (Fig. 1). Subjects who failed to heal within 16 weeks exhibited nominal change in circulating SPCs with early follow-up clinic visits (median difference at visit 1 was −0.0125 SPCs/µL blood/day), whereas numbers increased in those who healed (median difference at visit 1 was 0.0495 SPCs/µL blood/day). Values for those who healed were statistically significantly different from values for subjects who did not heal during the first 2 weeks of care. The correlation coefficient with healing for the difference in SPCs at the first follow-up visit was 0.58 (P < 0.0001) and at the second visit was 0.29 (P = 0.025).
Figure 1.
Change in circulating SPC count relative to the count at study entry. Visits were scheduled weekly, but subjects missed appointments on occasion or presented for care on alternative days, prompting expression of data as SPC number/µL blood/day since entering study. Gray bars indicate data from patients whose wounds healed within 16 weeks vs. those whose wounds did not (open bars). Data are median, with boxes showing 25th and 75th percentiles, error bars showing 10th and 90th percentiles, and outliers shown as single dots. n for each measurement is shown below the figure. Rank sum P values between healed and nonhealing groups are shown for visits 1 and 2; values for visits 3–7 were not significantly different.
The assessment of impact of medications on SPC mobilization was performed by logistic regression using intake of a medication as the binary dependent variable. Metformin was the only medication associated with a statistically significant impact on the SPC value. At study entry, the OR was 2.58 (95% CI 1.19, 5.59, P = 0.017); at the first follow-up visit, 2.75 (95% CI 1.19, 6.3, P = 0.017); and at the second visit, 2.56 (95% CI 1.19, 5.39, P = 0.014). No significant association was noted for measurements from later visits. Analyses combining any other medication with metformin did not markedly change this result, and there were not significant findings with multiple medication analyses. Including metformin in the logistic regression model did not alter the effect estimate of SPCs on wound healing at study entry or the week 1 visit.
HIF Ratio
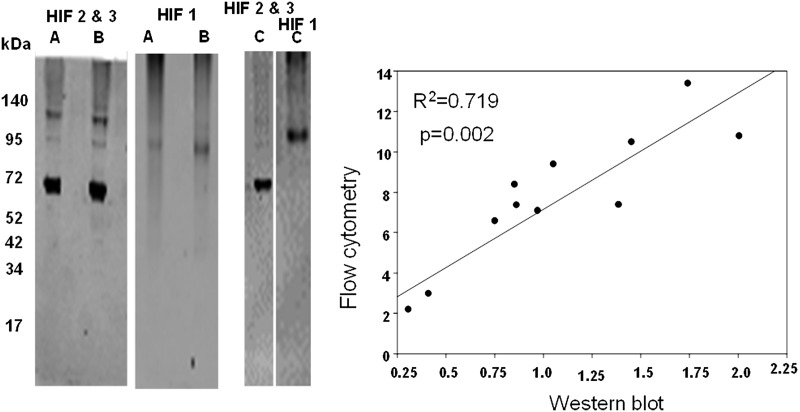
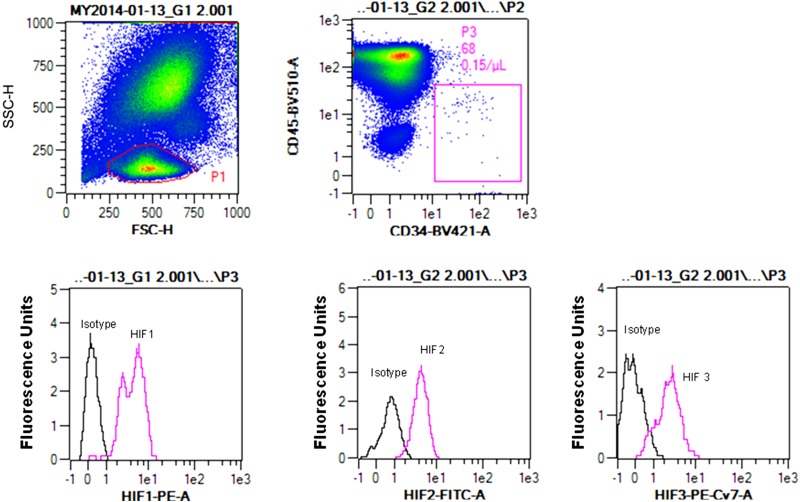
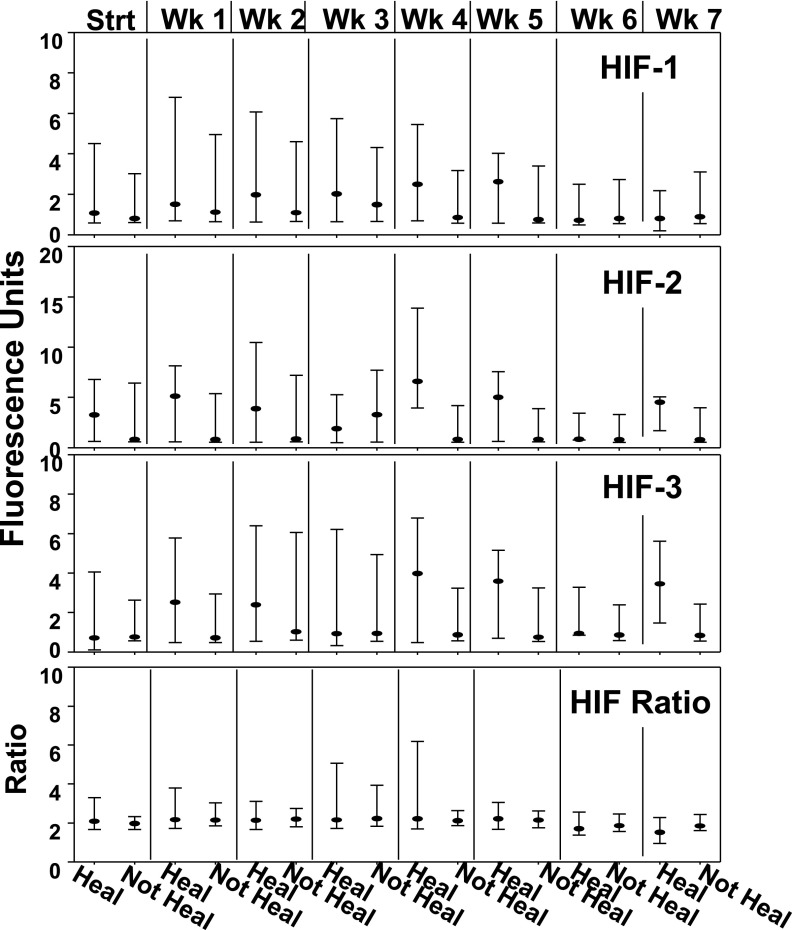
As outlined above, we were interested in evaluating the cellular content of HIF proteins based on the ratio ([HIF-1 + HIF-2]/HIF-3). There is little precedence for evaluating protein contents based on flow cytometry, and whether findings with SPCs may be similar to more traditional Western blotting has not been investigated. Therefore, flow cytometry data were compared with results obtained using SPCs isolated using the magnetic bead technique from the blood of 11 patients that was lysed and its proteins analyzed by Western blotting. Figure 2 shows three representative blots; there was a statistically significant association between HIF ratios quantified using flow cytometry median fluorescence values and Western blot band densities. As noted above, problems with using “housekeeping” proteins to normalize Western blots have been discussed (35,37,39). We assessed β-actin variability within SPCs by placing lysates on the same blot to probe them in an identical fashion. The ratio of actin band density to number of cells used in each preparation was normalized to the densest actin band, and values ranged from 8.7 to 100%, with a median value of 52.4%. Thus, the use of a housekeeping protein such as β-actin for standardization of flow cytometry data was abandoned in favor of using the HIF ratio. A representative flow cytometry analysis for SPC HIF proteins is shown in Fig. 3. Median values for HIF-1, -2, and -3 as well as the HIF ratios for the 100-patient population are shown in Fig. 4.
Figure 2.
HIF ratio comparison between Western blotting and flow cytometry techniques. Left: Representative SPC Western blots (entire blots are shown) from three cell lysates (A, B, and C). HIF-1 was monitored in the scanner's 700-nm channel, and HIF-2 and HIF-3 were monitored in the 800-nm channel. Anticipated molecular weight for HIF-1 was ∼93 kDa; according to the antibody manufacturer, HIF-2 typically exhibits two isoforms at 120 and 96 kDa; and HIF-3 molecular weight was 69 kDa. Right: Linear regression comparison between HIF ratios calculated from flow cytometry versus Western blot data. These comparisons were made using cells from 11 study subjects.
Figure 3.
Flow cytometry blood SPC analysis for HIF proteins. After forward (FSC-H) and side scatter (SSC-H) interrogation, the P1 zone was selected and cells positive for CD34 and negative for CD45 (defined based on the FMO Control Test [box P3] were analyzed for content of HIF proteins). Histograms show fluorescence for cells incubated with antibodies to HIF-1, HIF-2, and HIF-3, as well as isotype control antibodies. FITC, fluorescein isothiocyanate; PE, phycoerythrin.
Figure 4.
Fluorescence values for HIF proteins in blood SPCs. Data show median fluorescence and 25th and 75th percentiles for CD34+/CD45-dim cell expression of HIF-1, HIF-2, and HIF-3 and the HIF ratio calculated as the median fluorescence of HIF-1 plus HIF-2 divided by HIF-3. The sample number for each value is as shown in Fig. 1; there are no statistically significant differences between groups. Strt, start; Wk, week.
Logistic regression analysis of log-transformed data found that the HIF ratios at study entry and week 1 were associated with successful wound healing (Table 2). The estimated OR persisted in the fully adjusted analysis that included SPC number, patient age, and wound size at study entry. Interestingly, HIF ratios appeared to be relatively stable because values were highly correlated across the 8 weeks of study. Supplementary Table 3 shows correlation coefficients for the approximately weekly cell HIF ratios.
mRNA for VEGF and SDF-1
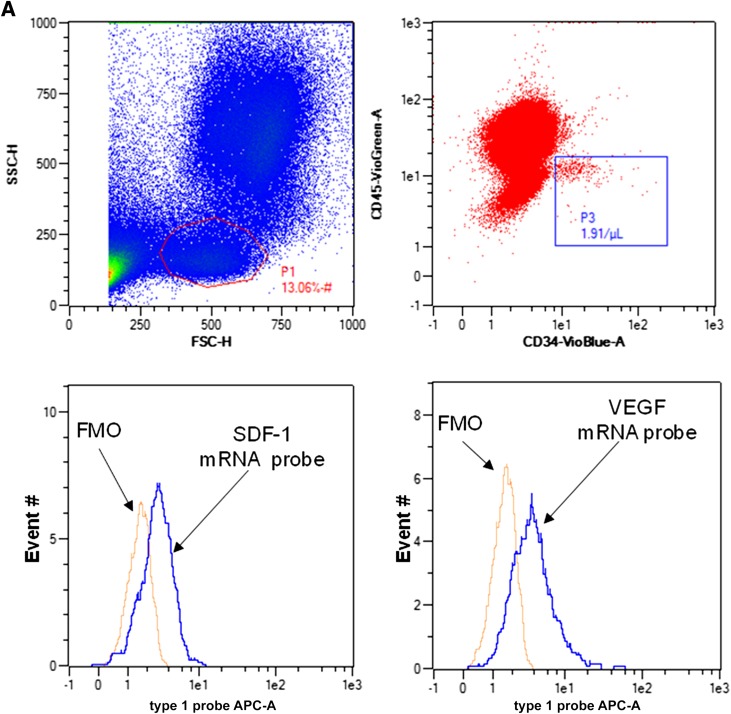
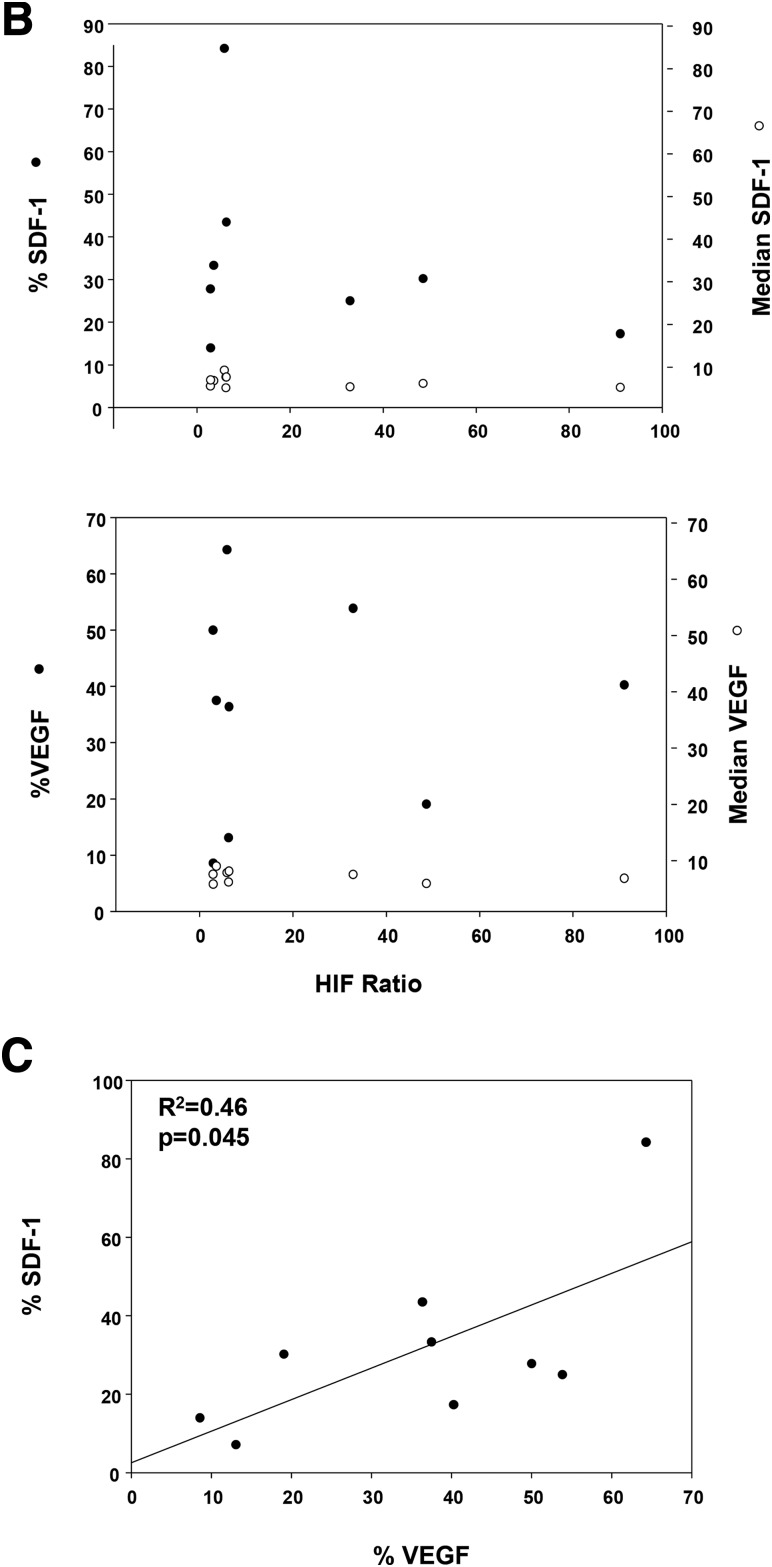
VEGF and SDF-1 are among the HIF-dependent gene targets, and the secreted proteins are critically involved with SPC-dependent vasculogenesis. Therefore, we investigated the relationship between VEGF and SDF-1 mRNA species and HIF ratios in individual CD34+/CD45-dim cells from nine subjects. Figure 5A shows a typical gating scenario and fluorescence signals for each mRNA species. Data (Fig. 5B) were quantified as the fraction of cells showing positive staining, % VEGF and % SDF-1, based on FMO analysis (see research design and methods) for each mRNA as well as median fluorescence. No significant associations between mRNA levels and HIF ratios were identified, but a weak association existed between % cells in the patients’ blood exhibiting each of mRNA species (Fig. 5C).
Figure 5.
Measurements of VEGF and SDF-1 mRNA in circulating SPCs. A: Gating approach and typical quantification of mRNA. Top left: Laser light forward (FSC-H) and side scatter (SSC-H) with the lymphocyte population circled. Top right: Lymphocyte population and the number of cells identified as CD34+/CD45-dim based on FMO analysis (in the square, 1.91 cells/µL were detected). Bottom two histograms: Fluorescence values (abscissa) and number of events (ordinate) for SDF (left) and VEGF (right) mRNA along with the FMO control. APC, allophycocyanin. B: Relationships between mRNA for SDF-1 and VEGF with HIF ratio. Data show results for nine cell samples with HIF ratio on the abscissa, percent CD34+/CD45-dim cells exhibiting mRNA-specific fluorescence above the FMO baseline as closed circles on the left ordinate axis, and median mRNA fluorescence as open circles on the right ordinate axis. There are no statistically significant associations between mRNA types and HIF ratio. C: Relationship between percent of cells positive (above the FMO baseline) for SDF-1 mRNA and VEGF mRNA.
Stability of mRNA is obviously a concern with any fixed/stored samples sent from clinical sites. No relation was identified, however, between the duration of time from sample acquisition and mRNA levels. For example, a sample analyzed 1 h after acquisition exhibited a median fluorescence for VEGF of 7.6 and positive values in just 2.8% of CD34+/CD45-dim cells, whereas a sample analyzed >7 months after acquisition exhibited a median fluorescence for VEGF of 6.9 and positive values in 64.3% of CD34+/CD45-dim cells.
Wound Margin Immunohistochemical Analysis
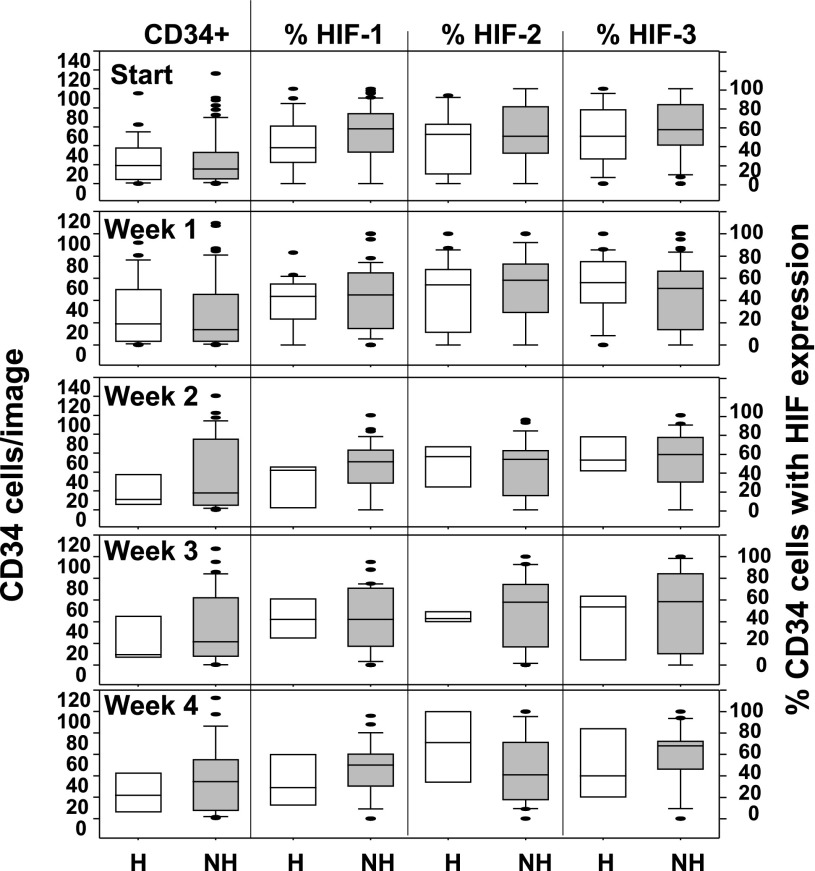
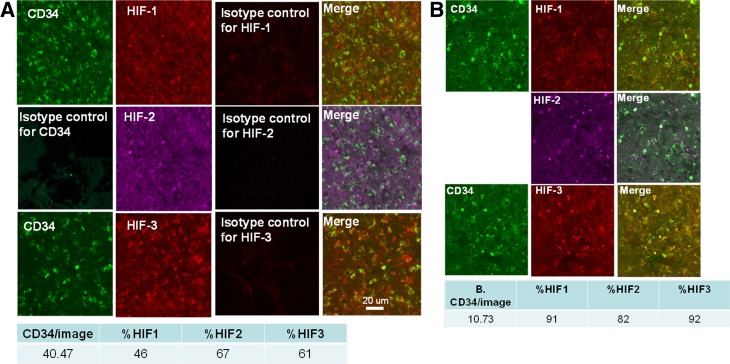
The portions of wound margins obtained from sharp debridements containing full thickness epidermis were studied. Samples were analyzed for the number of CD34+ cells/image and the fractions of cells that also expressed CD45, CD133, HIF-1, HIF-2, and HIF-3. At study entry, the median number (25th, 75th percentiles) of CD34+/45-dim cells per image for patients who healed was 10.6 (2.4, 18.6), whereas for those who did not heal it was 6.1 (2.2, 16.2) (NS). Trends appeared for differences in fraction expressing specific HIF factors (e.g., median number of cells expressing HIF-1 at week 1 among those who healed 5.8 [0.3, 18.5] vs. 3.6 [0.8, 27.9] for the nonhealing group), but variability was such that values were not statistically significant. The number of CD34+ cells/image and the fraction of cells expressing HIF-1, -2, and -3 over the first 4 weeks of care are shown in Fig. 6. Representative images from two subjects as well as the quantitative analysis of the images are shown in Fig. 7. There were no statistically significant differences between groups across 8 weeks of sampling. However, within the collection of samples obtained from each patient, the expression of HIF factors in wound margin cells was correlated. That is, when the proportion of cells at a wound margin that expressed HIF-1 was compared, the correlation coefficients with fractions expressing HIF-2 and HIF-3 were typically between 0.5 and 0.7 (P < 0.001, data not shown).
Figure 6.
Immunohistochemistry results. Data from weekly analyses are shown for number of CD34 cells/image (left panel), and the fraction of cells expressing HIF-1, -2, and -3 (right three panels) is defined as cells exhibiting a fluorescence value of at least 150% over background. Data are displayed as described in Fig. 1, and n for each sampling is the same as in Fig. 1. Analyses involved imaging a minimum of three 225-µm2 tissue sections from each patient, with a total of 30–40 images taken per section. There were no statistically significant differences between patients who healed within 16 weeks (noted as H at the bottom) and those who did not heal (NH).
Figure 7.
Representative confocal microscope images of wound margin tissue from two patients at week 1 follow-up visit from a patient who healed (A) and from a patient who did not heal within 16 weeks (B). One set of tissue sections was stained with antibodies to CD34 as well as HIF-1 and HIF-2 and another with CD34 and HIF-3; merge images depict overlap between respective protein staining. The table beneath the images shows the quantitative analysis for the sections as median CD34+ cells/image and percent of cells exhibiting fluorescence for HIF-1, HIF-2, and HIF-3. The orientation for all samples was epidermis toward the top of the image.
Discussion
We believe this is the largest study to date examining associations between SPCs and clinical outcomes for DFU healing. A significant increase in the number of circulating SPCs occurs during the first weeks of wound care in patients whose wounds heal by 16 weeks. The circulating SPC numbers in the first week of care can be used to predict wound healing. While some differences appear when SPCs are quantified using three surface markers (including CD133), trends pertinent to 16-week outcome are not impacted by this technical modification.
SPCs are mobilized in response to skin wounding and other forms of trauma (2,8,46). Sharp wound debridement was performed on all patients at their first clinic visit, and we hypothesize this was the stimulus that triggered increases in circulating SPCs among healing patients. The number of circulating SPCs did not increase further after the first follow-up visit, possibly because fewer procedures or less aggressive debridements were performed as these wounds improved.
No increase in SPC number occurred among patients who do not heal; in many cases, a decrease was observed over weeks of care when changes were related to blood-borne SPC numbers at time of study entry. The reasons why this occurred are not known. Glucose control was similar between the healing and nonhealing groups, and there were no notable differences in medications used. The proportions of subjects using metformin were not statistically significantly different between groups, and its association with higher SPCs values is consistent with other reports (26). Wounds were larger in the nonhealing group, and size is a recognized risk factor for failure to heal (47). The predictive value of circulating SPCs improved when adjusted for wound size. Whereas there is no precedence for thinking larger wounds would diminish SPC mobilization, failure to mobilize SPCs clearly could contribute to larger wounds given the recognized role of SPCs with wound healing. SPCs from patients with diabetes exhibit impaired angiogenic function, and patients have fewer circulating SPCs due to hyperglycemia, oxidative stress, inflammatory events, and nitric oxide synthase phosphorylation in the bone marrow niche (13,48,49).
HIF proteins impact SPC function, and cell content can be quantified readily in animal studies (14,34). We reasoned that a relationship among the HIF factors in SPCs may be linked with wound healing success. Because their activities are regulated mainly at the protein (versus gene) level owing to hydroxylation/ubiquitination/proteolysis, we thought intracellular detection may prove meaningful. HIF-1 and HIF-2 are “proneovascularization” factors (41). In contrast, based on protein-depletion studies using small inhibitory RNA, HIF-3 adversely impacts vasculogenic SPC function (34). Isoform 4 has a dominant-negative function of inactivating HIF-1α–mediated transcription, and one splice variant forms an abortive transcriptional complex with HIF-2α that prevents its gene interactions (40).
Our goal was to evaluate whether SPC HIF ratios correlated with outcome. Ratios appear to have value for predicting healing within 16 weeks, but the functional relevance of the HIF ratio is unknown. Prior work has suggested that SPCs with higher content of HIF-1 and -2 are those primed for prompt mobilization from the bone marrow; these cells may be preferentially sequestered in the peripheral vasculature; and lower HIF levels in circulating SPCs might occur due to protein degradation (15,19,34). The similarities in HIF ratios across 8 weeks (Supplementary Table 3) suggest that chronological age since mobilization and perhaps stresses sustained by the cells were similar. If true, then HIF ratio could reflect intrinsic differences in the SPC populations between the healing and nonhealing groups.
A weakness of this investigation is that functional testing of SPC angiogenic potential was not performed. Hence, the results do not provide information on whether SPC function varies among study participants. We have termed our CD34+/CD45-dim cells as SPCs, but we recognize that circulating endothelial cells are not excluded from the analysis. Measurements of intracellular HIF factors improve confidence that the cells of interest are indeed SPCs, however, because mature circulating endothelial cells would not be expected to exhibit measurable levels of HIF proteins (50,51). There are many biochemical influences on HIF protein stability, HIF target gene transcription, and stabilization of the mRNA that is produced. Any and all of these issues could explain why associations were not found between HIF ratios and mRNA levels for VEGF and SDF-1. Similarly, the duration of time that SPCs were in the circulation could also perturb a relationship. The half-lives for VEGF and SDF-1 mRNA are typically on the order of 1 h, and a variety of posttranscriptional controls have been identified (52,53).
Surgical debridement of DFUs is intended to remove healing-impaired or senescent cells and thus render the wound more responsive to therapeutic interventions (54). As such, there are risks to using this tissue to glean insight into wound healing physiology. Our attempt was prompted by an earlier pilot study (15). Immunohistochemical analysis of wound margins can only provide semiquantitative results, and more detailed analyses with these clinically derived fixed tissue samples were not feasible. Our results did not demonstrate statistically significant differences between those who healed and those who did not. Whereas some median values were markedly different, variability among the samples was high. We think it notable, however, that some sample-to-sample values, such as those for HIF expression, were highly consistent. Hence, further effort but using a larger sample size may provide information on SPCs at the wound site.
We conclude that assaying SPCs during the early weeks when patients are receiving wound care provides insight into how well wounds will respond. Whereas the absolute number of circulating SPCs in patients was small, the ∼35% increase in cell count in the first week of care among those who healed (∼0.05 SPCs/µL blood/day × 7 days) (Fig. 1) versus those who did not may provide useful clinical information that could influence wound care decisions. The relationships between SPC number, as well as HIF ratio, and healing underscore the existence of quantifiable differences within the patient population. Further work is needed to determine whether analysis of SPC number and/or HIF ratio can aid clinical decision making. The annual incidence of foot ulcers among people with diabetes has been variously estimated at between 1 and 4.1%, and the annual incidence of amputation is 0.21–1.37% (5). Allocation of resources to achieve healing and knowing when to incorporate more aggressive or adjunctive treatments early during the course of wound care require objective measures. Blood-borne SPCs analysis may satisfy this need and also have utility in clinical efficacy trials where matching patients between various treatment arms obviously will impact results.
Supplementary Material
Article Information
Acknowledgments. The authors acknowledge the technical assistance of Marina Bogush and Tatyana N. Milovanova from the Institute for Environmental Medicine, University of Pennsylvania.
Funding. This project was supported by the National Institute of Diabetes and Digestive and Kidney Diseases (NIDDK) (grant R01-DK-094260 to S.R.T. and D.J.M.), by the Office of Naval Research Global (N00014-13-10614 to S.R.T.), and by the Office of Naval Research (N00014-13-10613 to S.R.T.).
Duality of Interest. No potential conflicts of interest relevant to this article were reported.
Author Contributions. S.R.T. conceived ideas, oversaw the research program, performed laboratory studies, analyzed data, and wrote the manuscript. M.H. aided with study subject recruitment, collected blood and tissue samples, collated data, reviewed the manuscript, and provided advice. M.A.T., Z.M., D.S.M., S.S., N.B.J., C.M.D., and D.W. aided with study subject recruitment, collected blood and tissue samples, reviewed the manuscript ,and provided advice. O.H. analyzed data, reviewed the manuscript, and provided advice. M.Y., K.Y., V.M.B., and S.K. performed laboratory studies, reviewed the manuscript, and provided advice. D.J.M. conceived ideas, oversaw portions of the work, analyzed data, reviewed the manuscript, and provided advice. S.R.T. is the guarantor of this work and, as such, had full access to all the data in the study and takes responsibility for the integrity of the data and the accuracy of the data analysis.
Footnotes
This article contains Supplementary Data online at http://diabetes.diabetesjournals.org/lookup/suppl/doi:10.2337/db15-0517/-/DC1.
References
- 1.Asahara T, Masuda H, Takahashi T, et al. Bone marrow origin of endothelial progenitor cells responsible for postnatal vasculogenesis in physiological and pathological neovascularization. Circ Res 1999;85:221–228 [DOI] [PubMed] [Google Scholar]
- 2.Tepper OM, Carr J, Allen RJ Jr, et al. Decreased circulating progenitor cell number and failed mechanisms of stromal cell-derived factor-1alpha mediated bone marrow mobilization impair diabetic tissue repair. Diabetes 2010;59:1974–1983 [DOI] [PMC free article] [PubMed] [Google Scholar]
- 3.Barcelos LS, Duplaa C, Kränkel N, et al. Human CD133+ progenitor cells promote the healing of diabetic ischemic ulcers by paracrine stimulation of angiogenesis and activation of Wnt signaling. Circ Res 2009;104:1095–1102 [DOI] [PMC free article] [PubMed] [Google Scholar]
- 4.Wild S, Roglic G, Green A, Sicree R, King H. Global prevalence of diabetes: estimates for the year 2000 and projections for 2030. Diabetes Care 2004;27:1047–1053 [DOI] [PubMed] [Google Scholar]
- 5.Bartus CL, Margolis DJ. Reducing the incidence of foot ulceration and amputation in diabetes. Curr Diab Rep 2004;4:413–418 [DOI] [PubMed] [Google Scholar]
- 6.Margolis DJ, Gelfand JM, Hoffstad O, Berlin JA. Surrogate end points for the treatment of diabetic neuropathic foot ulcers. Diabetes Care 2003;26:1696–1700 [DOI] [PubMed] [Google Scholar]
- 7.Albiero M, Avogaro A, Fadini GP. Restoring stem cell mobilization to promote vascular repair in diabetes. Vascul Pharmacol 2013;58:253–258 [DOI] [PubMed] [Google Scholar]
- 8.Fukaya E, Margolis DJ, Miller CJ, Milovanova TN, Papadopoulos M, Thom SR. Endothelial progenitor cell mobilization following acute wound injury. Wound Repair Regen 2013;21:907–908 [DOI] [PMC free article] [PubMed] [Google Scholar]
- 9.Asahara T, Takahashi T, Masuda H, et al. VEGF contributes to postnatal neovascularization by mobilizing bone marrow-derived endothelial progenitor cells. EMBO J 1999;18:3964–3972 [DOI] [PMC free article] [PubMed] [Google Scholar]
- 10.Rehman J, Li J, Parvathaneni L, et al. Exercise acutely increases circulating endothelial progenitor cells and monocyte-/macrophage-derived angiogenic cells. J Am Coll Cardiol 2004;43:2314–2318 [DOI] [PubMed] [Google Scholar]
- 11.Thom SR, Bhopale VM, Velazquez OC, Goldstein LJ, Thom LH, Buerk DG. Stem cell mobilization by hyperbaric oxygen. Am J Physiol Heart Circ Physiol 2006;290:H1378–H1386 [DOI] [PubMed] [Google Scholar]
- 12.Goldstein LJ, Gallagher KA, Bauer SM, et al. Endothelial progenitor cell release into circulation is triggered by hyperoxia-induced increases in bone marrow nitric oxide. Stem Cells 2006;24:2309–2318 [DOI] [PubMed] [Google Scholar]
- 13.Gallagher KA, Liu ZJ, Xiao M, et al. Diabetic impairments in NO-mediated endothelial progenitor cell mobilization and homing are reversed by hyperoxia and SDF-1 alpha. J Clin Invest 2007;117:1249–1259 [DOI] [PMC free article] [PubMed] [Google Scholar]
- 14.Milovanova TN, Bhopale VM, Sorokina EM, et al. Lactate stimulates vasculogenic stem cells via the thioredoxin system and engages an autocrine activation loop involving hypoxia-inducible factor 1. Mol Cell Biol 2008;28:6248–6261 [DOI] [PMC free article] [PubMed] [Google Scholar]
- 15.Thom SR, Milovanova TN, Yang M, et al. Vasculogenic stem cell mobilization and wound recruitment in diabetic patients: increased cell number and intracellular regulatory protein content associated with hyperbaric oxygen therapy. Wound Repair Regen 2011;19:149–161 [DOI] [PMC free article] [PubMed] [Google Scholar]
- 16.Galiano RD, Tepper OM, Pelo CR, et al. Topical vascular endothelial growth factor accelerates diabetic wound healing through increased angiogenesis and by mobilizing and recruiting bone marrow-derived cells. Am J Pathol 2004;164:1935–1947 [DOI] [PMC free article] [PubMed] [Google Scholar]
- 17.Kirana S, Stratmann B, Prante C, et al. Autologous stem cell therapy in the treatment of limb ischaemia induced chronic tissue ulcers of diabetic foot patients. Int J Clin Pract 2012;66:384–393 [DOI] [PubMed] [Google Scholar]
- 18.Seo SG, Yeo JH, Kim JIH, Kim J-B, Cho T-J, Lee DY. Negative-pressure wound therapy induces endothelial progenitor cell mobilization in diabetic patients with foot infection or skin defects. Exp Mol Med 2013;45:e62. [DOI] [PMC free article] [PubMed] [Google Scholar]
- 19.Heyboer M 3rd, Milovanova TN, Wojcik S, et al. CD34+/CD45-dim stem cell mobilization by hyperbaric oxygen - changes with oxygen dosage. Stem Cell Res (Amst) 2014;12:638–645 [DOI] [PMC free article] [PubMed] [Google Scholar]
- 20.Liao YF, Chen LL, Zeng TS, et al. Number of circulating endothelial progenitor cells as a marker of vascular endothelial function for type 2 diabetes. Vasc Med 2010;15:279–285 [DOI] [PubMed] [Google Scholar]
- 21.Liang C, Ren Y, Tan H, et al. Rosiglitazone via upregulation of Akt/eNOS pathways attenuates dysfunction of endothelial progenitor cells, induced by advanced glycation end products. Br J Pharmacol 2009;158:1865–1873 [DOI] [PMC free article] [PubMed] [Google Scholar]
- 22.Heissig B, Hattori K, Dias S, et al. Recruitment of stem and progenitor cells from the bone marrow niche requires MMP-9 mediated release of kit-ligand. Cell 2002;109:625–637 [DOI] [PMC free article] [PubMed] [Google Scholar]
- 23.Lapidot T, Petit I. Current understanding of stem cell mobilization: the roles of chemokines, proteolytic enzymes, adhesion molecules, cytokines, and stromal cells. Exp Hematol 2002;30:973–981 [DOI] [PubMed] [Google Scholar]
- 24.Fernández A, De Arriba F, Rivera J, Heras I, Vicente V, Lozano ML. Successful mobilization of hematopoietic peripheral blood progenitor cells with paclitaxel-based chemotherapy as initial or salvage regimen in patients with hematologic malignancies. Haematologica 2008;93:1436–1438 [DOI] [PubMed] [Google Scholar]
- 25.Sorrentino SA, Doerries C, Manes C, et al. Nebivolol exerts beneficial effects on endothelial function, early endothelial progenitor cells, myocardial neovascularization, and left ventricular dysfunction early after myocardial infarction beyond conventional β1-blockade. J Am Coll Cardiol 2011;57:601–611 [DOI] [PubMed] [Google Scholar]
- 26.Chen LL, Liao YF, Zeng TS, Yu F, Li HQ, Feng Y. Effects of metformin plus gliclazide compared with metformin alone on circulating endothelial progenitor cell in type 2 diabetic patients. Endocrine 2010;38:266–275 [DOI] [PubMed] [Google Scholar]
- 27.Margolis DJ, Hoffstad O, Thom S, et al. The differential effect of angiotensin-converting enzyme inhibitors and angiotensin receptor blockers with respect to foot ulcer and limb amputation in those with diabetes. Wound Repair Regen 2010;18:445–451 [DOI] [PMC free article] [PubMed] [Google Scholar]
- 28.Guo S, Cheng Y, Ma Y, Yang X. Endothelial progenitor cells derived from CD34+ cells form cooperative vascular networks. Cell Physiol Biochem 2010;26:679–688 [DOI] [PubMed] [Google Scholar]
- 29.Zou H-X, Jia J, Zhang WF, Sun ZJ, Zhao YF. Propranolol inhibits endothelial progenitor cell homing: a possible treatment mechanism of infantile hemangioma. Cardiovasc Pathol 2013;22:203–210 [DOI] [PubMed] [Google Scholar]
- 30.Xu H, Yang YJ, Yang T, Qian HY. Statins and stem cell modulation. Ageing Res Rev 2013;12:1–7 [DOI] [PubMed] [Google Scholar]
- 31.Hristov M, Fach C, Becker C, et al. Reduced numbers of circulating endothelial progenitor cells in patients with coronary artery disease associated with long-term statin treatment. Atherosclerosis 2007;192:413–420 [DOI] [PubMed] [Google Scholar]
- 32.Fuchs M, Scheid C, Schulz A, Diehl V, Söhngen D. Trimethoprim/sulfamethoxazole prophylaxis impairs function of mobilised autologous peripheral blood stem cells. Bone Marrow Transplant 2000;26:815–816 [DOI] [PubMed] [Google Scholar]
- 33.Tecilazich F, Dinh T, Pradhan-Nabzdyk L, et al. Role of endothelial progenitor cells and inflammatory cytokines in healing of diabetic foot ulcers. PLoS One 2013;8:e83314. [DOI] [PMC free article] [PubMed] [Google Scholar]
- 34.Milovanova TN, Bhopale VM, Sorokina EM, et al. Hyperbaric oxygen stimulates vasculogenic stem cell growth and differentiation in vivo. J Appl Physiol (1985) 2009;106:711–728 [DOI] [PMC free article] [PubMed] [Google Scholar]
- 35.Quiroz FG, Posada OM, Gallego-Perez D, et al. Housekeeping gene stability influences the quantification of osteogenic markers during stem cell differentiation to the osteogenic lineage. Cytotechnology 2010;62:109–120 [DOI] [PMC free article] [PubMed] [Google Scholar]
- 36.Li X, Yang Q, Bai J, Xuan Y, Wang Y. Identification of appropriate reference genes for human mesenchymal stem cell analysis by quantitative real-time PCR. Biotechnol Lett 2015;37:67–73 [DOI] [PMC free article] [PubMed] [Google Scholar]
- 37.Mindaye ST, Ra M, Lo Surdo JL, Bauer SR, Alterman MA. Global proteomic signature of undifferentiated human bone marrow stromal cells: evidence for donor-to-donor proteome heterogeneity. Stem Cell Res (Amst) 2013;11:793–805 [DOI] [PubMed] [Google Scholar]
- 38.Momcilovic O, Knobloch L, Fornsaglio J, Varum S, Easley C, Schatten G. DNA damage responses in human induced pluripotent stem cells and embryonic stem cells. PLoS One 2010;5:e13410. [DOI] [PMC free article] [PubMed] [Google Scholar]
- 39.Yoshitake H, Takeda Y, Nitto T, Sendo F. Cross-linking of GPI-80, a possible regulatory molecule of cell adhesion, induces up-regulation of CD11b/CD18 expression on neutrophil surfaces and shedding of L-selectin. J Leukoc Biol 2002;71:205–211 [PubMed] [Google Scholar]
- 40.Maynard MA, Evans AJ, Shi W, Kim WY, Liu F-F, Ohh M. Dominant-negative HIF-3 alpha 4 suppresses VHL-null renal cell carcinoma progression. Cell Cycle 2007;6:2810–2816 [DOI] [PubMed] [Google Scholar]
- 41.Wang V, Davis DA, Haque M, Huang LE, Yarchoan R. Differential gene up-regulation by hypoxia-inducible factor-1alpha and hypoxia-inducible factor-2alpha in HEK293T cells. Cancer Res 2005;65:3299–3306 [DOI] [PubMed] [Google Scholar]
- 42.Pober JS. Just the FACS or stalking the elusive circulating endothelial progenitor cell. Arterioscler Thromb Vasc Biol 2012;32:837–838 [DOI] [PubMed] [Google Scholar]
- 43.Belch JJ, Topol EJ, Agnelli G, et al.; Prevention of Atherothrombotic Disease Network . Critical issues in peripheral arterial disease detection and management: a call to action. Arch Intern Med 2003;163:884–892 [DOI] [PubMed] [Google Scholar]
- 44.Tung JW, Heydari K, Tirouvanziam R, et al. Modern flow cytometry: a practical approach. Clin Lab Med 2007;27:453–468, v [DOI] [PMC free article] [PubMed] [Google Scholar]
- 45.Porichis F, Hart MG, Griesbeck M, et al. High-throughput detection of miRNAs and gene-specific mRNA at the single-cell level by flow cytometry. Nat Commun 2014;5:5641. [DOI] [PMC free article] [PubMed] [Google Scholar]
- 46.Laing AJ, Dillon JP, Condon ET, et al. Mobilization of endothelial precursor cells: systemic vascular response to musculoskeletal trauma. J Orthop Res 2007;25:44–50 [DOI] [PubMed] [Google Scholar]
- 47.Margolis DJ, Allen-Taylor L, Hoffstad O, Berlin JA. Diabetic neuropathic foot ulcers: the association of wound size, wound duration, and wound grade on healing. Diabetes Care 2002;25:1835–1839 [DOI] [PubMed] [Google Scholar]
- 48.Howangyin KY, Silvestre JS. Diabetes mellitus and ischemic diseases: molecular mechanisms of vascular repair dysfunction. Arterioscler Thromb Vasc Biol 2014;34:1126–1135 [DOI] [PubMed] [Google Scholar]
- 49.Yiu KH, Tse HF. Specific role of impaired glucose metabolism and diabetes mellitus in endothelial progenitor cell characteristics and function. Arterioscler Thromb Vasc Biol 2014;34:1136–1143 [DOI] [PubMed] [Google Scholar]
- 50.Gao W, Ferguson G, Connell P, et al. Glucose attenuates hypoxia-induced changes in endothelial cell growth by inhibiting HIF-1α expression. Diab Vasc Dis Res 2014;11:270–280 [DOI] [PubMed] [Google Scholar]
- 51.Maxwell PH, Wiesener MS, Chang GW, et al. The tumour suppressor protein VHL targets hypoxia-inducible factors for oxygen-dependent proteolysis. Nature 1999;399:271–275 [DOI] [PubMed] [Google Scholar]
- 52.Yoo PS, Mulkeen AL, Cha CH. Post-transcriptional regulation of vascular endothelial growth factor: implications for tumor angiogenesis. World J Gastroenterol 2006;12:4937–4942 [DOI] [PMC free article] [PubMed] [Google Scholar]
- 53.Al-Souhibani N, Al-Ghamdi M, Al-Ahmadi W, Khabar KSA. Posttranscriptional control of the chemokine receptor CXCR4 expression in cancer cells. Carcinogenesis 2014;35:1983–1992 [DOI] [PMC free article] [PubMed] [Google Scholar]
- 54.Lebrun E, Tomic-Canic M, Kirsner RS. The role of surgical debridement in healing of diabetic foot ulcers. Wound Repair Regen 2010;18:433–438 [DOI] [PubMed] [Google Scholar]
Associated Data
This section collects any data citations, data availability statements, or supplementary materials included in this article.


