Abstract
Pancreatic β-cells normally produce adequate insulin to control glucose homeostasis, but in obesity-related diabetes, there is a presumed deficit in insulin production and secretory capacity. In this study, insulin production was assessed directly in obese diabetic mouse models, and proinsulin biosynthesis was found to be contrastingly increased, coupled with a significant expansion of the rough endoplasmic reticulum (without endoplasmic reticulum stress) and Golgi apparatus, increased vesicular trafficking, and a depletion of mature β-granules. As such, β-cells have a remarkable capacity to produce substantial quantities of insulin in obesity, which are then made available for immediate secretion to meet increased metabolic demand, but this comes at the price of insulin secretory dysfunction. Notwithstanding, it can be restored. Upon exposing isolated pancreatic islets of obese mice to normal glucose concentrations, β-cells revert back to their typical morphology with restoration of regulated insulin secretion. These data demonstrate an unrealized dynamic adaptive plasticity of pancreatic β-cells and underscore the rationale for transient β-cell rest as a treatment strategy for obesity-linked diabetes.
Introduction
Obesity-linked type 2 diabetes is marked by failure of pancreatic β-cell mass and function to meet metabolic demand and compensate for insulin resistance (1–4). The loss of pancreatic β-cell mass in type 2 diabetes has been well documented (5) and is believed to be the result of combined stresses directed specifically at the β-cell, including oxidative, inflammatory, amyloidal, and endoplasmic reticulum (ER) stress (4). However, β-cell dysfunction also contributes to the pathogenesis of type 2 diabetes (2), and the loss of normal β-cell function arguably precedes the loss of β-cells (3). The common dysfunctional β-cell characteristics in type 2 diabetes are diminished glucose sensing, increased basal insulin secretion, blunted first-phase insulin secretory response to glucose, and increased proinsulin:insulin ratios (3,4) together with a presumed decrease in insulin production (3). The underlying causes of these dysfunctions are not fully understood. Moreover, whether these dysfunctions are causal to the pathogenesis of obesity-linked type 2 diabetes or symptomatic of hardworking β-cells attempting to produce sufficient insulin for compensation is unclear (3,6,7).
Decreased pancreatic preproinsulin mRNA levels have been reported in models of type 2 diabetes and interpreted as decreased insulin production (8–12). However, most of these studies did not consider that diminished β-cell mass parallels decreased preproinsulin mRNA levels. Thus, whether β-cell insulin production is actually decreased in obesity-related type 2 diabetes or is merely insufficient to meet the demand remains open to study. One reason why this central issue has not been resolved is that proinsulin biosynthesis has not been directly measured in obesity-linked type 2 diabetes.
In the present study, we examined proinsulin biosynthesis in a commonly used model of obesity-linked type 2 diabetes, the db/db mouse. We used two closely related strains of db/db mice relative to age- and sex-matched wild-type (WT) animals: C57BL/6J db/db mice (referred to hereon as 6Jdb/db) in which β-cell mass expands to compensate for inherent insulin resistance and C57BLKS/J db/db mice (referred to hereon as KSdb/db) in which β-cell mass fails to compensate for the insulin resistance (13,14). The difference in susceptibility to diabetes in 6Jdb/db versus KSdb/db mice linked to the ability for β-cell mass compensation is essentially unknown. However, both models have some relevance to human type 2 diabetes. The compensating 6Jdb/db mice represent a model of early pathogenesis of obesity-linked type 2 diabetes where hyperinsulinemia and glucose intolerance exist but β-cells are nonetheless attempting to compensate for the insulin resistance. The KSdb/db mice may represent a model later in the pathogenesis where β-cell mass is insufficient to compensate. However, in contrast to current belief, we show that the remaining β-cells of both hyperglycemic and hyperinsulinemic db/db mouse models display a marked upregulation of insulin production that drastically alters the morphology of the β-cell secretory pathway, which then becomes a major contributor to insulin secretory dysfunction in these animals. Of note, we find that this is reversible when the β-cells are exposed to normal glucose levels overnight. The findings highlight a remarkable rapid adaptive plasticity of the β-cell that is constantly striving to acclimate insulin production relative to glucose homeostasis (15).
Research Design and Methods
Animals
C57BL/6J, 6Jdb/db, C57BLKS/J, and KSdb/db mice were bred in-house or purchased from The Jackson Laboratory (Bar Harbor, ME). Unless otherwise stated, the mice were studied between 14 and 16 weeks of age. Pancreatic islets were isolated by collagenase digestion as previously described (16). Glucose tolerance tests were conducted as previously described (16). Animal care, use, and experimental protocols were approved by the Institutional Animal and Use Committee of The University of Chicago.
Immunofluorescence Analysis
Mouse pancreata were fixed, embedded, and cut into 5-μm sections for immunofluorescence confocal microscopy as previously described (17,18). Primary antibodies used were guinea pig anti-insulin (Millipore, Billerica, MA), mouse anti-glucagon (Sigma-Aldrich, St. Louis, MO), goat anti-somatostatin (Santa Cruz Biotechnology, Dallas, TX), rabbit anti-MafA (Santa Cruz Biotechnology), and mouse anti–β-catenin (Becton Dickinson, Franklin Lakes, NJ). Species-specific donkey secondary antibodies conjugated to Cy2, Cy3, and Cy5 fluorophores were from Jackson ImmunoResearch Laboratories (West Grove, PA) and mounted with DAPI (Invitrogen, Eugene, OR).
Electron Microscopy Analysis
Isolated islets were fixed by high-pressure freezing, stained, and embedded as described (19). Eighty-nanometer sections were imaged using an FEI Tecnai G2 F30 Super Twin electron microscope (EM). Electron micrographs of islets were viewed using IMOD software incorporating the eTomo and 3dmod graphic user interfaces (20) on a Wacom Cintiq 22HD art tablet (Vancouver, WA). Organelles were traced, and their cell surface area/total β-cell area calculated. EM tomography on 300–400-nm thick islet sections together with three-dimensional (3D) image reconstruction was as previously described (19–21).
In Vitro Islet Metabolic Oxidation Analysis
A Seahorse Bioscience XF24 respirometer (Chicopee, MA) was used to assess the isolated islet oxygen consumption rate (OCR) in 6Jdb/db or 6J+/+ islets at basal (3 mmol/L) or stimulatory (17 mmol/L) glucose. Fifty islets from either 6Jdb/db or 6J+/+ mice were used per analysis in a 24-well microplate. Islets were exposed to basal glucose for 25 min and then to either stimulatory (17 mmol/L) or basal (3 mmol/L) glucose for 34 min. Immediately following, islets were collected and lysed, and the total protein content was determined to yield the OCR per total protein content (Pierce BCA Protein Assay Kit; Thermo Scientific, Rockford, IL).
mRNA Analysis
Quantitative real-time RT-PCR analysis of preproinsulin-1 and -2 mRNA relative to control β-actin mRNA levels was as previously described (18). The primers used were as follows: preproinsulin-1 forward 5′-GGACTATAAAGCTGGTGGGCATC-3′ and reverse 5′-TGTGTAGAAGAAGCCACGCTC-3′, preproinsulin-2 forward 5′-TGCTATCCTCAACCCAGCCTATC-3′ and reverse 5′-AGTGCCAAGGTCTGAAGGTC-3′, and β-actin forward 5′-TGTCACCAACTGGGACGATA-3′ and reverse 5′-GGGGTGTTGAAGGTCTCAAA-3′.
In Vitro Proinsulin Biosynthesis Analysis
Proinsulin biosynthesis was directly assessed in isolated islets by pulse radiolabeling with 0.1 mCi L-[3,4,5-3H]leucine (185 MBq/mL, 4 TBq/mmol) (PerkinElmer, Waltham, MA) followed by (pro)insulin immunoprecipitation, alkaline-urea PAGE, and fluorography as previously described (16,22). Aliquots of the islet lysates were collected to analyze for total protein content (Pierce BCA Protein Assay Kit) and total protein synthesis as previously described (22).
Immunoblot Analysis
Mouse islet lysate proteins were subjected to immunoblot analysis as previously described (22,23). The antibodies used were rabbit anti-BiP, anti-PERK, anti–α/β-tubulin, and anti-cleaved caspase-3 from Cell Signaling (Danvers, MA); mouse anti-CHOP from Santa Cruz Biotechnology; and rabbit anti-calnexin from Abcam (Cambridge, MA).
In Vitro Insulin Secretion Analysis
Experiments were performed on either fresh islets, immediately after isolation, or recovered isolated islets examined after overnight culture at 5.6 mmol/L glucose. Static incubation and islet perifusion experiments were as previously described (16,24). Insulin and proinsulin concentrations were measured by mouse ELISA (ALPCO, Salem, NH).
Statistical Analysis
Results are presented as mean ± SE. Statistical differences were analyzed by Student t test for unpaired samples, where P ≤ 0.05 was considered significant.
Results
The Phenotype of the db/db Mouse Models
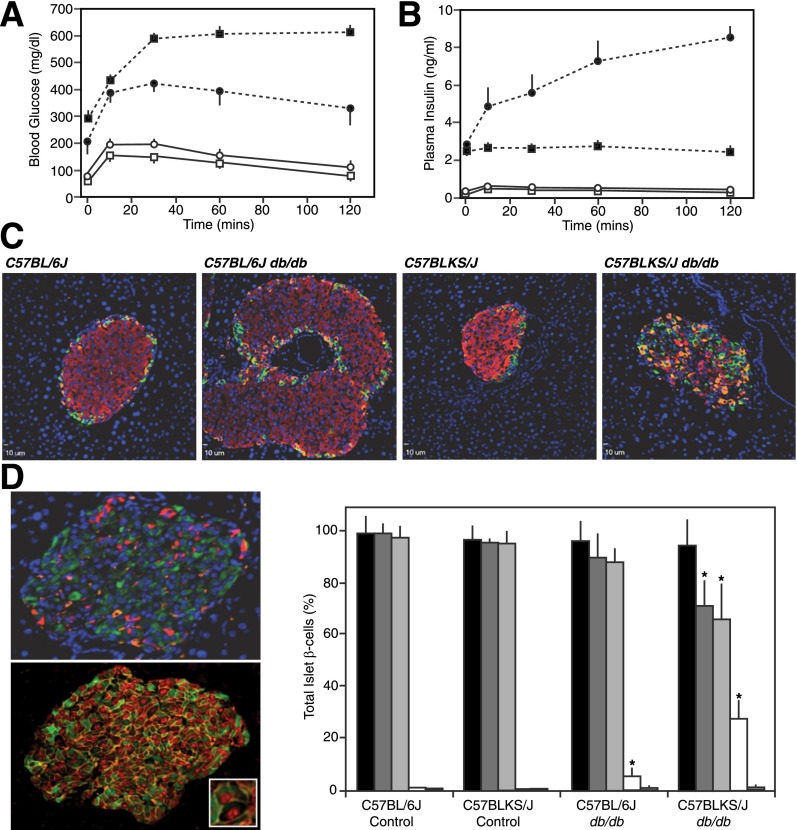
Both 6Jdb/db and KSdb/db mice had significant blood fasting hyperglycemia (210 ± 10 and 293 ± 27 mg/dL, respectively; P ≤ 0.01) (Fig. 1A). This was accompanied by elevated fasting insulin levels ≥10-fold higher than controls (2.9 ± 0.2 vs. 0.30 ± 0.03 ng/mL in 6Jdb/db vs. 6J+/+ mice and 2.5 ± 0.2 vs. 0.14 ± 0.04 ng/mL in KSdb/db vs. KS+/+ mice, respectively; P ≤ 0.02) (Fig. 1B). In glucose tolerance tests, in vivo insulin secretion from the KSdb/db mice was not responsive to glucose (Fig. 1B), but 2 h postprandially, 6Jdb/db mice had ∼30-fold higher circulating insulin levels than 6J+/+ control mice (P ≤ 0.01) (Fig. 1B). Hence, 6Jdb/db mice were more glucose responsive relative to KSdb/db mice (13,14).
Figure 1.
Pancreatic endocrine phenotype and islet immunofluorescence analysis of obese db/db mouse models. Intraperitoneal injection of glucose (1 g/kg of body weight) in 16-week-old 6J+/+ (○), 6Jdb/db (●), KS+/+ (□), and KSdb/db (■) mice and subsequent analysis of tail blood glucose (A) and plasma insulin levels (B). Data are mean ± SE (n ≥6). C: Representative immunofluorescent images of 14- to 16-week-old mouse pancreatic sections stained for insulin (red), glucagon (orange), and somatostatin (green). D: Representative immunofluorescent images of 10-week-old KSdb/db mouse pancreatic sections stained for insulin (green), glucagon (red), and somatostatin (orange) (top image) or insulin (green), β-catenin (orange), and MafA (red) (bottom image). The inset magnifies an example of an MafA(+)/insulin(−)–empty β-cell. Quantification of MafA(+) and insulin(+) cells from sections of control and db/db mouse pancreas is also shown as the percentage of total islet β-cells: MafA(+) (black bars), insulin(+) (dark gray bars), MafA(+)/insulin(+) (light gray bars), MafA(+)/insulin(−) (white bars), and MafA(−)/insulin(+) (hatched bars). Data are mean ± SE (n = 6). *P ≤ 0.05 indicates a statistically significant difference vs. respective (WT) controls.
β-Cell Heterogeneity in db/db Mouse Models
Using insulin as a marker for β-cells, adult KSdb/db mice apparently lose β-cell mass relative to KS+/+ controls, and 6Jdb/db mice have an increased β-cell population relative to 6J+/+ controls (13), as reaffirmed here (Fig. 1C). However, in younger (10-week-old) KSdb/db mice, heterogeneity among β-cells for insulin expression was noted (Fig. 1D, upper left panel). Using an alternative specific β-cell marker, the transcription factor MafA (25), together with insulin, apparent MafA(+)/insulin(−) empty β-cells were identified (Fig. 1D, bottom left panel). All β-cells in 6J+/+ and KS+/+ control mice were MafA(+)/insulin(+) cells, but in 6Jdb/db mice pancreata, 5% of the β-cells were MafA(+)/insulin(−), and in KSdb/db mice, ∼25% of β-cells were MafA(+)/insulin(−) (P ≤ 0.05) (Fig. 1D, right panel). Thus, by only using insulin as a β-cell marker, β-cell populations could be underestimated.
β-Cell heterogeneity in db/db mouse islets was also reflected by variation in proinsulin compartmentalization. In 6J+/+ and KS+/+ mouse islet β-cells, proinsulin is confined to a limited juxtanuclear region, likely a trans Golgi network/immature β-granule compartment where proinsulin condenses (26,27) (Supplementary Fig. 1). However, in many β-cells of 6Jdb/db and KSdb/db islets, proinsulin was more widely distributed throughout the β-cell (Supplementary Fig. 1).
The Ultrastructure of db/db Islet β-Cells
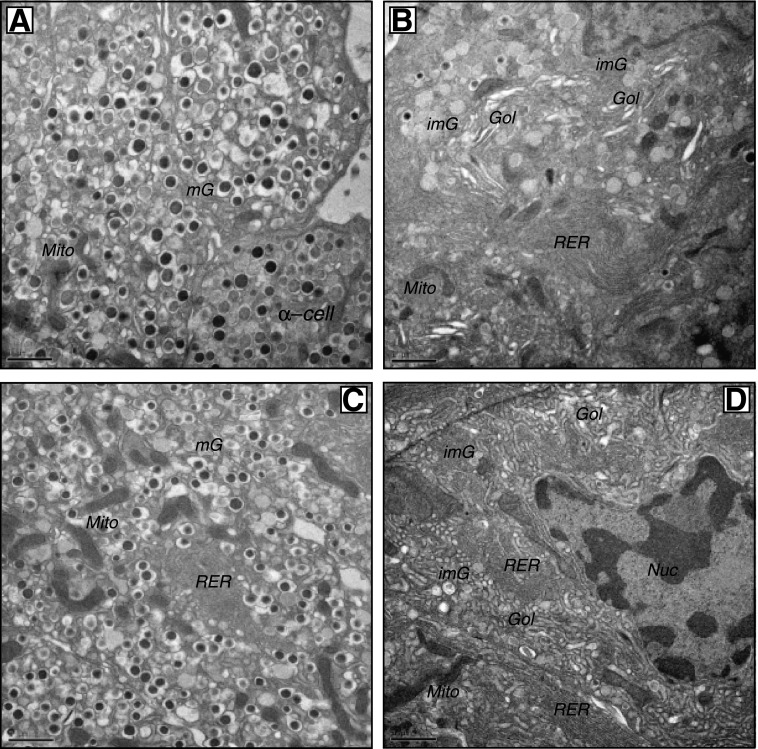
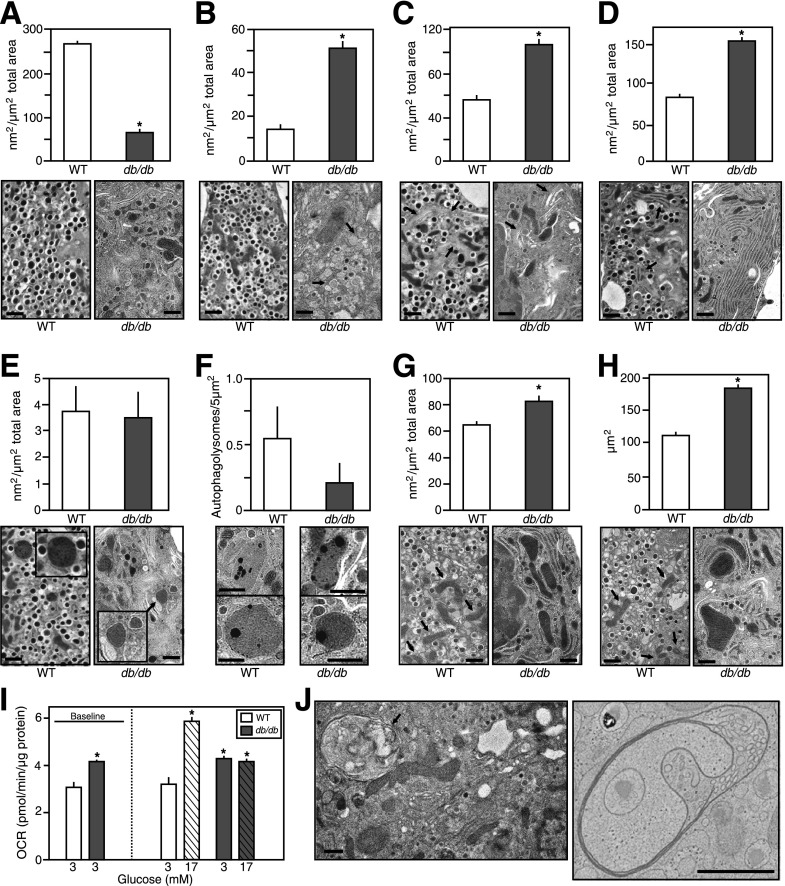
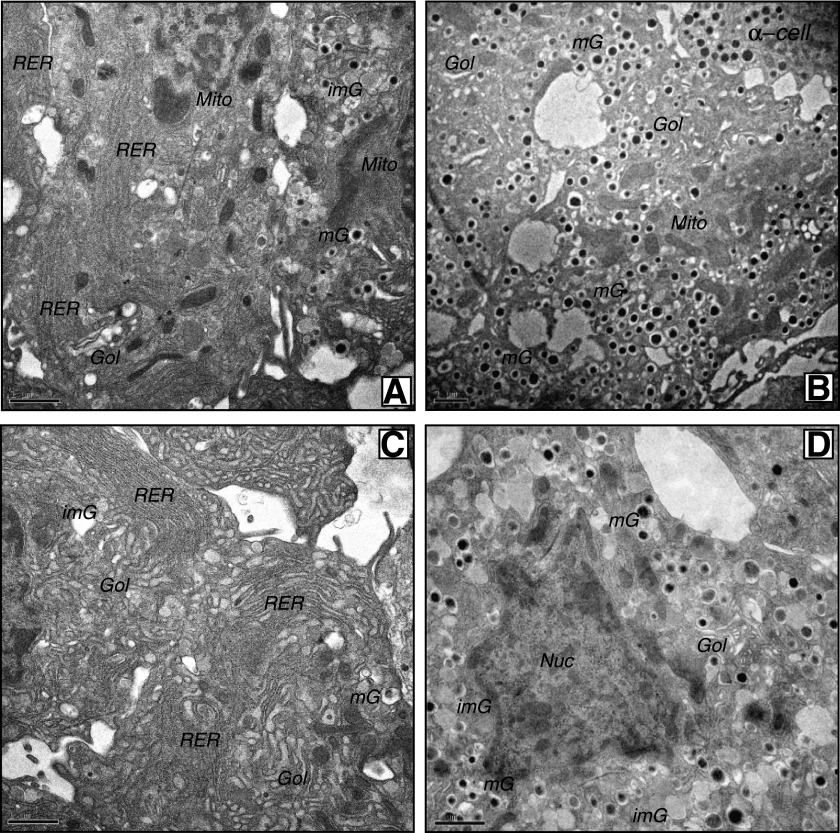
Freshly isolated islets were examined by EM. Islet β-cells from 6J+/+ and KS+/+ mice had a typical ultrastructure of being highly populated with mature dense-core β-granules (Fig. 2A and C). However, β-cells from 6Jdb/db and KSdb/db islets had quite distinct morphology (Fig. 2B and D and Supplementary Fig. 2). The db/db β-cells had marked degranulation of mature β-granules and expansion of the rough endoplasmic reticulum (RER) and Golgi apparatus together with increased numbers of immature β-granules. Mature β-granules have a hexameric dense core (reflective of a condensed insulin crystalline structure) and a halo space between the core and the β-granule membrane. Immature granules, which contain a higher proportion of proinsulin, have not yet formed a condensed crystalline core, which is less electron dense and lacks the characteristic halo of mature β-granules (26). The lack of mature β-granules and increased immature granules were more dramatic in the few remaining KSdb/db mouse β-cells (Fig. 2B and D and Supplementary Fig. 2) (28). Because there were more β-cells in 6Jdb/db islets, a quantification of 6Jdb/db and 6J+/+ islet β-cells was conducted, indicating a >75% decrease of mature β-granules in β-cells of 6Jdb/db (P ≤ 0.001) (Fig. 3A) yet a more than threefold increase in immature β-granules (P ≤ 0.01) (Fig. 3B) and a more than twofold expansion of the Golgi apparatus (P ≤ 0.005) (Fig. 3C) and RER (P ≤ 0.005) (Fig. 3D). There was no difference in lysosomal or autophagolysosomal degradation compartments (Fig. 3E and F). However, large multivesicular bodies (MVBs) were found in 6Jdb/db β-cells (Fig. 3J), which were not observed in control 6J+/+ β-cells. Using EM tomography, a 3D reconstruction of a 6Jdb/db β-cell MVB was derived (Video 1), consisting of three bilayer membranes (that had incidentally entrapped a β-granule), each with different structures (Video 1 and Supplementary Fig. 3). The innermost bilayer formed vesicular membranes; the middle membrane comprised tubular pancake-like stacks and the outer bilayer a continuous tube (Video 1 and Supplementary Fig. 3). Mitochondria in 6Jdb/db mice also occupied an increased β-cell area (P ≤ 0.02) (Fig. 3G) due to increased mitochondrial size (P ≤ 0.01) (Fig. 3H). This was associated with increased basal oxygen consumption in 6Jdb/db islets that was not responsive to glucose (P ≤ 0.05) (Fig. 3I), unlike that in control 6J+/+ mouse islets (Fig. 3I) (29). Finally, neighboring α-, δ-, and pancreatic polypeptide cells in 6Jdb/db and KSdb/db mouse islets had normal morphology comparable to that found in 6J+/+ and KS+/+ mice (Supplementary Fig. 4). Thus, dramatic morphological changes were specific to β-cells of db/db mouse islets.
Figure 2.
Conventional EM analysis of isolated islets. Islets from control and db/db mice were fixed by high-pressure freezing immediately after isolation, then analyzed by EM. Representative images are shown of β-cells from freshly isolated 6J+/+ control islets (A), 6Jdb/db islets (B), KS+/+ control islets (C), and KSdb/db islets (D). Scale bar = 1 μm. Gol, Golgi apparatus; imG, immature β-granules; mG, mature β-granules; Mito, mitochondria; Nuc, nucleus.
Figure 3.
Quantification of conventional EM analysis of pancreatic islet β-cells from normal vs. obese mice. Islets from 6J+/+ control and obese 6Jdb/db mice were fixed by high-pressure freezing immediately after isolation and analyzed by EM. Images were then collected, and the surface area occupied by certain organelles was quantified as outlined in the research design and methods. Quantification data are mean ± SE (n ≥3 islet isolations, with >100 individual EM images per isolation quantified). Representative images depicting typical organelles from 6J+/+ control or obese 6Jdb/db mouse islet β-cells are shown. Scale bar = 1 μm. A: β-Cell area occupied by mature β-granules. B: β-Cell area occupied by immature β-granules (highlighted by arrows in 6J+/+ mouse β-cell image). C: β-Cell area occupied by Golgi apparatus (highlighted by arrows). D: β-Cell area occupied by RER (highlighted by arrows in 6J+/+ mouse β-cell image). E: β-Cell area occupied by lysosomes (image inset shows ×2 enlarged lysosome images). F: β-Cell area occupied by autophagolysosomes. G: β-Cell area occupied by mitochondria (highlighted by arrows in 6J+/+ mouse β-cell image). H: Average area of individual mitochondria (highlighted by arrows in 6J+/+ mouse β-cell image). I: Basal and glucose-stimulated OCRs of freshly isolated islets from 6J+/+ control or obese 6Jdb/db mouse (as measured by Seahorse Bioscience XF24 instrumentation as outlined in the research design and methods). Data are mean ± SE (n ≥8). J: Example MVBs observed in islet β-cells of obese 6Jdb/db mice. Scale bar = 1 μm. An EM tomogram and 3D reconstruction of the MVB in the right panel are shown in Video 1 and Supplementary Fig. 2. *P ≤ 0.05 vs. respective (WT) controls.
(Pro)insulin Biosynthesis in Freshly Isolated db/db Mouse Islets
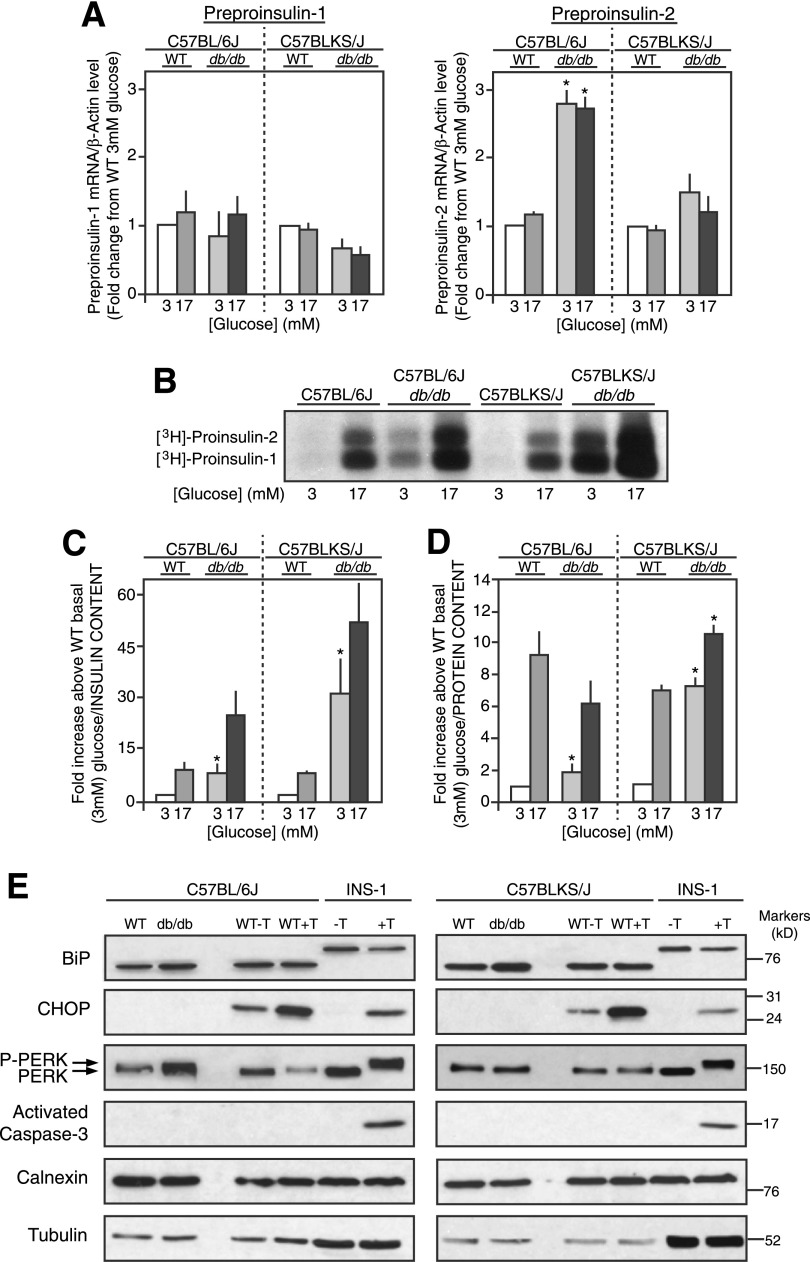
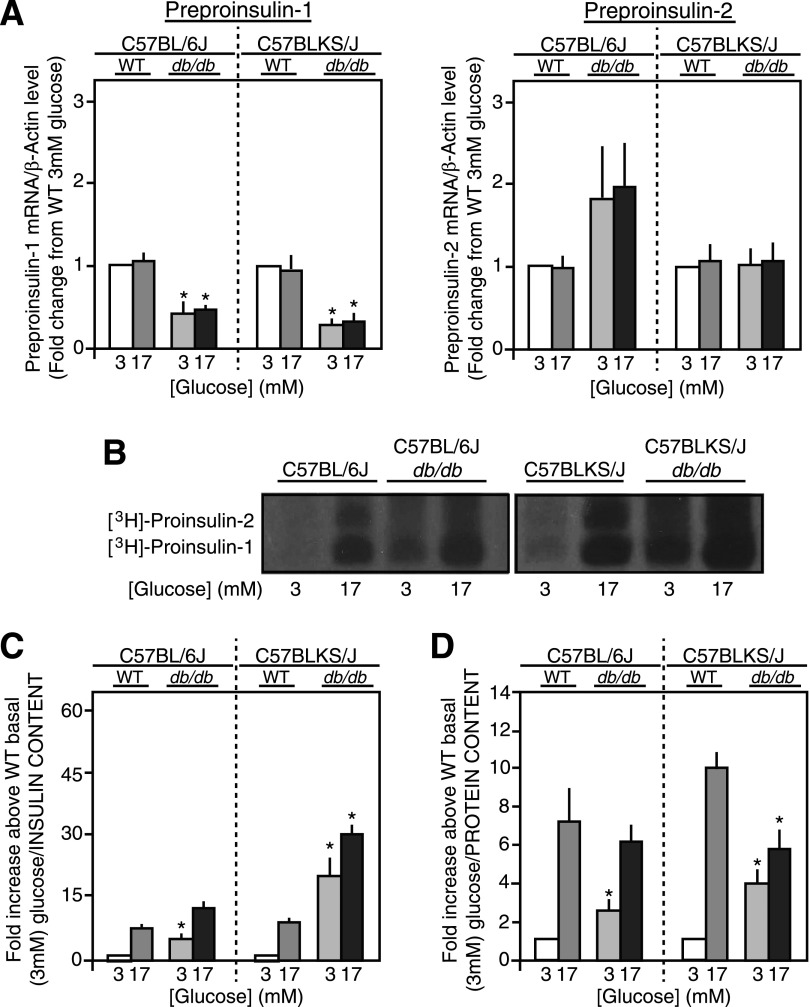
Preproinsulin-1 and -2 mRNA levels were unaffected by glucose in 6Jdb/db, 6J+/+ control, KSdb/db, and KS+/+ control mouse islets (Fig. 4A) as expected because of the short exposure time to glucose (30). Preproinsulin-1 mRNA levels were unchanged in 6Jdb/db versus 6J+/+ or KSdb/db versus KS+/+ mouse islets (Fig. 4A), but preproinsulin-2 mRNA levels were increased more than twofold in 6Jdb/db versus 6J+/+ islets (P ≤ 0.05), although not in KSdb/db versus KS+/+ islets (Fig. 4A). When directly measured in freshly isolated control 6J+/+ and KS+/+ islets, a six- to eightfold glucose-induced increase in proinsulin-1 and -2 biosynthesis was observed (Fig. 4B). In db/db mouse islets, however, proinsulin biosynthesis was markedly increased, particularly at basal 3 mmol/L glucose in both 6Jdb/db (4.4 ± 0.9-fold/islet, P ≤ 0.05) and KSdb/db (11.0 ± 0.9-fold/islet, P ≤ 0.05) relative to respective 6J+/+ and KS+/+ controls (Fig. 4B). Glucose-stimulated proinsulin biosynthesis remained in the db/db mouse islets, with a 14-fold increase observed in 6Jdb/db islets and a 15-fold increase in KSdb/db islets versus that in respective 6J+/+ and KS+/+ control islets at basal 3 mmol/L glucose (Fig. 4B). Quantification of proinsulin biosynthesis was normalized to islet insulin (Fig. 4C) or protein content (Fig. 4D) to better consider the degree of proinsulin biosynthesis relative to β-cells or total islet cells, respectively. Relative to islet insulin content, 6Jdb/db and KSdb/db islet proinsulin biosynthesis was significantly increased at both basal and stimulatory glucose concentrations (Fig. 4C). Relative to islet protein content, basal proinsulin biosynthesis was significantly increased in 6Jdb/db islets but not at stimulatory glucose relative to 6J+/+ control islets (Fig. 4D). In contrast, proinsulin biosynthesis in KSdb/db islets was increased at both basal 3 mmol/L and stimulatory 17 mmol/L glucose (Fig. 4D).
Figure 4.
Proinsulin biosynthesis in freshly isolated islets. A: Preproinsulin-1 and -2 mRNA levels of islets from control (WT) and db/db mice treated with glucose (3 mmol/L or 17 mmol/L for 90 min) were measured by quantitative real-time RT-PCR and normalized to β-actin mRNA levels. Data are mean ± SE (n ≥5). B: Representative alkaline-urea PAGE autoradiograph image of immunoprecipitated [3H]proinsulin-1 and -2 biosynthesis from islets treated with glucose (3 mmol/L or 17 mmol/L for 90 min) and pulse radiolabeled with [3H]leucine. C and D: Quantification of [3H]proinsulin alkaline-urea PAGE autoradiography normalized to islet insulin content (C) or islet protein content (D). Data are mean ± SE (n ≥4). *P ≤ 0.05 vs. respective (WT) controls. E: Immunoblot analyses for various RER and ER stress markers from lysates of freshly isolated islets from control (WT) and db/db mice are shown. As a positive control for ER stress, control mouse islets and INS-1 cells were incubated for 6 h with (+T) or without (−T) 2.5 μmol/L thapsigargin, and immunoblot analyses were conducted in parallel. Example images of immunoblots from several experiments (n ≥5) are shown. P-PERK, phosphorylated PERK.
No Evidence of ER Stress in db/db Islets
Due to RER expansion in db/db mouse β-cells (Figs. 2B and D and 3D and Supplementary Fig. 2), markers of ER stress were examined. As a positive control, either 6J+/+ and KS+/+ islets or INS-1 cells were exposed to thapsigargin 2.5 μmol/L for 6 h in vitro at 5.6 mmol/L glucose to deliberately induce ER stress (31,32). Thapsigargin did not affect expression of the ER chaperone BiP in INS-1 cells or 6J+/+ or KS+/+ islets (Fig. 4E). PERK phosphorylation and induced CHOP expression were used as indicators of ER stress (31). An in vitro culture effect induced CHOP expression in 6J+/+ and KS+/+ islets (Fig. 4E), yet thapsigargin further increased CHOP expression and PERK phosphorylation [indicated by decreased electrophoretic mobility (33)] in INS-1 cells and 6J+/+ and KS+/+ islets (Fig. 4E). In INS-1 cells, this was accompanied by activation of caspase-3 (Fig. 4E), indicating ER stress leading to apoptosis (31,32). However, comparing freshly isolated 6Jdb/db or KSdb/db islets to their respective 6J+/+ and KS+/+ control islets, there was neither induction of CHOP expression, change in PERK phosphorylation state, nor activation of caspase-3 (Fig. 4E). Also of note, the expanded RER in the 6Jdb/db and KSdb/db islets showed no signs of abnormal RER swelling, which often is interpreted as an indicator of ER stress (Fig. 2B and 2D and Supplementary Fig. 1), and proinsulin biosynthesis was far from perturbed (Fig. 4B–D). However, a modest increase in BiP expression occurred in db/db islets relative to calnexin or tubulin expression (Fig. 4E). These data are consistent with the presence of an adaptive unfolded protein response (UPR) in 6Jdb/db and KSdb/db islets (32) but not ER stress.
Proinsulin/Insulin Content and Secretion From Freshly Isolated db/db Mouse Islets
Despite increased β-cell numbers in 6Jdb/db mouse islets (Fig. 1C) (13), insulin content was significantly decreased by 70% compared with 6J+/+ control islets (P ≤ 0.05) (Supplementary Fig. 5A). Insulin content of KSdb/db islets was reduced by >80% relative to KS+/+ controls (P ≤ 0.05) (Supplementary Fig. 5A), correlating with the β-cell loss. Islet insulin and proinsulin content was essentially unaffected by glucose (Supplementary Fig. 5A and B). However, the proportion of intracellular proinsulin in freshly isolated islets of both 6Jdb/db and KSdb/db mice was increased relative to respective control 6J+/+ and KS+/+ mice (P ≤ 0.05) (Supplementary Fig. 5B).
In static in vitro incubations, glucose-induced insulin secretion was inhibited in 6Jdb/db relative to 6J+/+ islets (P ≤ 0.05) (Supplementary Fig. 5C). In KSdb/db islets, glucose-stimulated insulin secretion was similar to that in KS+/+ islets (Supplementary Fig. 5C), but basal insulin secretion was increased threefold (P ≤ 0.05) (Supplementary Fig. 5C). Consequently, this reduced the magnitude of the glucose-induced secretory response in KSdb/db islets by ∼70% (P ≤ 0.05) (Supplementary Fig. 5C). The percentage of secreted proinsulin relative to secreted insulin was twofold higher in 6Jdb/db than in 6J+/+ islets. In contrast, there was no significant difference in the proinsulin:insulin secretion ratio between KSdb/db and KS+/+ islets (Supplementary Fig. 5D).
The Dynamics of Insulin Secretion in Perifused Freshly Isolated db/db Mouse Islets
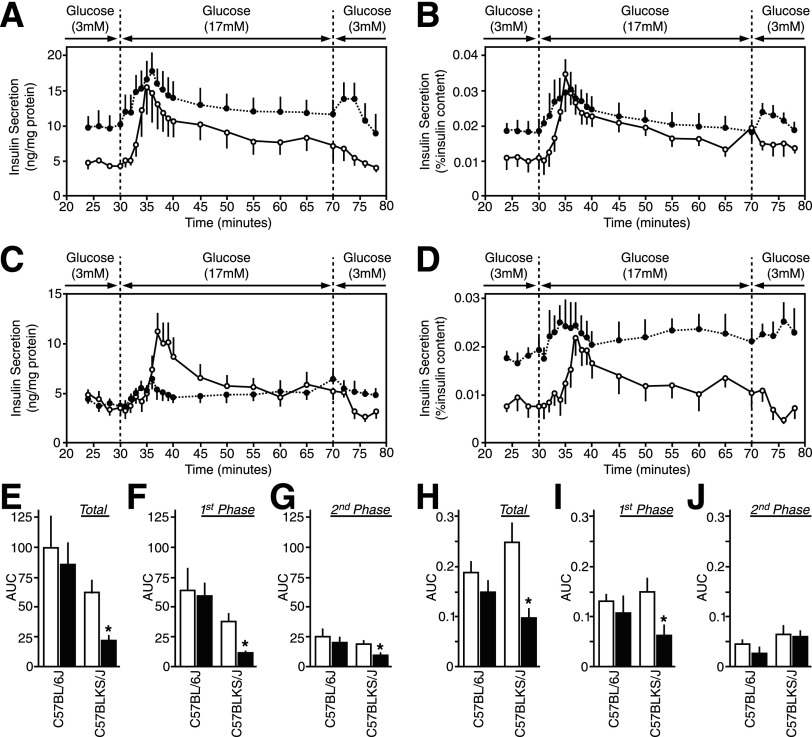
To assess the first and second phases of glucose-induced insulin secretion, islet perifusion analysis was conducted. The results were either normalized to total protein content (Fig. 5A and C) to indicate insulin secretion per islet or to islet insulin content (Fig. 5B and D) to indicate insulin secretory capacity. For 6Jdb/db islets, basal insulin secretion was increased compared with 6J+/+ controls (Fig. 5A and B). In KSdb/db islets, basal insulin secretion at 3 mmol/L glucose was similar to KS+/+ islets when expressed relative to islet total protein content (Fig. 5C) but was nonetheless elevated over basal insulin secretory capacity (Fig. 5D). The dynamics of glucose-induced insulin secretion were similar in 6Jdb/db islets compared with 6J+/+ islets (Fig. 5A, B, and E–J). In contrast, glucose-induced insulin secretion was significantly blunted in KSdb/db islets compared with equivalent KS+/+ islets, particularly first-phase glucose-induced insulin secretion (P ≤ 0.05) (Fig. 5C, D, and E–J).
Figure 5.
Insulin secretion dynamics from freshly isolated islets. Isolated islets from control (○, white bars) and db/db (●, black bars) mice were perifused with glucose (3 mmol/L for 30 min, 17 mmol/L for 40 min, and then back to 3 mmol/L for 10 min), and the insulin concentration was measured in the collected fractions and islet lysates. A and B: Insulin secretion from 6J+/+ and 6Jdb/db mouse islets normalized to islet protein content (A) or islet insulin content (B). The insulin content was 59.7 ± 6.7 ng/mg protein for 6J+/+ mouse islets and 62.1 ± 10.2 ng/mg protein for 6Jdb/db mouse islets. C and D: Insulin secretion from KS+/+ and KSdb/db mouse islets normalized to islet protein content (C) or islet insulin content (D). The insulin content was 26.6 ± 2.5 ng/mg protein for KS+/+ mouse islets and 11.9 ± 1.9 ng/mg protein for KSdb/db mouse islets. E–J: Area under the curve (AUC) quantifications of the insulin secreted at stimulatory 17 mmol/L glucose over insulin secreted at basal 3 mmol/L glucose. AUC data are total insulin secretion normalized to islet protein content (E) or islet insulin content (H), first-phase insulin secretion (the initial 10 min of 17 mmol/L glucose stimulation) normalized to islet protein content (F) or islet insulin content (I), and second-phase insulin secretion (the latter 30 min exposure to 17 mmol/L glucose) normalized to islet protein content (G) or islet insulin content (J). Data are mean ± SE (n ≥5). *P ≤ 0.05 indicates a statistically significant difference vs. respective (WT) controls.
Recovery of Ultrastructure in db/db Islet β-Cells Exposed to Normal Glucose
When isolated islets from 6Jdb/db and KSdb/db islets were incubated in vitro overnight at normal 5.6 mmol/L glucose (3,6), they reverted back to a morphology more reminiscent of a normal islet β-cell (Fig. 6B and D) relative to freshly isolated 6Jdb/db and KSdb/db islet β-cells (Fig. 6A and C). These recovered 6Jdb/db and KSdb/db β-cells had repopulated mature β-granules and decreased previously expanded RER, Golgi apparatus, and immature β-granule compartments (Fig. 6B and D) to an extent similar to that of normal 6J+/+ and KS+/+ control islets (Fig. 2A and C).
Figure 6.
Conventional EM analysis of recovered isolated islets from db/db mice. Islets from db/db mice were fixed by high-pressure freezing immediately after isolation or after overnight recovery at a normoglycemic 5.6 mmol/L glucose, then analyzed by EM. Representative images are shown of β-cells from freshly isolated 6Jdb/db islets (A), overnight recovered 6Jdb/db islets (B), freshly isolated KSdb/db islets (C), and overnight recovered KSdb/db islets (D). Scale bar = 1 μm. Gol, Golgi apparatus; imG, immature β-granules; mG, mature β-granules; Mito, mitochondria; Nuc, nucleus.
(Pro)insulin Biosynthesis in Recovered db/db Mouse Islets
Mouse preproinsulin-1 mRNA levels were reduced in the 6Jdb/db and KSdb/db islets versus their respective 6J+/+ and KS+/+ control islets (P ≤ 0.05) (Fig. 7A). A trend remained for preproinsulin-2 mRNA levels to be elevated in recovered 6Jdb/db islets relative to control 6J+/+ islets, but equivalent preproinsulin-2 mRNA levels were found in recovered KSdb/db versus KS+/+ islets (Fig. 7A).
Figure 7.
Proinsulin biosynthesis in overnight-recovered islets. Isolated islets from control (WT) and db/db mice were cultured overnight in medium containing normoglycemic 5.6 mmol/L glucose. Recovered islets were then treated with basal 3 mmol/L or stimulatory 17 mmol/L glucose for 90 min. A: Islet preproinsulin-1 and -2 mRNA levels were measured by quantitative real-time RT-PCR and normalized to β-actin mRNA levels. B: Representative alkaline-urea PAGE autoradiograph image of immunoprecipitated [3H]proinsulin-1 and -2 biosynthesis from islets radiolabeled with [3H]leucine. C and D: Quantification of [3H]proinsulin alkaline-urea PAGE autoradiography normalized to islet insulin content (C) or islet protein content (D). Data are mean ± SE (n ≥4). *P ≤ 0.05 indicates a statistically significant difference vs. respective (WT) controls.
Proinsulin biosynthesis at basal 3 mmol/L glucose remained significantly elevated in recovered 6Jdb/db and KSdb/db islets compared with controls (P ≤ 0.05) (Fig. 7B–D). However, glucose-stimulated proinsulin biosynthesis in recovered 6Jdb/db islets was equivalent to that in 6J+/+ control islets (Fig. 7B–D), but recovered KSdb/db islets remained significantly elevated relative to that in KS+/+ control islets (Fig. 7B and C) but lower than that observed in freshly isolated KSdb/db islets (P ≤ 0.05) (Fig. 4B–D).
Proinsulin/Insulin Content and Secretion From Isolated Recovered db/db Mouse Islets
Insulin content in recovered 6Jdb/db islets was equivalent to that found in 6J+/+ islets (Supplementary Fig. 6A). Although insulin content in recovered KSdb/db islets remained decreased relative to KS+/+ islets (P ≤ 0.05) (Supplementary Fig. 6A), it was less so than that in freshly isolated KSdb/db islets (Supplementary Fig. 5A). The proportion of intracellular proinsulin in isolated recovered islets of both 6Jdb/db and KSdb/db mice was no different compared with 6J+/+ and KS+/+ control mice (Supplementary Fig. 6B). The relative percentage of glucose-stimulated insulin and proinsulin secretion from recovered 6Jdb/db and KSdb/db islets was equivalent to that from 6J+/+ and KS+/+ islets (Supplementary Fig. 6C and D).
The Dynamics of Insulin Secretion in Perifused Recovered Isolated db/db Mouse Islets
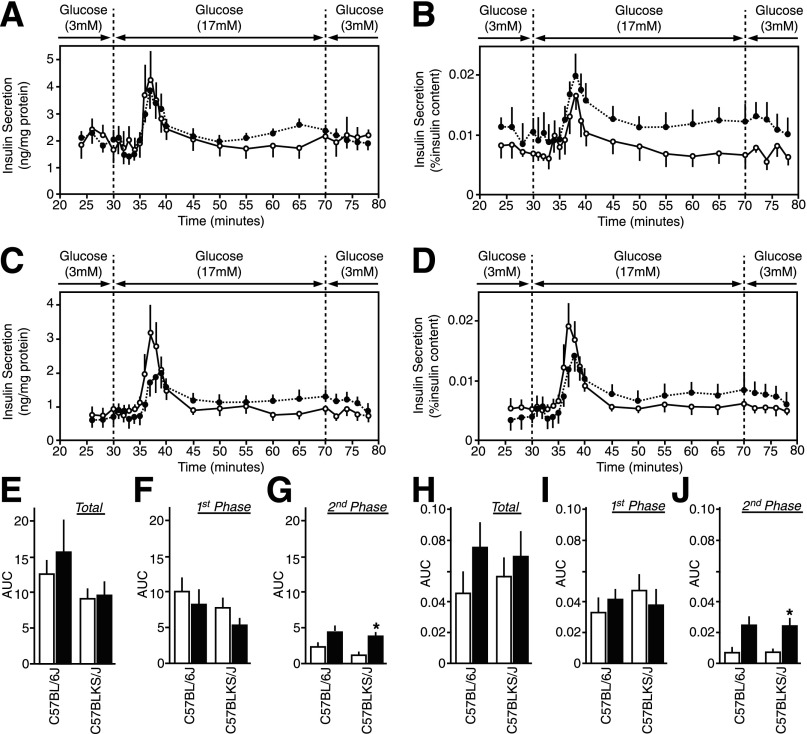
The basal rate of insulin secretion at 3 mmol/L glucose in recovered 6Jdb/db and KSdb/db islets was equivalent to that in respective 6J+/+ and KS+/+ control islets (Fig. 8A–D). Remarkably, both the first and the second phases of glucose-induced insulin secretion in recovered 6Jdb/db and KSdb/db islets were also similar to that in respective 6J+/+ and KS+/+ control islets (Fig. 8A–D).
Figure 8.
Insulin secretion dynamics from overnight-recovered islets. Isolated islets from control (○, white bars) and db/db (●, black bars) mice were cultured overnight in RPMI medium containing normoglycemic 5.6 mmol/L glucose. Recovered islets were then perifused with glucose (3 mmol/L for 30 min, 17 mmol/L for 40 min, and then back to 3 mmol/L for 10 min), and the insulin concentration was measured in the collected fractions and islet lysates. A and B: Insulin secretion from 6J+/+ and 6Jdb/db mouse islets normalized to islet protein content (A) or islet insulin content (B). The insulin content was 34.2 ± 5.3 ng/mg protein for 6J+/+ mouse islets and 38.4 ± 6.0 ng/mg protein for 6Jdb/db mouse islets. C and D: Insulin secretion from KS+/+ and KSdb/db mouse islets normalized to islet protein content (C) or islet insulin content (D). The insulin content was 14.1 ± 1.1 ng/mg protein for KS+/+ mouse islets and 13.8 ± 1.0 ng/mg protein for KSdb/db mouse islets. E–J: Area under the curve (AUC) quantification of the insulin secreted at stimulatory 17 mmol/L glucose over insulin secreted at basal 3 mmol/L glucose. AUC data are total insulin secretion normalized to islet protein content (E) or islet insulin content (H), first-phase insulin secretion normalized to islet protein content (F) or islet insulin content (I), and second-phase insulin secretion normalized to islet protein content (G) or islet insulin content (J). Data are mean ± SE (n ≥5). *P ≤ 0.05 indicates a statistically significant difference vs. respective (WT) controls.
Discussion
Changes in the β-cell biology response to artificially induced insulin resistance was first observed 50 years ago (34) and then later in obese diabetic db/db mice (28). Since, the focus has been on the marked reduction in β-granules and interpreted to imply a persistent defect in insulin secretory capacity. Insulin production has also been presumed defective in insulin resistant obesity-linked type 2 diabetes (3,35). The current study suggests an alternative interpretation linking obesity/insulin resistance–driven changes in β-cell biology to a marked increase in (pro)insulin production. The whole ultrastructure of β-cells is dramatically altered to adapt to insulin biosynthesis rather than to insulin storage. This was especially true in KSdb/db mice, that despite having a reduced β-cell mass (13), continued to synthesize proinsulin at a remarkably high rate. As such, β-cell secretory capacity arguably is not compromised in obesity/early type 2 diabetes; rather, β-cells are synthesizing and rapidly secreting (pro)insulin at an extraordinarily high rate in a valiant attempt to meet the higher metabolic demand.
The predominant control of proinsulin biosynthesis is mediated at the translational level (15,30,36,37), as reiterated in the current study, with a marked increase in proinsulin biosynthesis in response to glucose but little change in preproinsulin mRNA levels. This specific translational regulation also applies to most other β-granule proteins and is the basis for controlling β-granule biogenesis in β-cells (15,38). But considering that the whole biosynthetic machinery of the β-cell’s secretory pathway has adapted to cater to increased insulin demand in obese db/db mice, there are undoubtedly other mechanisms involved to promote RER and Golgi apparatus expansion with the accompanying increases in vesicular trafficking. Part of this includes an adaptive UPR, as indicated by increased expression of the ER chaperone BiP. But, because of a lack of PERK phosphorylation and CHOP expression, there was no indication of this UPR developing into deleterious ER stress. Moreover, an ER stress response would compromise proinsulin biosynthesis (31,32), but the current study found the contrary, with islet β-cells of obese db/db mice producing large quantities of (pro)insulin.
The chronic hyperinsulinemia in obese db/db mouse β-cells indicates that most (pro)insulin produced is directed for rapid secretion. This was consistent with the pool of mature β-granules being significantly depleted and the numbers of immature β-granules, which are also quite capable of undergoing regulated exocytosis, contrastingly increased (39). Such increased β-granule biogenesis and trafficking necessitates a provision of membrane bilayers to generate more β-granule membranes. The appearance of MVBs in db/db mouse β-cells likely reflected this. Although MVBs can be involved in degradation mechanisms in late endosomal compartments, they are also considered centers of membrane recycling (40). In the current study, the MVB abundance in obese β-cells is consistent with a need for continuous membrane redistribution to enable the marked increase in (pro)insulin production and β-granule biogenesis and secretion in response to the obese/insulin resistant environment. The 3D view of an MVB indicated distinct tubular and microvesicle structures of each membrane bilayer, suggesting that they likely have different phospholipid composition. It is tempting to speculate that each distinctive MVB membrane might be recycled to particular organellar compartments of the β-cell, but this will need substantiating experimentally.
Rates of mitochondrial oxidation in the normal β-cells parallel fluctuations in glucose concentration and are critical for generating secondary signals that control proinsulin biosynthesis and insulin secretion (29). Alterations in metabolic signaling mechanisms are considered a root cause of insulin secretory dysfunction in type 2 diabetes (2) as well as of decreased insulin secretory capacity (3,35). Indeed, mitochondria dysfunction observed in 6Jdb/db mouse islets correlated with increased basal insulin secretion and a blunted response to glucose (2). However, the marked increase in insulin production and associated changes in the obese β-cell’s secretory pathway ultrastructure would also make a significant contribution to the insulin secretory dysfunction. The rapid secretion of newly synthesized (pro)insulin depletes the mature β-granule pool compromising normal regulated insulin to increase basal insulin secretion and blunt the first-phase insulin secretory response. Likewise, increased proinsulin:insulin ratios in db/db islet β-cells is likely due to newly synthesized proinsulin not being retained long enough in a β-granule compartment of the β-cell for it to be completely processed (41). However, despite the marked increase in (pro)insulin traversing the β-cell secretory pathway, it is unlikely that this secretory dysfunction is a result of a shift from the regulated to a constitutive secretory pathway. Certain unusual circumstances [e.g., for certain mutant proinsulins or with insulinoma cells (42,43)] show that proinsulin can be mistargeted to the constitutive secretory pathway, which results in as much as 40% of the proinsulin being unprocessed (42,43) when normally the process is >99% efficient (39). In the current study, although the proinsulin:insulin ratios were significantly increased in 6Jdb/db and KSdb/db mouse islets, >97% of proinsulin was still processed (Supplementary Fig. 5B). As such, it seems unlikely that increased constitutive (pro)insulin secretion contributes to the secretory dysfunction. Rather, to get such efficient processing in db/db islet β-cells, the newly synthesized proinsulin should be retained in the β-cell’s regulated pathway, and a left shift in glucose sensitivity, highlighted by the increased mitochondrial glucose oxidation in db/db islets, better accounts for increased basal insulin secretion. Also of note, most newly synthesized (pro)insulin in normal β-cells is secreted in the first phase (44), but because db/db islet β-cells are continually secreting (pro)insulin soon after initial synthesis and internal stores of insulin are depleted, the second phase of glucose-induced insulin secretion would be expected to contain more newly synthesized (pro)insulin.
The observation that the change in β-cell biology in db/db islets is reversible emphasizes that upregulation of the (pro)insulin biosynthetic secretory pathway comes at the price of insulin secretory dysfunction. Returning glucose levels to normal retracted the expansion of the RER and Golgi apparatus, rates of proinsulin biosynthesis slowed toward normal, and db/db islet β-cells were repopulated with mature β-granules. This return to a more typical β-cell morphology amounted to a correction of the proinsulin:insulin ratio, decreased basal insulin release, and normal biphasic glucose-induced insulin secretion. It occurred in a relatively short (≤12 h) time frame, which underlines an adaptive plasticity of the β-cell as dynamic and responsive to meet the in vivo demand for insulin. However, in obesity, a high demand for insulin is continual, and β-cell adaptive plasticity only goes so far. Although the β-cell adapts to markedly increased insulin production and secretion, it eventually becomes futile in the face of chronic insulin resistance. With prolonged hyperglycemia, the β-cells eventually fail, succumbing to exhaustion and several metabolic stresses (including oxidative and inflammatory stresses but not ER stress) that ultimately lead to β-cell loss and type 2 diabetes (4).
Dynamic β-cell adaptive plasticity is consistent with the concept of applying transient β-cell rest to restore normal insulin secretory capacity and function, for which there is precedence (7,45–47). When demand for insulin is diminished and/or elevated glucose levels are normalized, β-cell insulin stores can be replenished, which consequently enables a return to normal endogenously regulated insulin secretion patterns. However, the current study is limited by its in vitro treatment. Thus, follow-up preclinical studies are needed to examine whether applying β-cell rest in vivo in models of obesity/insulin resistance has a similar beneficial effect. Then, by taking advantage of the β-cell’s adaptive plasticity, refinement of therapeutic strategies for the treatment of type 2 diabetes may emerge.
Supplementary Material
Article Information
Acknowledgments. The authors dedicate this study to the memory of Donald F. Steiner (1930–2014) at The University of Chicago, a pioneer in the cell biology and biochemistry of proinsulin production and processing. His insight and advice were invaluable to aspects of this work, and he will be sorely missed.
Funding. This research was supported by grants from the National Institutes of Health (DK-048280 to P.A., DK-050610 to C.J.R.), the Diabetes and Research Training Center at The University of Chicago (DK-020595), and the Brehm Coalition for Discovery in Diabetes (to P.A. and C.J.R.) and by the Kovler Diabetes Center at The University of Chicago.
Duality of Interest. No potential conflicts of interest relevant to this article were reported.
Author Contributions. C.A. contributed to the study concept and design, islet and physiology studies, data analysis and interpretation, and writing and editing of the manuscript. B.B.B. contributed to the study concept and design, islet and physiology studies, EM image capture and quantification, data analysis and interpretation, and writing and editing of the manuscript. Y.U. contributed to the islet and physiology studies. P.C.M. contributed to the islet and physiology studies and fluorescent microscopy analysis. B.P. and S.R. contributed to the EM image quantification. O.S.R., A.B.N., and B.J.M. contributed to the EM tomography and 3D reconstruction. L.H. and P.A. contributed to the fluorescent microscopy analysis. J.A. contributed to the EM image capture. C.J.R. contributed to the study concept and design, data analysis and interpretation, and writing and editing of the manuscript. C.J.R. is the guarantor of this work and, as such, takes responsibility for the integrity of the data and the accuracy of the data analysis.
Footnotes
This article contains Supplementary Data and a video online at http://diabetes.diabetesjournals.org/lookup/suppl/doi:10.2337/db15-0792/-/DC1.
See accompanying article, p. 352.
References
- 1.Rhodes CJ. Type 2 diabetes-a matter of β-cell life and death? Science 2005;307:380–384 [DOI] [PubMed] [Google Scholar]
- 2.Prentki M, Nolan CJ. Islet beta cell failure in type 2 diabetes. J Clin Invest 2006;116:1802–1812 [DOI] [PMC free article] [PubMed] [Google Scholar]
- 3.Kahn SE, Zraika S, Utzschneider KM, Hull RL. The beta cell lesion in type 2 diabetes: there has to be a primary functional abnormality. Diabetologia 2009;52:1003–1012 [DOI] [PMC free article] [PubMed] [Google Scholar]
- 4.Halban PA, Polonsky KS, Bowden DW, et al. β-cell failure in type 2 diabetes: postulated mechanisms and prospects for prevention and treatment. Diabetes Care 2014;37:1751–1758 [DOI] [PMC free article] [PubMed] [Google Scholar]
- 5.MacLean N, Ogilvie RF. Quantitative estimation of the pancreatic islet tissue in diabetic subjects. Diabetes 1955;4:367–376 [DOI] [PubMed] [Google Scholar]
- 6.Leahy JL, Hirsch IB, Peterson KA, Schneider D. Targeting beta-cell function early in the course of therapy for type 2 diabetes mellitus. J Clin Endocrinol Metab 2010;95:4206–4216 [DOI] [PubMed] [Google Scholar]
- 7.Wajchenberg BL. beta-cell failure in diabetes and preservation by clinical treatment. Endocr Rev 2007;28:187–218 [DOI] [PubMed] [Google Scholar]
- 8.Giddings SJ, Orland MJ, Weir GC, Bonner-Weir S, Permutt MA. Impaired insulin biosynthetic capacity in a rat model for non-insulin-dependent diabetes. Studies with dexamethasone. Diabetes 1985;34:235–240 [DOI] [PubMed] [Google Scholar]
- 9.Orland MJ, Chyn R, Permutt MA. Modulation of proinsulin messenger RNA after partial pancreatectomy in rats. Relationships to glucose homeostasis. J Clin Invest 1985;75:2047–2055 [DOI] [PMC free article] [PubMed] [Google Scholar]
- 10.Orland MJ, Permutt MA. Quantitative analysis of pancreatic proinsulin mRNA in genetically diabetic (db/db) mice. Diabetes 1987;36:341–347 [DOI] [PubMed] [Google Scholar]
- 11.Orland MJ, Permutt MA. Genetic susceptibility to diabetes in inbred strains of mice: measurements of proinsulin mRNA and response to dexamethasone. Diabetologia 1987;30:934–939 [DOI] [PubMed] [Google Scholar]
- 12.Fontés G, Zarrouki B, Hagman DK, et al. Glucolipotoxicity age-dependently impairs beta cell function in rats despite a marked increase in beta cell mass. Diabetologia 2010;53:2369–2379 [DOI] [PMC free article] [PubMed] [Google Scholar]
- 13.Puff R, Dames P, Weise M, et al. Reduced proliferation and a high apoptotic frequency of pancreatic beta cells contribute to genetically-determined diabetes susceptibility of db/db BKS mice. Horm Metab Res 2011;43:306–311 [DOI] [PubMed] [Google Scholar]
- 14.Harris RBS, Mitchell TD, Yan X, Simpson JS, Redmann SMJ Jr. Metabolic responses to leptin in obese db/db mice are strain dependent. Am J Physiol Regul Integr Comp Physiol 2001;281:R115–R132 [DOI] [PubMed] [Google Scholar]
- 15.Uchizono Y, Alarcón C, Wicksteed BL, Marsh BJ, Rhodes CJ. The balance between proinsulin biosynthesis and insulin secretion: where can imbalance lead? Diabetes Obes Metab 2007;9(Suppl. 2):56–66 [DOI] [PubMed] [Google Scholar]
- 16.Yaekura K, Julyan R, Wicksteed BL, et al. Insulin secretory deficiency and glucose intolerance in Rab3A null mice. J Biol Chem 2003;278:9715–9721 [DOI] [PubMed] [Google Scholar]
- 17.Gregg BE, Moore PC, Demozay D, et al. Formation of a human β-cell population within pancreatic islets is set early in life. J Clin Endocrinol Metab 2012;97:3197–3206 [DOI] [PMC free article] [PubMed] [Google Scholar]
- 18.Tsunekawa S, Demozay D, Briaud I, et al. FoxO feedback control of basal IRS-2 expression in pancreatic β-cells is distinct from that in hepatocytes. Diabetes 2011;60:2883–2891 [DOI] [PMC free article] [PubMed] [Google Scholar]
- 19.Marsh BJ, Soden C, Alarcón C, et al. Regulated autophagy controls hormone content in secretory-deficient pancreatic endocrine β-cells. Mol Endocrinol 2007;21:2255–2269 [DOI] [PubMed] [Google Scholar]
- 20.Kremer JR, Mastronarde DN, McIntosh JR. Computer visualization of three-dimensional image data using IMOD. J Struct Biol 1996;116:71–76 [DOI] [PubMed] [Google Scholar]
- 21.Noske AB, Costin AJ, Morgan GP, Marsh BJ. Expedited approaches to whole cell electron tomography and organelle mark-up in situ in high-pressure frozen pancreatic islets. J Struct Biol 2008;161:298–313 [DOI] [PMC free article] [PubMed] [Google Scholar]
- 22.Alarcón C, Lincoln B, Rhodes CJ. The biosynthesis of the subtilisin-related proprotein convertase PC3, but no that of the PC2 convertase, is regulated by glucose in parallel to proinsulin biosynthesis in rat pancreatic islets. J Biol Chem 1993;268:4276–4280 [PubMed] [Google Scholar]
- 23.Lingohr MK, Briaud I, Dickson LM, et al. Specific regulation of IRS-2 expression by glucose in rat primary pancreatic islet beta-cells. J Biol Chem 2006;281:15884–15892 [DOI] [PubMed] [Google Scholar]
- 24.Donelan MJ, Morfini G, Julyan R, et al. Ca2+-dependent dephosphorylation of kinesin heavy chain on beta-granules in pancreatic beta-cells. Implications for regulated beta-granule transport and insulin exocytosis. J Biol Chem 2002;277:24232–24242 [DOI] [PubMed] [Google Scholar]
- 25.Hang Y, Stein R. MafA and MafB activity in pancreatic β cells. Trends Endocrinol Metab 2011;22:364–373 [DOI] [PMC free article] [PubMed] [Google Scholar]
- 26.Orci L. The insulin factory: a tour of the plant surroundings and a visit to the assembly line. The Minkowski lecture 1973 revisited. Diabetologia 1985;28:528–546 [DOI] [PubMed] [Google Scholar]
- 27.Haataja L, Snapp E, Wright J, et al. Proinsulin intermolecular interactions during secretory trafficking in pancreatic β cells. J Biol Chem 2013;288:1896–1906 [DOI] [PMC free article] [PubMed] [Google Scholar]
- 28.Like AA, Chick WL. Studies in the diabetic mutant mouse. II. Electron microscopy of pancreatic islets. Diabetologia 1970;6:216–242 [DOI] [PubMed] [Google Scholar]
- 29.Ashcroft SJH. Glucoreceptor mechanisms and the control of insulin release and biosynthesis. Diabetologia 1980;18:5–15 [DOI] [PubMed] [Google Scholar]
- 30.Wicksteed BL, Alarcon C, Briaud I, Dickson L, Lingohr MK, Rhodes CJ. Glucose-induced translational control of proinsulin biosynthesis is proportional to preproinsulin mRNA levels in islet beta-cells but not regulated via a positive feedback of secreted insulin. J Biol Chem 2003;278:42080–42090 [DOI] [PubMed] [Google Scholar]
- 31.Eizirik DL, Cardozo AK, Cnop M. The role for endoplasmic reticulum stress in diabetes mellitus. Endocr Rev 2008;29:42–61 [DOI] [PubMed] [Google Scholar]
- 32.Wang S, Kaufman RJ. The impact of the unfolded protein response on human disease. J Cell Biol 2012;197:857–867 [DOI] [PMC free article] [PubMed] [Google Scholar]
- 33.Yusta B, Baggio LL, Estall JL, et al. GLP-1 receptor activation improves beta cell function and survival following induction of endoplasmic reticulum stress. Cell Metab 2006;4:391–406 [DOI] [PubMed] [Google Scholar]
- 34.Logothetopoulos J, Davidson JK, Haist RE, Best CH. Degranulation of beta cells and loss of pancreatic insulin after infusions of insulin antibody or glucose. Diabetes 1965;14:493–500 [DOI] [PubMed] [Google Scholar]
- 35.Poitout V, Robertson RP. Glucolipotoxicity: fuel excess and beta-cell dysfunction. Endocr Rev 2008;29:351–366 [DOI] [PMC free article] [PubMed] [Google Scholar]
- 36.Itoh N, Okamoto H. Translational control of proinsulin synthesis by glucose. Nature 1980;283:100–102 [DOI] [PubMed] [Google Scholar]
- 37.Wicksteed B, Uchizono Y, Alarcon C, McCuaig JF, Shalev A, Rhodes CJ. A cis-element in the 5′ untranslated region of the preproinsulin mRNA (ppIGE) is required for glucose regulation of proinsulin translation. Cell Metab 2007;5:221–227 [DOI] [PubMed] [Google Scholar]
- 38.Guest PC, Bailyes EM, Rutherford NG, Hutton JC. Insulin secretory granule biogenesis. Co-ordinate regulation of the biosynthesis of the majority of constituent proteins. Biochem J 1991;274:73–78 [DOI] [PMC free article] [PubMed] [Google Scholar]
- 39.Rhodes CJ, Halban PA. Newly synthesized proinsulin/insulin and stored insulin are released from pancreatic B cells predominantly via a regulated, rather than a constitutive, pathway. J Cell Biol 1987;105:145–153 [DOI] [PMC free article] [PubMed] [Google Scholar]
- 40.Woodman PG, Futter CE. Multivesicular bodies: co-ordinated progression to maturity. Curr Opin Cell Biol 2008;20:408–414 [DOI] [PMC free article] [PubMed] [Google Scholar]
- 41.Rhodes CJ, Alarcón C. What β-cell defect could lead to hyperproinsulinemia in NIDDM? Some clues from recent advances made in understanding the proinsulin-processing mechanism. Diabetes 1994;43:511–517 [DOI] [PubMed] [Google Scholar]
- 42.Gross DJ, Halban PA, Kahn CR, Weir GC, Villa-Komaroff L. Partial diversion of a mutant proinsulin (B10 aspartic acid) from the regulated to the constitutive secretory pathway in transfected AtT-20 cells. Proc Natl Acad Sci U S A 1989;86:4107–4111 [DOI] [PMC free article] [PubMed] [Google Scholar]
- 43.Gold G, Gishizky ML, Chick WL, Grodsky GM. Contrasting patterns of insulin biosynthesis, compartmental storage, and secretion. Rat tumor versus islet cells. Diabetes 1984;33:556–561 [DOI] [PubMed] [Google Scholar]
- 44.Sando H, Grodsky GM. Dynamic synthesis and release of insulin and proinsulin from perifused islets. Diabetes 1973;22:354–360 [DOI] [PubMed] [Google Scholar]
- 45.Song SH, Rhodes CJ, Veldhuis JD, Butler PC. Diazoxide attenuates glucose-induced defects in first-phase insulin release and pulsatile insulin secretion in human islets. Endocrinology 2003;144:3399–3405 [DOI] [PubMed] [Google Scholar]
- 46.Grill V, Björklund A. Impact of metabolic abnormalities for beta cell function: clinical significance and underlying mechanisms. Mol Cell Endocrinol 2009;297:86–92 [DOI] [PubMed] [Google Scholar]
- 47.Greenwood RH, Mahler RF, Hales CN. Improvement in insulin secretion in diabetes after diazoxide. Lancet 1976;1:444–447 [DOI] [PubMed] [Google Scholar]
Associated Data
This section collects any data citations, data availability statements, or supplementary materials included in this article.


