Significance
Epigenetic control by methylation of histones is essential in development. Loss of regulation of methylation pathways is involved in developmental disorders and oncogenesis. Despite interest in NSD2, there have been no selective inhibitors reported. Analogs designed to mimic the NSD2 transition state structure are potential enzyme inhibitors. A combination of experimental kinetic isotope effects and quantum chemistry was used to define the subangstrom details of reaction chemistry at the transition state of NSD2. Electrostatic potential maps of reactants and transition states provide a high-resolution map of reaction chemistry and a blueprint for design of transition state analogs for this mechanism of epigenetic regulation.
Keywords: enzyme mechanism, transition state structure, histone methylation, kinetic isotope effects
Abstract
Nuclear receptor SET domain containing protein 2 (NSD2) catalyzes the methylation of histone H3 lysine 36 (H3K36). It is a determinant in Wolf–Hirschhorn syndrome and is overexpressed in human multiple myeloma. Despite the relevance of NSD2 to cancer, there are no potent, selective inhibitors of this enzyme reported. Here, a combination of kinetic isotope effect measurements and quantum chemical modeling was used to provide subangstrom details of the transition state structure for NSD2 enzymatic activity. Kinetic isotope effects were measured for the methylation of isolated HeLa cell nucleosomes by NSD2. NSD2 preferentially catalyzes the dimethylation of H3K36 along with a reduced preference for H3K36 monomethylation. Primary Me-14C and 36S and secondary Me-3H3, Me-2H3, 5′-14C, and 5′-3H2 kinetic isotope effects were measured for the methylation of H3K36 using specifically labeled S-adenosyl-l-methionine. The intrinsic kinetic isotope effects were used as boundary constraints for quantum mechanical calculations for the NSD2 transition state. The experimental and calculated kinetic isotope effects are consistent with an SN2 chemical mechanism with methyl transfer as the first irreversible chemical step in the reaction mechanism. The transition state is a late, asymmetric nucleophilic displacement with bond separation from the leaving group at (2.53 Å) and bond making to the attacking nucleophile (2.10 Å) advanced at the transition state. The transition state structure can be represented in a molecular electrostatic potential map to guide the design of inhibitors that mimic the transition state geometry and charge.
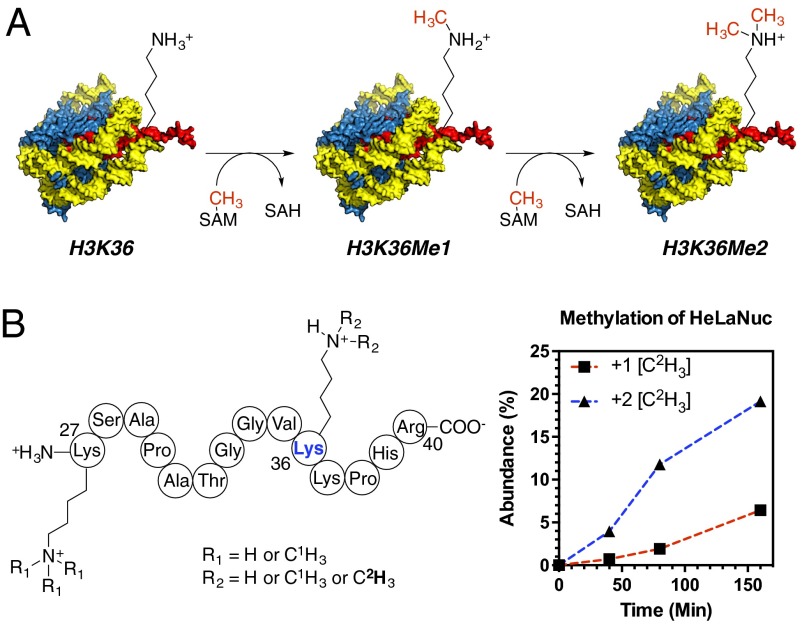
Histone lysine methylation is an essential posttranslational modification for transcriptional regulation, DNA damage response, and chromatin regulation (1, 2). Methyl groups (Me, CH3) are installed on lysine residues by protein lysine methyltransferase enzymes (PKMTs), the majority of which, in humans, contain a catalytic SET domain (3). The conserved SET domain catalyzes the transfer of between one to three CH3 from S-adenosyl-l-methionine (SAM) onto the ε-amino group of lysine residues (Fig. 1) producing monomethyl, dimethyl, or trimethyl lysine derivatives (KMe1, KMe2, and KMe3, respectively) (3), in a reaction that involves first deprotonation of the lysine, and finally transfer of the methyl group (4, 5).
Fig. 1.
NSD2-catalyzed methylation of histone H3 lysine 36 (H3K36). (A) The general reaction catalyzed by NSD2 showing both monomethylation and dimethylation of H3K36. (B) Product distribution for methylation of HeLaNuc with [Me-2H3]SAM. Products are shown for the histone H3 (K27–R40) peptide resulting from Arg-C digestion. NSD2 displays a preference for dimethylation H3K36.
Histone lysine Me marks can signal either transcriptional activation or repression depending on which lysine residue is methylated and the number of transferred Me groups (2). For example histone H3 lysine 27 trimethylation is a signal for transcriptional repression (6), where histone H3 lysine 4 and histone H3 lysine 36 Me marks are found in actively transcribed loci (7). As a result, misregulation of PKMT expression is often associated with cancer development and other disease states (8). Deletion of the gene encoding the histone H3K36 dimethyltransferase enzyme nuclear receptor binding SET domain protein 2 (NSD2) (also known as WHSC1 or MMSET), specifically, is present in the developmental disorder Wolf–Hirschhorn syndrome (9). By contrast, NSD2 overexpression, as a result of a t(4;14) chromosomal translocation (10), is manifest in 15% of multiple myeloma cases and has been identified in other cancers (11–13). NSD2 catalyzes the monomethylation and dimethylation of histone H3K36 in vivo (11), although other CH3-transfer specificities have also been reported in studies using histone protein or histone tail peptide as substrate analogs (14–16). Studies using isolated or recombinant nucleosome as physiologically relevant substrates detected H3K36Me1 and H3K36Me2 as the exclusive products. Thus, the nature of the substrate can influence NSD2 specificity (11, 17). Substrate specificity is also influenced by the presence of a C-terminal basic post-SET extension found in NSD family methyltransferases. NSD2 mutants lacking this basic post-SET extension are unable to recognize nucleosome as substrate (18). The H3K36Me2 marks introduced by NSD2 are normally concentrated in the 5′ end of actively transcribed genes (7), and overexpression results in global increases in H3K36Me2 throughout gene bodies, resulting in aberrant transcription of multiple oncogenes (11). Histone methylation is a reversible posttranslational modification, thus, inhibiting the catalytic activity of NSD2 is an attractive strategy for the treatment of multiple myeloma and other cancers.
Designing analogs that mimic the geometry and charge distribution of the transition state (TS) of enzyme-catalyzed reactions is a powerful approach for enzyme inhibition (19, 20); however, this requires a detailed model of the enzyme TS. TS models for a number of PKMT enzymes, including human SET8 (21), and SET7/9 (4, 22), based on quantum mechanical (QM)/molecular mechanical (MM) calculation of the enzyme chemistry, show substantial variability in the predicted TS geometry of PKMT. However, these models have not been verified experimentally. Detailed information about TS structure can be obtained from the measurement of kinetic isotope effects (KIEs) (23), which result from changes in the bond vibrational environment for atoms of the reactants free in solution and at the TS (23). The measurement of multiple KIEs combined with quantum chemical calculations allow for interrogation of TS structure (19, 20, 24). Here, we apply this approach for the NSD2-catalyzed methylation of histone H3K36. Multiple experimental KIEs for the methylation of HeLa cell nucleosome (HeLaNuc) H3K36 by the SET domain of NSD2 were measured, and the KIEs were used to evaluate quantum chemical models of the CH3-transfer TS.
Results and Discussion
NSD2 Dimethylates Histone H3 at Lysine 36 of HeLaNucs.
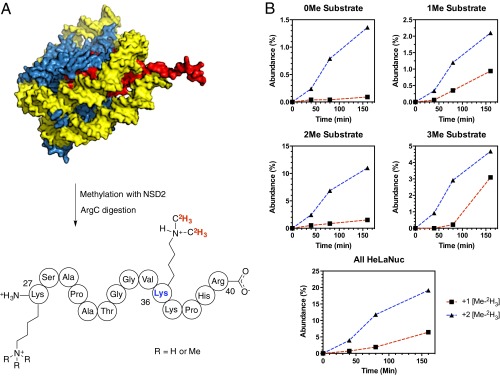
The substrate and product specificity of NSD2 is dependent on both the nature of the substrate and the NSD2 construct used (17, 18). We analyzed the product distribution using extracted HeLaNuc as a mimic of the native substrate and a NSD2 construct containing the C-terminal SET domain and basic post-SET extensions (residues 980–1365). HeLaNuc contain a heterogeneous mixture of preexisting methyl marks (25). The installation of new methyl marks was tracked using [Me-2H3]SAM and the products monitored by liquid chromatography–mass spectrometry (LC-MS) after protease digestion (Fig. 1). Under these conditions, we observed only monomethylation and dimethylation of histone H3K36 regardless of the preexisting methylation state in the parent nucleosome, consistent with previous reports of wild-type NSD2 specificity (Fig. S1) (11, 17). We also observed no trimethylated H3K36, consistent with reports that SETD2 is the only known human H3 K36 trimethyltransferase (26). These results indicate the specificity of our NSD2 construct was not altered by truncation of the N-terminal domains. These results indicate that the N-terminal domains of NSD2 do not directly affect the enzyme chemistry and, likely, do not affect the TS structure.
Fig. S1.
Analysis of products resulting from the methylation of HeLaNuc catalyzed by NSD2. (A) A diagram showing the H3 peptide containing Lys27-Arg40 resulting from ArgC digestion of HeLaNuc that were methylated by NSD2 in vitro. (B) LC-MS analysis of the products resulting from methylation of HeLaNuc showed only monomethylation and dimethylation of H3K36 for starting peptides containing between zero and three preexisting methyl marks.
Measurement of Intrinsic KIEs and Forward Commitment.
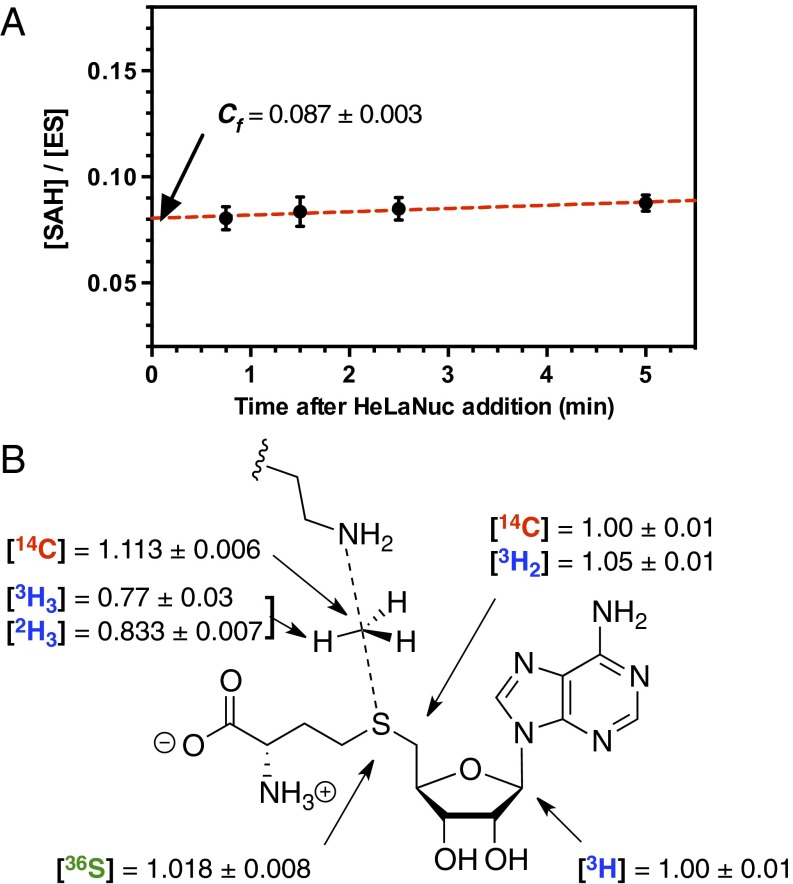
KIEs for methylation of HeLaNuc histone H3K36 by NSD2 were measured using a competitive radiolabel approach. Under these conditions, the observed KIEs on Vmax/KM (V/K) include contributions from all isotopically sensitive steps up to and including the first irreversible reaction, which for PKMT is generally accepted to be CH3-transfer (5). Thus, any events preceding CH3-transfer, including substrate binding and lysine deprotonation, can lead to an observed forward commitment (Cf), which would lower the magnitude of measured KIEs. Cf is a measure of the distribution of enzyme-bound substrate that proceeds to form product rather than equilibrate with free substrate. Using the isotope-trapping method (27), we measured a Cf of 0.087 ± 0.003 for the reaction of SAM with NSD2SET (Fig. 2A). This Cf is relatively low, indicating that events preceding CH3-transfer are not significantly rate limiting, and Eq. 1 can be used to obtain intrinsic KIEs (k) required for TS analysis, where (V/K) is the observed KIE:
| [1] |
Isotopically-labeled SAM for KIE measurements were prepared enzymatically from appropriately labeled ATP or methionine precursors (Table S1). KIEs measured for the atomic positions surrounding the methyl-transfer reaction coordinate are summarized in Table S2 and Fig. 2B. Each KIE was determined under competitive conditions using a “heavy” substrate, bearing a 3H or 14C at the position of interest, and a “light” substrate with a remote radiolabel reporting on the corresponding light isotope at the position of interest. For Me-2H3 and 36S, the heavy substrates also contained a remote 1′-3H or 8-14C label. KIEs were determined from the change of isotope ratio of the unreacted SAM after 15–45% had been consumed. Correcting for Cf gave an intrinsic primary Me-14C KIE of 1.113 ± 0.006, primary 36S KIE of 1.018 ± 0.008, and secondary Me-3H3, 5′-14C, and 5′-3H2 KIEs of 0.77 ± 0.03, 1.00 ± 0.01, and 1.05 ± 0.01, respectively.
Fig. 2.
Determination of intrinsic KIEs and correction for forward commitment factor (Cf). (A) Measurement of Cf by isotope trapping for the methylation of HeLaNuc H3K36 by NSD2. (B) Intrinsic KIE values by atom position after correction for Cf. Errors are reported as the SD of at least six replicates from two independent experiments.
Table S1.
Synthesis of isotopically labeled SAM from labeled ATP and Met
| Labeled SAM product | ATP substrate | Met substrate |
| Me-14C | — | Me-14C |
| Me-3H3 | — | Me-3H3 |
| Me-2H3, 1′-3H | 1′-3H | Me-2H3 |
| Me-2H3 | — | Me-2H3 |
| 5′-14C | 5′-14C | — |
| 5′-3H2 | 5′-3H2 | — |
| 36S, 8-14C | 8-14C | 36S |
| 8-14C | 8-14C | — |
| 1′-3H | 1′-3H | — |
The dash (—) denotes that unlabeled ATP or Met was used.
Table S2.
Summary of experimental and predicted KIEs for H3 K36 methylation catalyzed by NSD2
| SAM substrates | Observed (V/K) KIEs* | Intrinsic KIEs† | Predicted KIEs | ||
| Heavy | Light | (TS1)‡ | (TS2) | ||
| Me-14C | 1′-3H | 1.105 ± 0.004 | 1.113 ± 0.006 | 1.114 | 1.118 |
| Me-3H3 | 8-14C | 0.79 ± 0.03 | 0.77 ± 0.03 | 0.783 | 0.768 |
| Me-2H3, 1′-3H | 8-14C | 0.845 ± 0.006 | 0.833 ± 0.007 | 0.839 | 0.826 |
| 5′-14C | 1′-3H | 0.995 ± 0.009 | 1.00 ± 0.01 | 1.001 | 1.004 |
| 5′-3H2 | 8-14C | 1.05 ± 0.01 | 1.05 ± 0.01 | 1.137 | 1.057 |
| 36S, 8-14C | 1′-3H | 1.017 ± 0.007 | 1.018 ± 0.008 | 1.020 | 1.022 |
| 1′-3H | 8-14C | 1.00 ± 0.01 | 1.00 ± 0.01 | ||
Observed KIE are reported as the mean ± SD from at least six replicates from two independent experiments.
Intrinsic KIEs are calculated from observed (V/K) KIEs by correcting for a Cf = 0.087 ± 0.003.
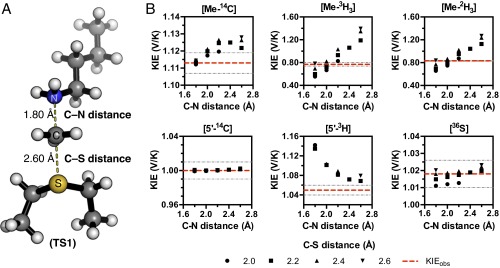
Predicted KIEs for TS1 (Fig. 3B) best-matching intrinsic KIEs with d1 = 1.8 Å and d2 = 2.6 Å.
A large primary 14C KIE is consistent with an SN2 mechanism where the CH3-transfer is largely rate limiting. The magnitude of the primary KIE of the transferring methyl group for SN2 reaction mechanisms is proportional to the symmetry of the TS structure, with the largest isotope effects expected when bond order to the nucleophile and leaving group are equal (28). A large inverse α-secondary 3H KIE for the methyl group hydrogen of 0.77 ± 0.03 suggests the hydrogen vibrational modes are constrained at the TS relative to the ground state. To confirm the magnitude of this isotope effect, we also measured the α-secondary Me-2H3 KIE. The intrinsic Me-2H3 KIE of 0.833 ± 0.007 is in good agreement with the Me-3H3 isotope effect given the difference in the reduced mass of each isotope (29). Such large inverse α-secondary KIEs have previously been observed for the methylation of catechol substrates by catechol O-methyltransferase (COMT) (30, 31). In that case, the large inverse KIE was attributed to compression of the methyl donor–acceptor distance at the TS (30). However, QM/MM calculations suggest that such compression is not required to explain the observed inverse KIEs (32, 33).
Computational Models of the NSD2 TS.
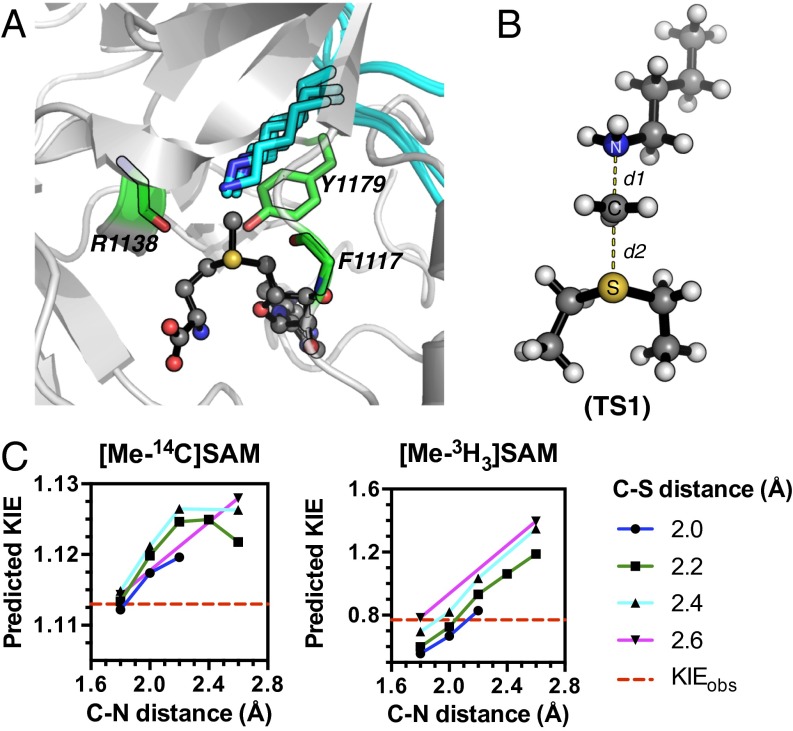
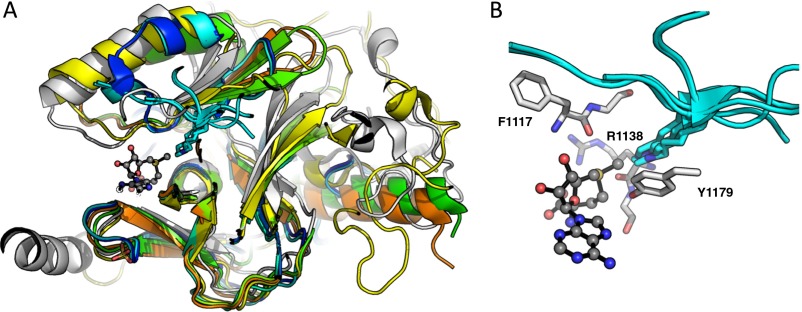
The TS structure for methylation of H3K36 by NSD2 was modeled using the intrinsic KIEs as constraints. The reactant-state input for TS analysis was derived from the conformation of SAM in the crystal structure of NSD1 [Protein Data Bank (PDB) ID code 3OOI] (34), as no structure of NSD2 was available. The catalytic SET domain of NSD1 and NSD2 are highly homologous containing 79% sequence identity. To model the lysine position, the SET domain of NSD1 was overlaid with those of SET7/9, SET8, and PIM5 bound to their corresponding peptide substrates (Fig. 3A and Fig. S2) (35–37). The average lysine geometry was used to generate a simplified TS model (TS1 in Fig. 3B).
Fig. 3.
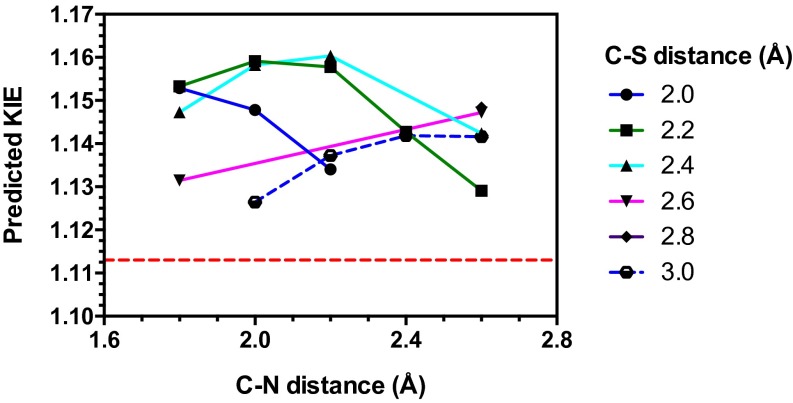
Theoretical TS model for NSD2 methylation of H3K36. (A) A prediction of the lysine substrate geometry from the structure NSD1 overlaid with the with peptide substrates of SET7/9 (PDB ID codes 1XQH and 2F69) SET8 (PDB ID codes 3F9W and 3F9Y), and PIM5 (PDB ID code 1PEG) shown in cyan. (B) A simplified TS model for the NSD2 methyl-transfer reaction derived from the SAM and lysine geometry. (C) KIEs predicted for TS1 at different fixed C–N and C–S distances.
Fig. S2.
Orientation of SAM and lysine in the active site of SET domain PKMT. (A) Overlay of the structures of SET7/9 (blue, PDB ID code 1XQH, and cyan, PDB ID code 2F69) SET8 (green, PDB ID code 3F9W, and orange, PDB ID code 3F9Y), and PIM5 (yellow, PDB ID code 1PEG) bound to their respective peptide substrates (shown in cyan), and NSD1 (white, PDB ID code 3OOI) bound to SAM. (B) Magnified view of the NSD1 set domain highlighting the conserved amino acids included in TS2.
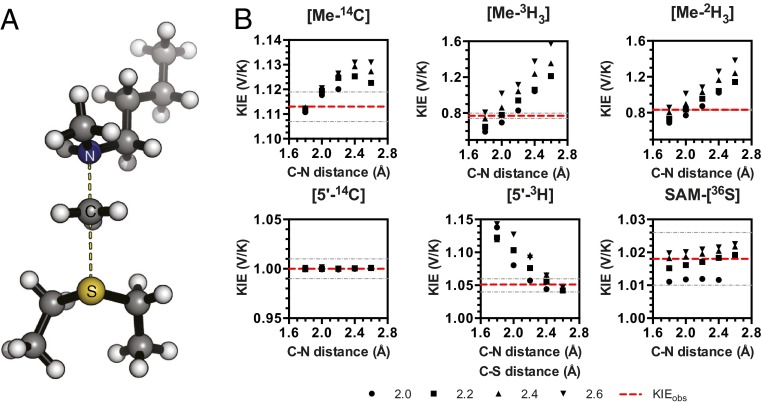
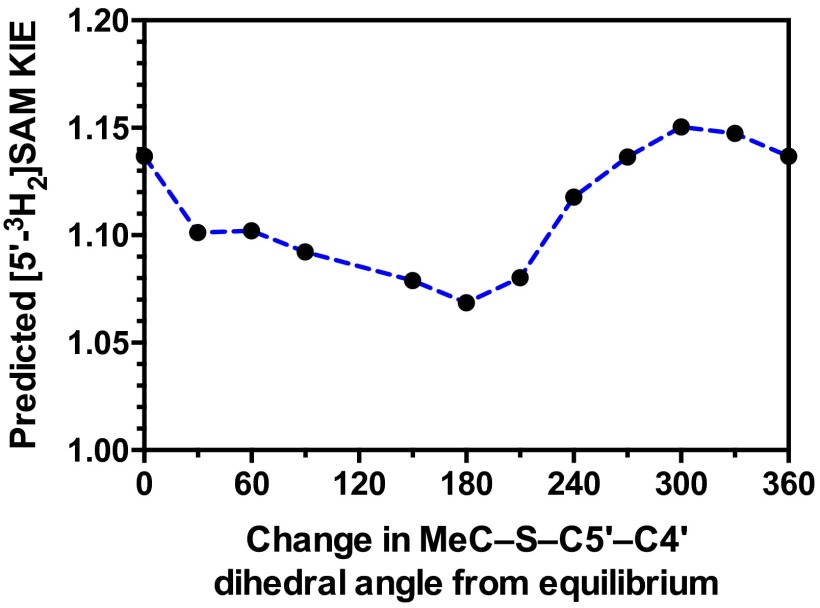
The TS geometry for NSD2 can be described by a combination of the C–N and C–S distances, d1 and d2, shown in Fig. 3B. A series of TS structures with fixed d1 and d2 distances were calculated at the m062x/6-31G* level of theory, as implemented in Gaussian 09 (38). No other constraints on the TS geometry or the S–C–N bond angle were imposed. Theoretical isotope effects for each geometry were predicted from the scaled vibrational frequencies using the program ISOEFF98 (Fig. 3C and Fig. S3) (39). Because NSD2 catalyzes both the monomethylation and dimethylation of H3K36, the observed KIEs could arise from the TS for either the first or second methylation reaction or a combination of the two. The same calculations were performed using a TS model for the second methylation reaction (Fig. S4). TS models for both the first and second methylation reaction catalyzed by NSD2 had highly similar predicted KIEs for all geometries tested, so for the sake of simplicity we will focus our discussion on the TS for the first methylation. In general, the predicted Me-14C KIEs were larger (>1.12) for TS geometries with more symmetrical bond order to both the sulfur leaving group and nitrogen nucleophile, with a later, asymmetric TS matching the observed KIE of 1.113 (Fig. 3C). A number of TS geometries with compressed donor–acceptor distances predict inverse Me-3H3 KIEs but gave poor agreement with the Me-14C KIE. Instead, the predicted Me-3H3 KIEs matched most optimally to TS geometries with greater bond order to the lysine nitrogen. Predicted 36S KIEs are also consistent for a product-like TS geometry with substantial loss of bond order to the transferring CH3 group at the TS. The closest match to all intrinsic KIEs was observed with d1 and d2 fixed at 1.8 and 2.6 Å, respectively, corresponding to a late product-like TS geometry; however, no TS geometry was able to reproduce the observed 5′-3H2 KIE (Figs. S3 and S4). This KIE is highly dependent on the bound SAM geometry and was found to vary substantially as the result of rotation around the C5′–S bond in our simplified TS model (Fig. S5).
Fig. S3.
Theoretical structure of the TS for NSD2 methylation of H3K36. (A) A simplified TS model calculated for the NSD2 methyl-transfer reaction using M062x/6-31G*. (B) Relationships between TS geometry and predicted KIEs. KIEs calculated using the program ISOEFF98 are plotted at varying C–N and C–S distances. Observed KIEs are shown as a red line with the SD shown in gray.
Fig. S4.
Theoretical structure of the TS for NSD2 methylation of H3K36Me1. (A) A simplified TS model calculated for the NSD2 methyl-transfer reaction using M062x/6-31G*. (B) Relationships between TS geometry and predicted KIEs. KIEs calculated using the program ISOEFF98 are plotted at varying C–N and C–S distances. Observed KIEs are shown as a red line with the SD shown in gray.
Fig. S5.
Effect of MeC–S–C5′-C4′ dihedral angle on predicted 5′-3H2 KIEs. KIEs were calculated for TS1 where the MeC–S–C5′-C4′ dihedral angle is rotated from equilibrium.
Previous work indicates QM tunneling can contribute to the magnitude of heavy-atom KIEs (40, 41). To assess the possibility that QM tunneling contributes to our observed Me-14C KIE, we calculated predicted Me-14C KIEs while including a correction for carbon tunneling. For our system, the magnitude of predicted KIEs including tunneling are larger than the intrinsic value for all TS geometries tested (Fig. S6), and, as a result, we did not include a tunneling correction in our final TS predictions.
Fig. S6.
Predicted Me-14C KIEs including contributions from QM tunneling. Predicted KIEs were calculated using the program ISOEFF98 for TS1 with fixed C–S and C–N distances, and including a correction for QM tunneling. The intrinsic Me-14C KIE is shown as a dashed line (red).
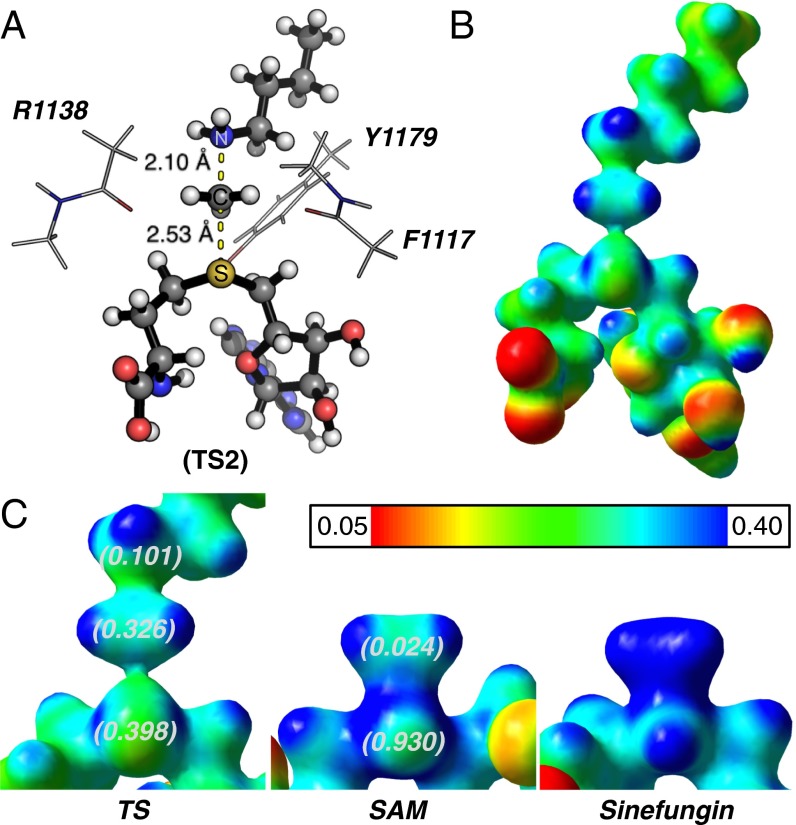
Secondary hydrogen KIEs can also be influenced by geometric and electronic constraints imposed by the enzyme that are not reproduced using a simplified TS model. Previous QM/MM studies of COMT have shown that increasing the number of atoms included in the QM region impacts the predicted donor–acceptor geometry in the bound complex of COMT, SAM, and catechol (42). Thus, it is possible that including atoms from amino acids from NSD2 active-site residues in our QM calculation will influence the predicted KIEs. Here, we included the backbone carbonyls of R1138 and F1117 and side chain of Y1179, whose positions are conserved among SET domain containing PKMT, in our TS calculation (Fig. 4A) (43). The corresponding residues in SET7/9 are proposed to interact with the hydrogen atoms on the transferring methyl group (43, 44). Including these interactions in our model, we observed a match to all intrinsic KIEs with d2 fixed at 2.53 Å and d1 at 2.10 Å (TS2 in Fig. 4A). The predicted Me-3H3, Me-2H3, and 5′-3H2 KIEs were more inverse, or less normal, than those observed for a simplified TS model (TS1) with the same geometry, indicating the Me-H3 and 5′-H2 bond vibrational modes are more constrained in the presence of these active-site interactions. However, there is no evidence that the donor–acceptor distance is compressed in our TS model and the intrinsic KIEs for NSD2 are consistent with product-like TS models with a shorter bond to the nucleophilic nitrogen. The total donor–acceptor distance in this model is in good agreement with previous QM/MM calculations for related PKMTs that predict a range of possible TS geometries (21, 22, 45–48). Compared with the TS geometry calculated for other human PKMTs, the TS for NSD2 is more product-like, having a more dissociated C–S bond. This may allow for the design of NSD2-specific inhibitors that mimic a product-like TS geometry.
Fig. 4.
Geometry and electrostatic potential surface of the NSD2 TS structure. (A) TS structure for H3K36 methylation catalyzed by NSD2 with active-site amino acids F1117, M1140, and Y1179 (TS2). (B) Electrostatic potential surface map (EPSM) for TS2 (red, partial negative; blue, partial positive). (C) A comparison of the EPSM for TS2, SAM, and methyltransferase inhibitor sinefungin. The NBO charge for the sulfur atom, CH3 group (sum of carbon and hydrogen), and lysine NH2 group are shown in parentheses for TS2 and SAM.
TS Bond Order and Charge Distribution.
The total bond order to both the leaving group and nucleophile in an SN2 reaction can vary between 0, for an extremely loose TS, or greater than 1 for compressed TS geometry. By comparison, TS2 has calculated bond orders of 0.382 and 0.482 for the C–S and C–N bonds, respectively. The sum of these bond orders is consistent with a loose donor–acceptor distance in the NSD2 TS structure. Fig. 4 highlights the electrostatic potential and natural bond orbital (NBO) charge distribution in TS2 compared with that of SAM and the methyltransferase inhibitor sinefungin. A positive charge is predominantly localized on the sulfur atom of SAM in GS2, as indicated by the NBO charge of 0.930 for the sulfur atom compared with 0.024 for the Me group carbon and hydrogen. In TS2, the positive charge on sulfur is reduced to 0.398 with a corresponding increase for the Me group to 0.326, consistent with an SN2 TS where the positive charge is distributed between the leaving group, transferring group, and nucleophile. The same distribution is observed for the electrostatic potential (Fig. 4C), where a positive electrostatic potential is localized on sulfur in SAM and distributed between the sulfur, methyl carbon, and lysine nitrogen in TS2. Analogs of sinefungin have been reported as selective inhibitors of SETD2 and proposed to mimic the TS of this enzyme (49). However, the electrostatic potential distribution for sinefungin appears to more closely mimic the charge localization of SAM than our TS2 (Fig. 4C). It is likely that chemically stable analogs of the NSD2 TS will require that a positive charge be distributed between at least two atoms and located at least 2.5 Å from a neutral atom mimicking the leaving group sulfur. Work is currently underway to design such analogs.
Conclusions
NSD2 predominantly catalyzes the dimethylation of HeLaNuc on H3K36 in vitro, consistent with the activity of full-length NSD2 (11, 17). Using a combination of experimental KIE measurements and density functional theory calculations, we have determined a TS structure for the NSD2 SET domain-catalyzed methylation of histone H3K36. The intrinsic KIEs are consistent with an SN2 reaction mechanism where methyl group transfer is significantly rate limiting. All of the intrinsic KIEs are consistent with a product-like TS geometry with a longer leaving group distance and shorter nucleophile distances of 2.53 and 2.10 Å, respectively. A comparison of electrostatic potential for the predicted TS structure and SAM GS indicate the positive charge on SAM is distributed between the leaving-group sulfur, the transferring methyl group, and the nitrogen nucleophile at the TS. This geometry and charge distribution can now guide future TS analog design for inhibitors of NSD2. Although a single TS structure for the NSD2-catalyzed monomethylation of H3K36 was sufficient to match the observed KIEs for the methylation of HeLaNuc, it is possible that the individual monomethylation and dimethylation reactions would produce different KIEs and TS structures. To address this, KIE studies using chemically defined nucleosome substrates that are either unmethylated or monomethylated at H3K36 are currently underway.
Materials and Methods
Materials.
l-[Me-14C]Methionine and l-[Me-3H3]methionine were purchased from PerkinElmer. d-[1-3H]Ribose, d-[6-3H2]glucose, d-[6-14C]glucose, and [8-14C]adenine were purchased from American Radiolabeled Chemicals. l-[Me-2H3]Methionine was purchased from Cambridge Isotope Laboratories. Hexokinase pyruvate kinase, myokinase, phosphoriboisomerase, glucose-6-phosphate dehydrogenase, glutamic acid dehydrogenase, and 6-phosphogluconic acid dehydrogenase were purchased from Sigma-Aldrich. Adenine phosphoribosyltransferase, phosphoribosyl-α-1-pyrophosphate synthetase, and ribokinase and SAM synthetase (SAMsyn) were prepared as previously described (50–52). HeLaNucs were extracted and purified as primarily mononucleosome and dinucleosome from cultured HeLa cells as previously described (53). Other chemicals and reagents were obtained from commercial sources and used without further purification. Human NSD2 SET domain (amino acid residues 980–1365) was expressed recombinantly and purified as described in SI Materials and Methods, and contained no bound SAM or S-adenosyl-l-homocysteine (SAH).
Methylation of HeLaNuc.
NSD2 reaction mixtures containing 1 µM HeLaNuc, 100 nM NSD2, and 20 µM [Me-2H3]SAM in 50 mM Tris⋅HCl (pH 9.0) with 5 mM MgCl2, 30 mM NaCl, 4 mM DTT, and 5% (mass/vol) glycerol were monitored by LC-MS to track newly installed methyl marks as described in SI Materials and Methods.
Synthesis of Isotope-Labeled SAM.
1′-3H–, 5′-3H2–, and 5′-14C–labeled ATPs were prepared as described previously (50). [8-14C]ATP was synthesized enzymatically in an analogous manner using 8-14C–labeled adenine (Fig. S1). [36S]Methionine was prepared chemoenzymatically from 36S-sulfur as previously described (54). 1′-3H–, 5′-3H2–, 5′-14C–, 8-14C–, Me-3H3–, Me-14C–, Me-2H3–, Me-2H3, 1′-3H–, and 36S, 8-14C–labeled SAM were prepared using Escherichia coli SAMsyn from the corresponding labeled ATPs or methionines (Table S1) as described in SI Materials and Methods.
Measurement of KIEs and Forward Commitment.
KIEs on V/K were measured using the competitive radiolabel approach (24, 50). SAM labeled at the atomic position of interest was mixed with an appropriate remote-labeled SAM bearing the light isotope at the position of interest shown in Table S2. KIEs were calculated from the change in isotope ratio in the remaining SAM substrate after 15–45% of the SAM substrate was consumed. Forward commitment (Cf) was measured using the isotope-trapping method (27). Detailed methods for the measurement of both KIEs and Cf are found in SI Materials and Methods.
Computational Methods.
The TS for methyl transfer catalyzed by NSD2 was studied by density functional theory in m062X/6-31G* as implemented in Gaussian 09 (38). Starting coordinates for the TS were derived from an overlay of the crystal structures of NSD1 (PDB ID code 3OOI) (34), SET7/9 (PDB ID codes 2F69 and 1XQH) (35), SET8 (PDB ID codes 3F9Y and 3F9W) (Fig. 3 and Fig. S2) (36). Initial coordinates for TS1 were located at a first-order saddle point and expanded to include d1 of 1.8, 2.0, 2.4, and 2.6 Å and d2 of 2.0, 2.2, 2.4, and 2.6 Å (Fig. S3). The same calculations were performed to locate the TS for the second methylation reaction (Fig. S4). Coordinates for the low energy conformation of SAM in the PubChem 3D database was used for the SAM ground states (GS) (55). SAM GS conformations were calculated at the same level of theory including water as an implicit solvent. The GS were located at local minima and contained no imaginary frequencies. A final TS model, including 40 atoms from active-site residues derived from the crystal structure of NSD1 (3OOI) (34), was calculated at the m062X/6-31Gd* level of theory (TS2). These residues are conserved between NSD1 and NSD2. TS2 contains a single imaginary frequency corresponding to the methyl group transfer. KIEs for each TS structure were calculated from the scaled vibrational frequencies using ISOEFF98 with the appropriate GS structures. Coordinates for all TS models are available upon request.
NBO analysis was performed for TS2 and the SAM (Fig. 4) using the same level of theory. Electrostatic potential maps for TS2 and bound SAM were visualized in Gaussview 5.0 using potential and density cubes generated from the NBO calculations (isovalue, 0.04).
SI Materials and Methods
LC-MS Analysis of HeLaNuc Products.
Reactions of NSD2 (100 nM) with HeLaNuc (2 µM) and [Me-2H3]SAM (20 µM) in 500 µL of 50 mM Tris⋅HCl (pH 9.0) with 5 mM MgCl2, 30 mM NaCl, 4 mM DTT, and 5% (mass/vol) glycerol were allowed to proceed for 0, 40, 80, and 160 min and stopped with 0.5% formic acid. A 10-µL volume of each sample, containing ∼1.2 µg of H3 protein, was removed and diluted with 20 µL of buffer containing 100 mM ammonium bicarbonate and 5 mM calcium acetate. Five microliters of 45 mM DTT solution was added to each sample followed by 2.5 µL (125 ng) of ArgC (Protea Biosciences) solution. The samples were allowed to digest at 37 °C over 2.5 h and then stopped by adding 1 µL of formic acid to each sample. Duplicate samples were prepared for each time point and analyzed by LC-MS on an LTQ-Orbitrap Velos Pro equipped with an Agilent 1100 nano-HPLC system. Methylated products were observed for the peptide containing amino acids 27–40 of histone H3. The approximate distribution of each product was calculated on the basis of their ion abundance.
Synthesis of Isotopically Labeled ATP.
[5′-3H]ATP and [5′-14C]ATP were enzymatically synthesized and purified as previously described from [6′-3H]glucose and [6′-14C]glucose, respectively (50). Each reaction contained 0.5 mM glucose (combination of hot and cold), 2 mM adenine, 25 µM ATP, 20 mM MgCl2, 5 mM NADP, 20 mM PEP, 50 mM KCl, 20 mM GlyGly, 100 mM KH2PO4 (pH 7.4), 1 U⋅mL−1 HK, 5 U⋅mL−1 MK, 1 U⋅mL−1 G-6PD, 1 U⋅mL−1 6-PGD, 5 U⋅mL−1 PRI, 10 U⋅mL−1 PK, 5 U⋅mL−1 PRPPase, and 5 U⋅mL−1 APRTase.
The synthesis of [1′-3H]ATP used [1′-3H]ribose as the labeled precursors. Each reaction contained 0.8 mM ribose (combination of hot and cold), 2 mM adenine, 0.1 mM ATP, 20 mM PEP, 10 mM MgCl2, 100 mM KH2PO4 (pH 7.4), with 5 U⋅mL−1 RK, 2 U⋅mL−1 MK, 10 U⋅mL−1 PK, 5 U⋅mL−1 PRPPase, and 2 U⋅mL−1 ARPTase.
[8-14C]ATP was prepared from [8-14C]adenine enzymatically. Reactions consisted of 1 mM adenine (total of hot and cold), 2.4 mM PRPP, 0.1 mM ATP, 20 mM PEP, 10 mM MgCl2, 100 mM KH2PO4 (pH 7.4), with 2 U⋅mL−1 MK, 20 U⋅mL−1 PK, and 2 U⋅mL−1 APRTase.
Synthesis and Purification of Isotope-Labeled SAM.
Labeled SAM were prepared using E. coli SAMsyn from the corresponding labeled ATPs or methionines (Table S1). Typical reactions contained 1 mM methionine, 1 mM ATP, and 800 nM MAT in 500 μL of 20 mM Tris⋅HCl, pH 8.0, containing 25 mM MgSO4, 50 mM K2SO4, and 8% β-mercaptoethanol, and were incubated at 37 °C for 2–3 h. For radiolabeled methionine, 50 µCi of labeled methionine was diluted to 1 mM using cold methionine. Radiolabeled ATPs were diluted to 1 mM with cold ATP in a similar manner. Labeled SAMs were purified by reverse-phase high-performance liquid chromatography (HPLC) using water with 0.1% formic acid for 4 min followed by a linear gradient of 0–45% acetonitrile over 6 min and holding at 45% acetonitrile for 10 min before reequilibrating (HPLC method A). SAM elutes at 3 min under these conditions. The isolated SAMs were dried by centrifugation under vacuum and further purified by reverse-phase HPLC using 50 mM ammonium formate pH 4 for 4 min followed by a linear gradient of 0–30% acetonitrile in the same buffer over 8 min holding at 30% acetonitrile for 8 min (HPLC method B). All labeled SAMs coelute with authentic SAM. Using this method, labeled SAMs were isolated as a single isomer (S,S) in greater than 95% purity.
Expression and Purification of apoNSD2(980–1365).
Full-length (fl) human NSD2 cDNA was PCR amplified from the cDNA library of a human breast cancer cell line (using Kozak-adapted 5′ gene-specific primer and 3′ gene-specific primer), and the PCR product was cloned into pENTR/TEV/D-TOPO vector. NSD2(980–1365) was generated from NSD2(fl) cDNA with Tev sequence at 5′ end and put into pDONR221. An LR reaction was performed between pDEST8HisGSTv2 vector and pDONR221-TevNSD2(980–1365) construct to generate a baculovirus expression construct pDESTHisGSTv2-TevNSD2(980–1365). Baculovirus expressing HisGST-TevNSD2(980–1365) was generated by transforming the construct into DH10Bac cells via a Bac-to-Bac system. The virus was amplified and protein was expressed in SF9 cells. All protein purification steps were carried out at 4 °C. HisGST-TevNSD2(980–1365) was released from baculovirus-infected SF9 cells by sonication and captured by batch adsorption onto Glutathione Sepharose 4B (GE Healthcare) from clarified cell lysate supernatant. NSD2(980–365) was released from column-bound HisGST-NSD2(980–365) by overnight incubation with tobacco etch virus protease (TEV), and further purified and separated from cofactor SAM by capture on a Mono S cation exchange column in 2 M urea at pH 7. After extensive washing with 1.5 M urea, NSD2(980–1365) was eluted with an increasing linear salt and decreasing urea gradients. The Mono S pool was concentrated and further fractionated on Superdex 200. Removal of SAM was confirmed by heat precipitation of NSD2(980–1365) for 20 min at 55 °C, and SAM concentration was measured by absorbance at 260 nm in the supernatant (modified method from ref. 56). After partial unfolding with 2 M urea, the activity of apo NSD2(980–1365) demonstrated equivalent specific activity as the initial SAM-bound NSD2(980–1365) against HeLaNuc.
KIE Measurements.
KIEs were measured under competitive radiolabel conditions where the light substrate contained a remote 1′-3H or 8-14C to track the light isotope at the position of interest. For 36S and Me-2H3 KIEs, the heavy substrate also contained a remote radiolabel to track the stable heavy isotope at the position of interest in the same way. The heavy and light substrates were mixed with a counts per minute (cpm) ratio for 3H:14C of ∼1:1. Typical reactions contained 2.5 µM SAM (total of heavy, light, and unlabeled), 1.5 µM HeLaNuc, and 10 nM NSD2 in 500 µL of 50 mM Tris⋅HCl (pH 9.0) with 5 mM MgCl2, 30 mM NaCl, 4 mM DTT, and 5% glycerol. A 250-µL portion of each mixture was removed to measure the isotope ratio of the unreacted substrate and immediately quenched by addition of 10 mM H2SO4. NSD2 was added to the remaining samples and allowed to proceed until 15–45% of the SAM was consumed (f = 0.15–0.45). Reactions were quenched as above and frozen over dry ice to prevent SAM degradation before purification. Control reactions containing no HeLa nucleosome were run in parallel to control for SAM degradation during the incubation and purification procedure. SAM and SAH were isolated from each sample by analytical reversed-phase HPLC using method B, where SAM and SAH elute at 5.5 and 15.5 min, respectively. The collected SAM and SAH fractions were dried by centrifugation under vacuum, dissolved in 500 µL of water, and mixed with 10 mL of Ultima Gold scintillation fluid (PerkinElmer).
Samples were counter for radioactivity in a Tricarb 2910 TR scintillation counter (PerkinElmer) in dual-channel fashion where the 3H signal appears only in channel 1 and the 14C signal appears in both channels. The counts per minute per channel was determined from the average of 10 cycles of scintillation counting at 10 min per sample. The ratio of 14C counts per minute in channel 1:2 (r) was determined for standards containing only 14C-labeled SAM purified in an identical manner to the KIE reactions. The 3H and 14C signals were calculated by Eqs. S1 and S2, respectively:
| [S1] |
| [S2] |
Experimental KIEs were calculated from the change of isotope ratio of the heavy to light isotopes of unreacted SAM initially (R0) and at f = 0.15–0.45 (Rf). The KIEs were extrapolated to 0% conversion using Eq. S3, where f is the fraction of conversion determined from the ratio of counts per minute from the remote label in the product SAH to the total counts per minute of remote label in both SAM and SAH. Each reported KIE is the average of at least six replicates measured from two independent experiments:
| [S3] |
Measurement of Forward Commitment Factor.
The forward commitment factor (Cf) for SAM was measured by isotope trapping (27). NSD2 (10 µM) was incubated for 5 min at 25 °C with [1′-3H]SAM (40 µM) in 50 mM Tris⋅HCl (pH 9.0) with 5 mM MgCl2, and 4 mM DTT allowing formation of an equilibrium enzyme–SAM complex (EA). A chase solution [480 µL; 1 mM unlabeled SAM, 2 µM HeLaNuc, 50 mM Tris⋅HCl (pH 9.0) with 5 mM MgCl2, 4 mM DTT, 30 mM NaCl, and 5% glycerol] was rapidly mixed with 20 µL of the EA complex solution. Four 125-µL aliquots were removed and quenched with 10 mM H2SO4 at the indicated times in Fig. 3A. SAM and SAH were isolated for each time point as described for KIE measurement. Control reactions containing no HeLaNuc in the chase solution were used to correct for background levels of SAM breakdown. The ratio radiolabeled SAH produced to the initial concentration of EA complex was plotted as a function of time and extrapolated back to time 0. Cf was calculated using Eq. S4, where Y is the ratio of labeled SAH produced to initial ES complex at time 0. Intrinsic KIEs were obtained by correcting the observed KIEs (V/K) for forward commitment by Eq. 1:
| [S4] |
Acknowledgments
We thank Z. Wang (Albert Einstein College of Medicine) and C. Stratton (Albert Einstein College of Medicine) for helpful discussion, L. Myers (GlaxoSmithKline) for scale-up expression of NSD2, and H. Trinh (GlaxoSmithKline) for the original full-length NSD2 clone. This work was supported by a collaborative research agreement between GlaxoSmithKline Pharmaceuticals and the Albert Einstein College of Medicine, and NIH Research Grant GM041916. M.B.P. is the recipient of a Natural Sciences and Engineering Research Council of Canada Postdoctoral Fellowship.
Footnotes
The authors declare no conflict of interest.
This article contains supporting information online at www.pnas.org/lookup/suppl/doi:10.1073/pnas.1521036113/-/DCSupplemental.
References
- 1.Kouzarides T. Chromatin modifications and their function. Cell. 2007;128(4):693–705. doi: 10.1016/j.cell.2007.02.005. [DOI] [PubMed] [Google Scholar]
- 2.Jenuwein T, Allis CD. Translating the histone code. Science. 2001;293(5532):1074–1080. doi: 10.1126/science.1063127. [DOI] [PubMed] [Google Scholar]
- 3.Dillon SC, Zhang X, Trievel RC, Cheng X. The SET-domain protein superfamily: Protein lysine methyltransferases. Genome Biol. 2005;6(8):227. doi: 10.1186/gb-2005-6-8-227. [DOI] [PMC free article] [PubMed] [Google Scholar]
- 4.Zhang X, Bruice TC. Enzymatic mechanism and product specificity of SET-domain protein lysine methyltransferases. Proc Natl Acad Sci USA. 2008;105(15):5728–5732. doi: 10.1073/pnas.0801788105. [DOI] [PMC free article] [PubMed] [Google Scholar]
- 5.Kipp DR, Quinn CM, Fortin PD. Enzyme-dependent lysine deprotonation in EZH2 catalysis. Biochemistry. 2013;52(39):6866–6878. doi: 10.1021/bi400805w. [DOI] [PubMed] [Google Scholar]
- 6.Cao R, et al. Role of histone H3 lysine 27 methylation in Polycomb-group silencing. Science. 2002;298(5595):1039–1043. doi: 10.1126/science.1076997. [DOI] [PubMed] [Google Scholar]
- 7.Wozniak GG, Strahl BD. Hitting the “mark”: Interpreting lysine methylation in the context of active transcription. Biochim Biophys Acta. 2014;1839(12):1353–1361. doi: 10.1016/j.bbagrm.2014.03.002. [DOI] [PubMed] [Google Scholar]
- 8.Schneider R, Bannister AJ, Kouzarides T. Unsafe SETs: Histone lysine methyltransferases and cancer. Trends Biochem Sci. 2002;27(8):396–402. doi: 10.1016/s0968-0004(02)02141-2. [DOI] [PubMed] [Google Scholar]
- 9.Stec I, et al. WHSC1, a 90 kb SET domain-containing gene, expressed in early development and homologous to a Drosophila dysmorphy gene maps in the Wolf-Hirschhorn syndrome critical region and is fused to IgH in t(4;14) multiple myeloma. Hum Mol Genet. 1998;7(7):1071–1082. doi: 10.1093/hmg/7.7.1071. [DOI] [PubMed] [Google Scholar]
- 10.Chesi M, et al. The t(4;14) translocation in myeloma dysregulates both FGFR3 and a novel gene, MMSET, resulting in IgH/MMSET hybrid transcripts. Blood. 1998;92(9):3025–3034. [PubMed] [Google Scholar]
- 11.Kuo AJ, et al. NSD2 links dimethylation of histone H3 at lysine 36 to oncogenic programming. Mol Cell. 2011;44(4):609–620. doi: 10.1016/j.molcel.2011.08.042. [DOI] [PMC free article] [PubMed] [Google Scholar]
- 12.Morishita M, di Luccio E. Cancers and the NSD family of histone lysine methyltransferases. Biochim Biophys Acta. 2011;1816(2):158–163. doi: 10.1016/j.bbcan.2011.05.004. [DOI] [PubMed] [Google Scholar]
- 13.Hudlebusch HR, et al. MMSET is highly expressed and associated with aggressiveness in neuroblastoma. Cancer Res. 2011;71(12):4226–4235. doi: 10.1158/0008-5472.CAN-10-3810. [DOI] [PubMed] [Google Scholar]
- 14.Morishita M, Mevius D, di Luccio E. In vitro histone lysine methylation by NSD1, NSD2/MMSET/WHSC1 and NSD3/WHSC1L. BMC Struct Biol. 2014;14(1):25. doi: 10.1186/s12900-014-0025-x. [DOI] [PMC free article] [PubMed] [Google Scholar]
- 15.Nimura K, et al. A histone H3 lysine 36 trimethyltransferase links Nkx2-5 to Wolf-Hirschhorn syndrome. Nature. 2009;460(7252):287–291. doi: 10.1038/nature08086. [DOI] [PubMed] [Google Scholar]
- 16.Pei H, et al. MMSET regulates histone H4K20 methylation and 53BP1 accumulation at DNA damage sites. Nature. 2011;470(7332):124–128. doi: 10.1038/nature09658. [DOI] [PMC free article] [PubMed] [Google Scholar]
- 17.Li Y, et al. The target of the NSD family of histone lysine methyltransferases depends on the nature of the substrate. J Biol Chem. 2009;284(49):34283–34295. doi: 10.1074/jbc.M109.034462. [DOI] [PMC free article] [PubMed] [Google Scholar]
- 18.Allali-Hassani A, et al. A basic post-SET extension of NSDs is essential for nucleosome binding in vitro. J Biomol Screen. 2014;19(6):928–935. doi: 10.1177/1087057114525854. [DOI] [PubMed] [Google Scholar]
- 19.Schramm VL. Enzymatic transition state theory and transition state analogue design. J Biol Chem. 2007;282(39):28297–28300. doi: 10.1074/jbc.R700018200. [DOI] [PubMed] [Google Scholar]
- 20.Schramm VL. Enzymatic transition states, transition-state analogs, dynamics, thermodynamics, and lifetimes. Annu Rev Biochem. 2011;80(80):703–732. doi: 10.1146/annurev-biochem-061809-100742. [DOI] [PMC free article] [PubMed] [Google Scholar]
- 21.Zhang X, Bruice TC. Product specificity and mechanism of protein lysine methyltransferases: Insights from the histone lysine methyltransferase SET8. Biochemistry. 2008;47(25):6671–6677. doi: 10.1021/bi800244s. [DOI] [PubMed] [Google Scholar]
- 22.Zhang X, Bruice TC. Histone lysine methyltransferase SET7/9: Formation of a water channel precedes each methyl transfer. Biochemistry. 2007;46(51):14838–14844. doi: 10.1021/bi7014579. [DOI] [PubMed] [Google Scholar]
- 23.Cleland WW. Isotope effects: Determination of enzyme transition state structure. Methods Enzymol. 1995;249:341–373. doi: 10.1016/0076-6879(95)49041-8. [DOI] [PubMed] [Google Scholar]
- 24.Schramm VL. Enzymatic transition-state analysis and transition-state analogs. Methods Enzymol. 1999;308:301–355. doi: 10.1016/s0076-6879(99)08015-5. [DOI] [PubMed] [Google Scholar]
- 25.Young NL, et al. High throughput characterization of combinatorial histone codes. Mol Cell Proteomics. 2009;8(10):2266–2284. doi: 10.1074/mcp.M900238-MCP200. [DOI] [PMC free article] [PubMed] [Google Scholar]
- 26.Wagner EJ, Carpenter PB. Understanding the language of Lys36 methylation at histone H3. Nat Rev Mol Cell Biol. 2012;13(2):115–126. doi: 10.1038/nrm3274. [DOI] [PMC free article] [PubMed] [Google Scholar]
- 27.Rose IA. The isotope trapping method: Desorption rates of productive E.S complexes. Methods Enzymol. 1980;64:47–59. doi: 10.1016/s0076-6879(80)64004-x. [DOI] [PubMed] [Google Scholar]
- 28.Westaway KC. Using kinetic isotope effects to determine the structure of the transition states of SN2 reactions. In: Richard JP, editor. Advances in Physical Organic Chemistry. Vol 41. Academic; London: 2006. pp. 217–273. [Google Scholar]
- 29.Swain CG, Stivers EC, Reuwer JF, Schaad LJ. Use of hydrogen isotope effects to identify the attacking nucleophile in the enolization of ketones catalyzed by acetic acid 1-3. J Am Chem Soc. 1958;80(21):5885–5893. [Google Scholar]
- 30.Hegazi MF, Borchardt RT, Schowen RL. alpha-Deuterium and carbon-13 isotope effects for methyl transfer catalyzed by catechol O-methyltransferase. SN2-like transition state. J Am Chem Soc. 1979;101(15):4359–4365. doi: 10.1021/ja00426a079. [DOI] [PubMed] [Google Scholar]
- 31.Zhang J, Klinman JP. Enzymatic methyl transfer: Role of an active site residue in generating active site compaction that correlates with catalytic efficiency. J Am Chem Soc. 2011;133(43):17134–17137. doi: 10.1021/ja207467d. [DOI] [PMC free article] [PubMed] [Google Scholar]
- 32.Ruggiero GD, Williams IH, Roca M, Moliner V, Tuñón I. QM/MM determination of kinetic isotope effects for COMT-catalyzed methyl transfer does not support compression hypothesis. J Am Chem Soc. 2004;126(28):8634–8635. doi: 10.1021/ja048055e. [DOI] [PubMed] [Google Scholar]
- 33.Lameira J, Bora RP, Chu ZT, Warshel A. Methyltransferases do not work by compression, cratic, or desolvation effects, but by electrostatic preorganization. Proteins. 2015;83(2):318–330. doi: 10.1002/prot.24717. [DOI] [PMC free article] [PubMed] [Google Scholar]
- 34.Qiao Q, et al. The structure of NSD1 reveals an autoregulatory mechanism underlying histone H3K36 methylation. J Biol Chem. 2011;286(10):8361–8368. doi: 10.1074/jbc.M110.204115. [DOI] [PMC free article] [PubMed] [Google Scholar]
- 35.Couture JF, Collazo E, Hauk G, Trievel RC. Structural basis for the methylation site specificity of SET7/9. Nat Struct Mol Biol. 2006;13(2):140–146. doi: 10.1038/nsmb1045. [DOI] [PubMed] [Google Scholar]
- 36.Couture JF, Dirk LM, Brunzelle JS, Houtz RL, Trievel RC. Structural origins for the product specificity of SET domain protein methyltransferases. Proc Natl Acad Sci USA. 2008;105(52):20659–20664. doi: 10.1073/pnas.0806712105. [DOI] [PMC free article] [PubMed] [Google Scholar]
- 37.Zhang X, et al. Structural basis for the product specificity of histone lysine methyltransferases. Mol Cell. 2003;12(1):177–185. doi: 10.1016/s1097-2765(03)00224-7. [DOI] [PMC free article] [PubMed] [Google Scholar]
- 38.Frisch MJ, et al. Gaussian 09. Gaussian; Wallingford, CT: 2009. [Google Scholar]
- 39.Anisimov V, Paneth P. ISOEFF98. A program for studies of isotope effects using Hessian modifications. J Math Chem. 1999;26(1-3):75–86. [Google Scholar]
- 40.Gonzalez-James OM, et al. Experimental evidence for heavy-atom tunneling in the ring-opening of cyclopropylcarbinyl radical from intramolecular 12C/13C kinetic isotope effects. J Am Chem Soc. 2010;132(36):12548–12549. doi: 10.1021/ja1055593. [DOI] [PMC free article] [PubMed] [Google Scholar]
- 41.Vetticatt MJ, Singleton DA. Isotope effects and heavy-atom tunneling in the Roush allylboration of aldehydes. Org Lett. 2012;14(9):2370–2373. doi: 10.1021/ol300789a. [DOI] [PMC free article] [PubMed] [Google Scholar]
- 42.Zhang J, Kulik HJ, Martinez TJ, Klinman JP. Mediation of donor–acceptor distance in an enzymatic methyl transfer reaction. Proc Natl Acad Sci USA. 2015;112(26):7954–7959. doi: 10.1073/pnas.1506792112. [DOI] [PMC free article] [PubMed] [Google Scholar]
- 43.Horowitz S, et al. Conservation and functional importance of carbon-oxygen hydrogen bonding in AdoMet-dependent methyltransferases. J Am Chem Soc. 2013;135(41):15536–15548. doi: 10.1021/ja407140k. [DOI] [PubMed] [Google Scholar]
- 44.Horowitz S, Yesselman JD, Al-Hashimi HM, Trievel RC. Direct evidence for methyl group coordination by carbon-oxygen hydrogen bonds in the lysine methyltransferase SET7/9. J Biol Chem. 2011;286(21):18658–18663. doi: 10.1074/jbc.M111.232876. [DOI] [PMC free article] [PubMed] [Google Scholar]
- 45.Hu P, Zhang Y. Catalytic mechanism and product specificity of the histone lysine methyltransferase SET7/9: An ab initio QM/MM-FE study with multiple initial structures. J Am Chem Soc. 2006;128(4):1272–1278. doi: 10.1021/ja056153+. [DOI] [PubMed] [Google Scholar]
- 46.Zhang X, Bruice TC. A quantum mechanics/molecular mechanics study of the catalytic mechanism and product specificity of viral histone lysine methyltransferase. Biochemistry. 2007;46(34):9743–9751. doi: 10.1021/bi700515q. [DOI] [PubMed] [Google Scholar]
- 47.Zhang X, Bruice TC. Catalytic mechanism and product specificity of rubisco large subunit methyltransferase: QM/MM and MD investigations. Biochemistry. 2007;46(18):5505–5514. doi: 10.1021/bi700119p. [DOI] [PubMed] [Google Scholar]
- 48.Zhang X, Bruice TC. Mechanism of product specificity of AdoMet methylation catalyzed by lysine methyltransferases: Transcriptional factor p53 methylation by histone lysine methyltransferase SET7/9. Biochemistry. 2008;47(9):2743–2748. doi: 10.1021/bi702370p. [DOI] [PubMed] [Google Scholar]
- 49.Zheng W, et al. Sinefungin derivatives as inhibitors and structure probes of protein lysine methyltransferase SETD2. J Am Chem Soc. 2012;134(43):18004–18014. doi: 10.1021/ja307060p. [DOI] [PMC free article] [PubMed] [Google Scholar]
- 50.Parkin DW, Leung HB, Schramm VL. Synthesis of nucleotides with specific radiolabels in ribose. Primary 14C and secondary 3H kinetic isotope effects on acid-catalyzed glycosidic bond hydrolysis of AMP, dAMP, and inosine. J Biol Chem. 1984;259(15):9411–9417. [PubMed] [Google Scholar]
- 51.Singh V, Lee JE, Núñez S, Howell PL, Schramm VL. Transition state structure of 5′-methylthioadenosine/S-adenosylhomocysteine nucleosidase from Escherichia coli and its similarity to transition state analogues. Biochemistry. 2005;44(35):11647–11659. doi: 10.1021/bi050863a. [DOI] [PubMed] [Google Scholar]
- 52.Markham GD, Hafner EW, Tabor CW, Tabor H. S-Adenosylmethionine synthetase from Escherichia coli. J Biol Chem. 1980;255(19):9082–9092. [PubMed] [Google Scholar]
- 53.Jiang Y, et al. Methyltransferases prefer monomer over core-trimmed nucleosomes as in vitro substrates. Anal Biochem. 2011;415(1):84–86. doi: 10.1016/j.ab.2011.03.037. [DOI] [PubMed] [Google Scholar]
- 54.Poulin MB, Du Q, Schramm VL. Chemoenzymatic synthesis of 36S isotopologues of methionine and S-adenosyl-l-methionine. J Org Chem. 2015;80(10):5344–5347. doi: 10.1021/acs.joc.5b00608. [DOI] [PubMed] [Google Scholar]
- 55.Kim S, Bolton EE, Bryant SH. PubChem3D: Conformer ensemble accuracy. J Cheminform. 2013;5(1):1–17. doi: 10.1186/1758-2946-5-1. [DOI] [PMC free article] [PubMed] [Google Scholar]
- 56.Forneris F, Binda C, Vanoni MA, Mattevi A, Battaglioli E. Histone demethylation catalysed by LSD1 is a flavin-dependent oxidative process. FEBS Lett. 2005;579(10):2203–2207. doi: 10.1016/j.febslet.2005.03.015. [DOI] [PubMed] [Google Scholar]


