Significance
In many cancers, specific genes affecting cellular growth control are hypermethylated and transcriptionally repressed, a phenomenon known as epigenetic silencing. However, the mechanistic basis of epigenetic silencing is not well understood. One model, called the “instructive model,” posits that epigenetic silencing occurs through a specific pathway, comprising a defined set of components, initiated by an oncoprotein. We have previously shown that in colorectal cancer, B-Raf proto-oncogene (BRAF) directs widespread promoter methylation and epigenetic silencing by up-regulating the transcriptional repressor v-maf avian musculoaponeurotic fibrosarcoma oncogene homolog G (MAFG), which, in turn, recruits a set of corepressors, resulting in transcriptional repression. Here, we show that this same BRAF-directed pathway also mediates widespread epigenetic silencing in melanoma. Our results provide strong support for the instructive model of oncoprotein-directed epigenetic silencing.
Keywords: BRAF(V600E), colorectal cancer, epigenetic silencing, MAFG, melanoma
Abstract
During cancer development, it is well established that many genes, including tumor suppressor genes, are hypermethylated and transcriptionally repressed, a phenomenon referred to as epigenetic silencing. In general, the factors involved in, and the mechanistic basis of, epigenetic silencing during cancer development are not well understood. We have recently described an epigenetic silencing pathway, directed by the oncogenic B-Raf proto-oncogene (BRAF) variant BRAF(V600E), that mediates widespread epigenetic silencing in colorectal cancer (CRC). Notably, the BRAF(V600E) mutation is also present in 50–70% of melanomas. Here, we show that the same pathway we identified in CRC also directs epigenetic silencing of a similar set of genes in BRAF-positive melanoma. In both CRC and melanoma, BRAF(V600E) promotes epigenetic silencing through up-regulation of v-maf avian musculoaponeurotic fibrosarcoma oncogene homolog G (MAFG), a transcriptional repressor with sequence-specific DNA-binding activity. The elevated concentration of MAFG drives DNA binding on the promoter. Promoter-bound MAFG recruits a set of corepressors that includes its heterodimeric partner BTB and CNC homology 1, basic leucine zipper transcription factor 1 (BACH1), the chromatin remodeling factor chromodomain helicase DNA-binding protein 8 (CHD8), and the DNA methyltransferase DNMT3B, resulting in hypermethylation and transcriptional silencing. Our results reveal a common BRAF(V600E)-directed transcriptional regulatory pathway that mediates epigenetic silencing in unrelated solid tumors and provide strong support for an instructive model of oncoprotein-directed epigenetic silencing.
A distinguishing feature of human cancer genomes is aberrant DNA methylation, which is characterized by both global DNA hypomethylation and site-specific DNA hypermethylation (reviewed in 1–4). Site-specific DNA hypermethylation of promoter-associated CpG islands of tumor suppressor and DNA repair genes results in transcriptional silencing (commonly referred to as epigenetic silencing), thereby facilitating the initiation and progression of cancer (1–4).
Widespread CpG island promoter hypermethylation, referred to as the CpG island methylator phenotype (CIMP), was first identified in colorectal cancers (CRCs) (5) and has been extensively studied in this tumor type (reviewed in 6). Approximately 8–15% of CRCs contain an activating mutation in the B-Raf proto-oncogene (BRAF) oncoprotein [typically BRAF(V600E)] (7–9), a Ser/Thr kinase that stimulates cellular proliferation by signaling through the MAPK pathway [BRAF/mitogen activated protein kinase kinase (MEK)/ERK] (reviewed in 10). Most BRAF-positive CRCs have aberrant promoter hypermethylation of a set of ∼60 so-called CIMP marker genes (11, 12).
To understand the basis of aberrant promoter hypermethylation in CRC, we recently carried out a large-scale RNAi screen to identify factors required for hypermethylation and silencing of the CIMP marker gene mutL homolog 1 (MLH1) (13). Using this approach, we identified v-maf avian musculoaponeurotic fibrosarcoma oncogene homolog G (MAFG), a transcriptional repressor with sequence-specific DNA-binding activity, as the pivotal factor required for MLH1 silencing and CIMP in CRCs containing BRAF(V600E). In BRAF-positive CRCs, MAFG is bound at the promoters of MLH1 and other CIMP genes, and recruits a set of corepressors that includes its heterodimeric partner BTB and CNC homology 1, basic leucine zipper transcription factor 1 (BACH1), the chromatin remodeling factor chromodomain helicase DNA-binding protein 8 (CHD8), and the DNA methyltransferase DNMT3B, resulting in hypermethylation and transcriptional silencing. The increase in BRAF/MEK/ERK signaling in BRAF-positive cells results in phosphorylation and elevated levels of MAFG, which drives DNA binding on the promoter.
Genome-wide promoter methylation analysis has shown extensive alteration of DNA methylation in melanomas (14–17). The molecular basis by which the aberrant DNA methylation pattern is acquired during melanoma development remains to be determined. Acquisition of an activating mutation in BRAF occurs in 50–70% of melanomas (18). We therefore investigated the possibility that the BRAF-directed pathway that mediates CIMP in CRCs also directs widespread promoter methylation in melanoma. Our results reveal a common BRAF(V600E)-directed transcriptional regulatory pathway that mediates epigenetic silencing in unrelated cancer types.
Results and Discussion
Transcriptional Repressor MAFG Directs an Epigenetic Silencing Pathway in BRAF-Positive SK-MEL-28 Human Melanoma Cells.
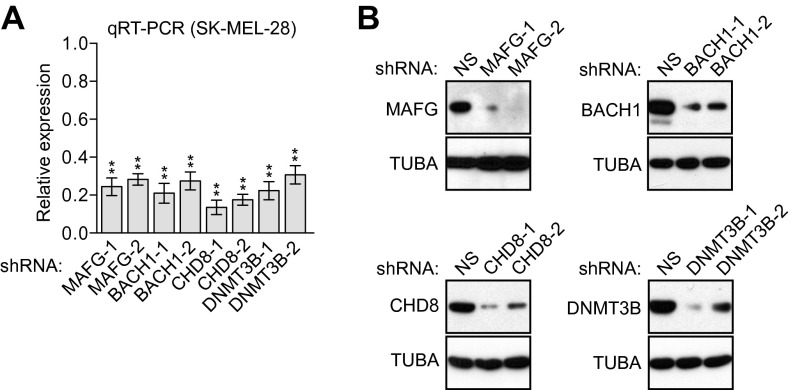
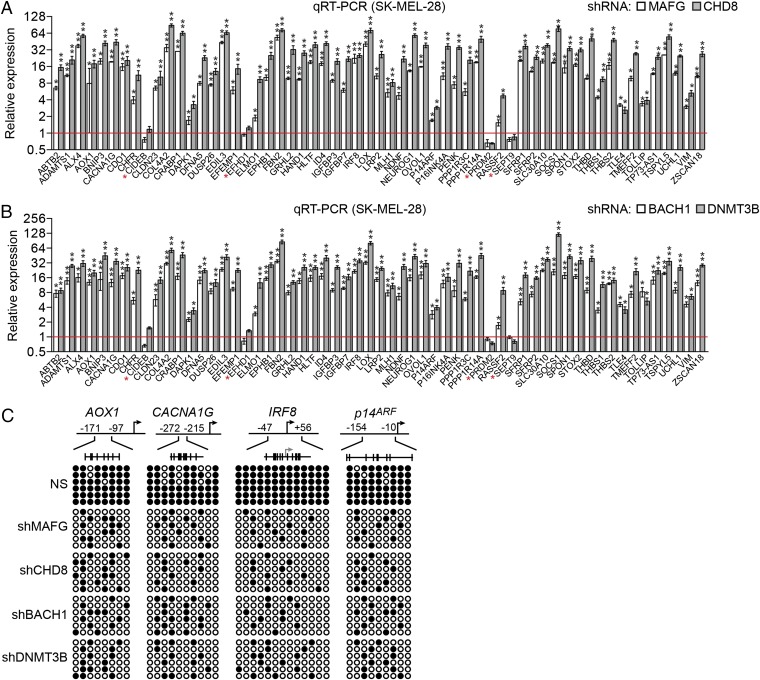
To ask whether MAFG and its corepressors have a role in aberrant promoter hypermethylation and transcriptional silencing of genes in melanoma containing BRAF(V600E), we first analyzed the expression of CRC CIMP genes following depletion of MAFG or its corepressors. Knockdown of MAFG, CHD8, BACH1, or DNMT3B in BRAF-positive SK-MEL-28 human melanoma cells (Fig. S1) derepressed expression of 55 of 59 CIMP genes (Fig. 1 A and B). Notably, one of the CIMP genes is IGFBP7, which we have previously shown is silenced in melanoma cell lines containing BRAF(V600E) (19). The bisulfite sequencing experiment of Fig. 1C shows that a subset of representative CIMP genes were, as expected, hypermethylated in SK-MEL-28 cells. Moreover, knockdown of MAFG, CHD8, BACH1, or DNMT3B resulted in a large reduction in methylation in these promoters, consistent with their transcriptional derepression.
Fig. S1.
shRNA-mediated knockdown efficiency of MAFG, BACH1, CHD8, and DNMT3B in SK-MEL-28 cells. qRT-PCR (A) and immunoblot (B) analysis monitoring shRNA-mediated knockdown efficiency for MAFG, BACH1, CHD8, and DNMT3B in SK-MEL-28 cells using two unrelated shRNAs against the same target gene. Data are represented as mean ± SD. *P ≤ 0.05; **P ≤ 0.01. NS, nonsilencing.
Fig. 1.
Transcriptional repressor MAFG directs an epigenetic silencing pathway in BRAF-positive SK-MEL-28 melanoma cells. qRT-PCR analysis monitored expression of CIMP genes in SK-MEL-28 cells expressing a MAFG or CHD8 shRNA (A) or a BACH1 or DNMT3B shRNA (B). The results were normalized to the results obtained with the nonsilencing (NS) control, which was set to 1. Data are represented as mean ± SD. *P ≤ 0.05; **P ≤ 0.01. (C) Bisulfite sequencing analysis of representative CIMP genes in SK-MEL-28 cells expressing a NS, MAFG, CHD8, BACH1, or DNMT3B shRNA. (Upper) Schematic of each promoter; positions of CpGs are shown to scale by vertical lines. (Lower) Each circle represents a methylated (●) or unmethylated (○) CpG dinucleotide. Each row represents a single clone.
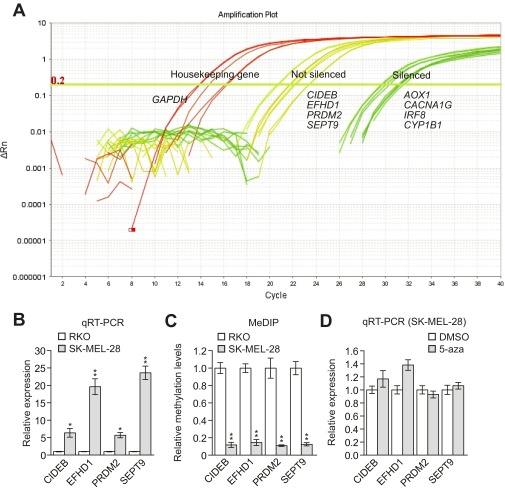
Four genes, CIDEB, EFHD1, PRDM2, and SEPT9, were not significantly derepressed following knockdown of MAFG or its corepressors (Fig. 1 A and B). We noticed in quantitative real-time RT-PCR (qRT-PCR) analyses that the cycle of threshold (Ct) values of these four genes were 20–22, whereas the Ct values of the other 55 derepressed genes were in the range of 28–32 (Fig. S2A), which suggested these four genes were not silenced in SK-MEL-28 cells. In support of this conclusion, qRT-PCR analysis shows that the four genes were expressed at substantially higher levels in SK-MEL-28 cells than in BRAF-positive RKO CRC cells (Fig. S2B), a cell line in which the genes are known to be hypermethylated and silenced (13). Furthermore, methylated DNA immunoprecipitation analysis indicated that methylation of the four gene promoters in SK-MEL-28 cells was much lower than in RKO cells (Fig. S2C). Finally, unlike what we found in RKO cells (13), treatment of SK-MEL-28 cells with the DNA methyltransferase inhibitor 5-azacyticine had no effect on expression of the four genes (Fig. S2D).
Fig. S2.
CIDEB, EFHD1, PRDM2, and SEPT9 are not hypermethylated and silenced in SK-MEL-28 cells. (A) Amplification plot showing Ct values for silenced genes, nonsilenced genes, and (as a control) a housekeeping gene in SK-MEL-28 cells. The results show that the Ct values for CIDEB, EFHD1, PRDM2, and SEPT9 were 20–22, whereas the Ct values of the other derepressed genes were 28–32, suggesting the four genes were not silenced in SK-MEL-28 cells. ΔRn = Rn+ − Rn−, where Rn is the fluorescence emission intensity of the reporter dye divided by the fluorescence emission intensity of the passive reference dye (Rn+ is the value of the reaction containing all components and Rn− is the value of an unreacted sample). (B) qRT-PCR analysis monitoring expression of CIDEB, EFHD1, PRDM2, and SEPT9 in SK-MEL-28 cells relative to expression observed in RKO cells. The results in SK-MEL-28 cells were normalized to the results obtained in RKO cells, which were set to 1. (C) qRT-PCR analysis monitoring expression of CIDEB, EFHD1, PRDM2, and SEPT9 in SK-MEL-28 cells treated in the presence or absence of the DNA methyltransferase inhibitor 5-azacyticine (5-aza). The results show that 5-aza treatment had no effect on expression of the four genes in SK-MEL-28 cells. (D) Methylated DNA immunoprecipitation (MeDIP) analysis of CIDEB, EFHD1, PRDM2, and SEPT9 in RKO and SK-MEL-28 cells. Methylation was normalized to normalization obtained in RKO cells, which was set to 1. Data are represented as mean ± SD. *P ≤ 0.05; **P ≤ 0.01.
MAFG Directs Epigenetic Silencing of Genes Frequently Hypermethylated in Melanoma.
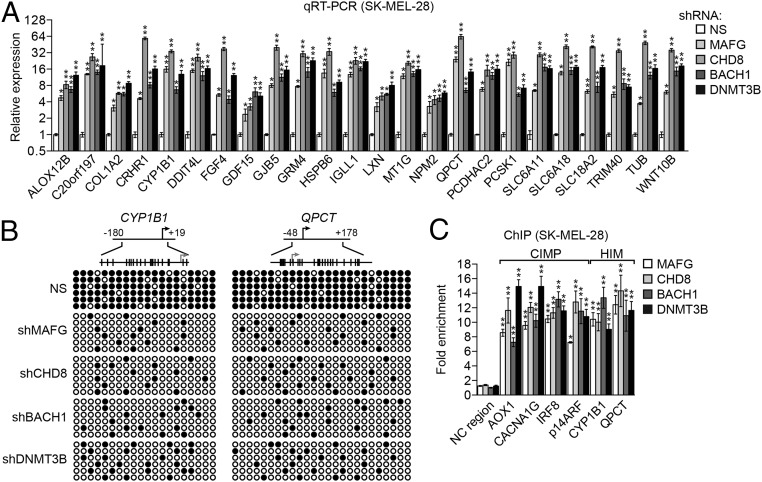
Genome-wide DNA methylation analysis has identified genes that are frequently hypermethylated in melanomas (15–17). To determine whether the MAFG-directed pathway also silences these genes, we analyzed a representative set of 24 genes that are hypermethylated in melanoma (hereafter referred to as HIM genes). The qRT-PCR results of Fig. 2A show that shRNA-mediated knockdown of MAFG, CHD8, BACH1, or DNMT3B in SK-MEL-28 cells derepressed expression of all 24 HIM genes. Bisulfite sequencing confirmed that representative HIM genes were, as expected, hypermethylated in SK-MEL-28 cells, and that hypermethylation was reduced by knockdown of MAFG, CHD8, BACH1, or DNMT3B (Fig. 2B).
Fig. 2.
MAFG directs epigenetic silencing of genes frequently hypermethylated in melanoma. (A) qRT-PCR analysis monitoring expression of HIM genes in SK-MEL-28 cells expressing a MAFG, CHD8, BACH1, or DNMT3B shRNA. (B) Bisulfite sequencing analysis of representative HIM genes in SK-MEL-28 cells expressing a NS, MAFG, CHD8, BACH1, or DNMT3B shRNA. (Upper) Schematic of each promoter; positions of CpGs are shown to scale by vertical lines. (Lower) Each circle represents a methylated (●) or unmethylated (○) CpG dinucleotide. Each row represents a single clone. (C) ChIP analysis monitoring binding of MAFG, CHD8, BACH1, and DNMT3B on representative CIMP and HIM gene promoters or, as a negative control, an irrelevant DNA region (NC region) in SK-MEL-28 cells. Data are represented as mean ± SD. *P ≤ 0.05; **P ≤ 0.01.
MAFG and Its Corepressors Are Bound to Epigenetically Silenced CIMP and HIM Genes.
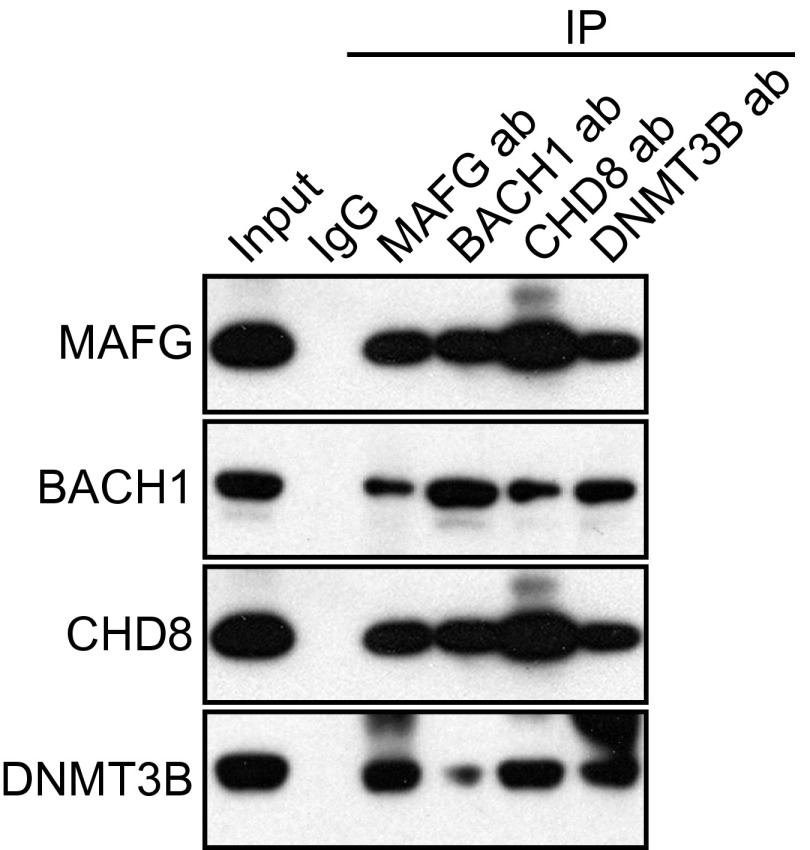
To determine whether MAFG, CHD8, BACH1, and DNMT3B bind directly to promoters of CIMP and HIM genes in melanoma cells, we carried out ChIP experiments. Fig. 2C shows that MAFG, BACH1, CHD8, and DNMT3B were enriched on the promoters of four representative CIMP genes and two representative HIM genes in SK-MEL-28 cells. These genes were also derepressed by knockdown using a second, unrelated shRNA directed against MAFG, BACH1, CHD8, or DNMT3B (Figs. S1 and S3). Consistent with our results in BRAF-positive RKO CRC cells (13), the coimmunoprecipitation experiment of Fig. S4 shows that MAFG, BACH1, CHD8, and DNMT3B were stably associated with one another in SK-MEL-28 melanoma cells.
Fig. S3.
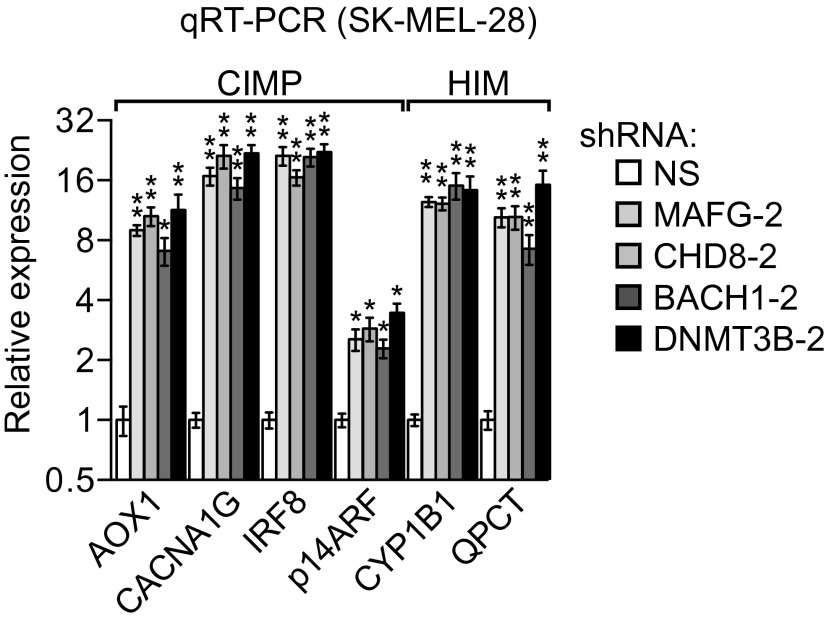
Validation of the results of Fig. 1 using a second, unrelated shRNA. qRT-PCR analysis monitored expression of representative CIMP and HIM genes in SK-MEL-28 cells expressing a second MAFG, CHD8, BACH1, or DNMT3B shRNA unrelated to the shRNA used in Figs. 1 A and B and 2A. Data are represented as mean ± SD. *P ≤ 0.05; **P ≤ 0.01.
Fig. S4.
MAFG, BACH1, CHD8, and DNMT3B are stably associated in SK-MEL-28 cells. Coimmunoprecipitation analysis. SK-MEL-28 cell extracts were immunoprecipitated with a MAFG, BACH1, CHD8, DNMT3B, or control (IgG) Ab, and the immunoprecipitate (IP) was analyzed for MAFG, BACH1, CHD8, or DNMT3B by immunoblotting.
BRAF(V600E)-Mediated Up-Regulation of MAFG Is Required for Epigenetic Silencing.
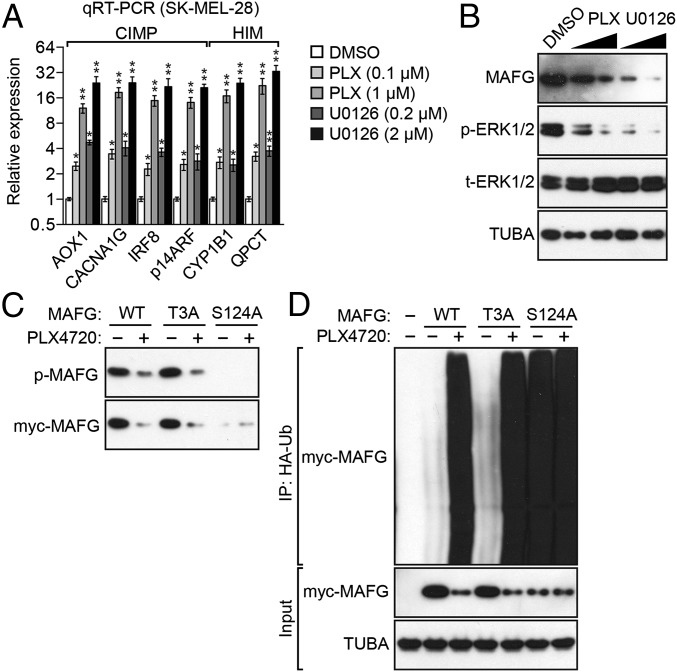
We next investigated the relationship between BRAF(V600E), MAFG, and epigenetic silencing in SK-MEL-28 cells. The qRT-PCR results of Fig. 3A show that inhibition of BRAF/MEK/ERK signaling, using either the BRAF(V600E) inhibitor PLX4720 (20) or the MEK inhibitor U0126 (21), led to derepression of representative epigenetically silenced CIMP and HIM genes. Moreover, as in BRAF-positive CRC cells (13), inhibition of BRAF/MEK/ERK signaling also resulted in decreased levels of MAFG protein in SK-MEL-28 cells (Fig. 3B).
Fig. 3.
BRAF(V600E)-mediated up-regulation of MAFG is required for epigenetic silencing. (A) qRT-PCR analysis monitoring expression of CIMP and HIM genes in SK-MEL-28 cells treated with DMSO, PLX4720, or U0126. The results were normalized to the results obtained with DMSO, which was set to 1. Data are represented as mean ± SD. *P ≤ 0.05; **P ≤ 0.01. (B) Immunoblot analysis monitoring MAFG levels in SK-MEL-28 cells treated with DMSO, PLX4720, or U0126. As controls, the levels of phosphorylated and total ERK1/2 (p-ERK1/2 and t-ERK1/2, respectively) and TUBA were also monitored. (C) SK-MEL-28 cells were transfected with myc-tagged MAFG-WT, MAFG-T3A, or MAFG-S124A; treated in the presence or absence of PLX4720; and analyzed by immunoblotting with a phosphorylated-(S/T)P Ab. (D) HA-ubiquitination pull-down assay. Extracts from SK-MEL-28 cells expressing HA-tagged ubiquitin (HA-Ub) and myc-tagged MAFG-WT, MAFG-T3A, or MAFG-S124A and treated in the presence or absence of PLX4720 were immunoprecipitated using an HA Ab, and the immunoprecipitate (IP) was analyzed by immunoblotting using a myc Ab.
We next analyzed phosphorylation of MAFG in SK-MEL-28 cells. MAFG has two potential ERK phosphorylation sites at T3 and S124. We previously showed that in BRAF-positive RKO CRC cells, ERK1 phosphorylates MAFG at S124 (13). Fig. 3C shows that ectopically expressed WT MAFG and a MAFG-T3A mutant, but not a MAFG-S124A mutant, were phosphorylated in untreated SK-MEL-28 cells. As expected, phosphorylation of MAFG and MAFG-T3A was greatly reduced following PLX4720 addition.
We previously found that in BRAF-positive RKO CRC cells, phosphorylation of MAFG at S124 by ERK1 increased levels of MAFG by preventing its polyubiquitination and subsequent proteasomal-mediated degradation (13). Consistent with these previous results, addition of PLX4720 increased polyubiquitination of MAFG and MAFG-T3A (Fig. 3D). By contrast, MAFG-S124A, which cannot be phosphorylated by ERK (Fig. 3C), was highly polyubiquitinated in untreated SK-MEL-28 cells, and poly-ubiquitination was not further increased by PLX4720 addition. Collectively, these results indicate that in SK-MEL-28 cells, as in BRAF-positive CRC cells, phosphorylation of MAFG at S124 by BRAF/MEK/ERK signaling increases levels of MAFG by preventing its polyubiquitination and subsequent proteasomal-mediated degradation.
Validation of the Role of MAFG and Its Corepressors in Epigenetic Silencing in Other BRAF-Positive Melanoma Cell Lines.
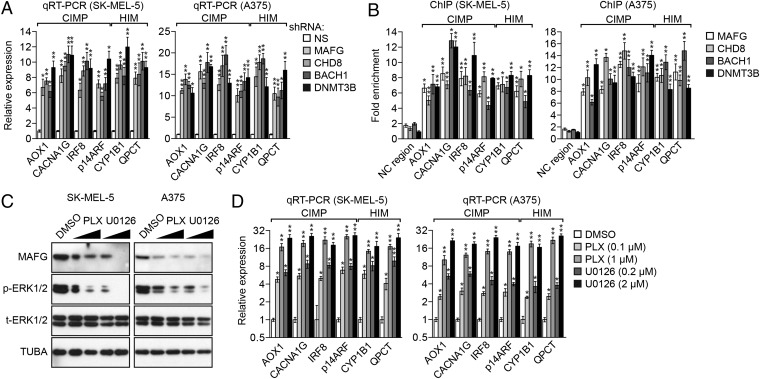
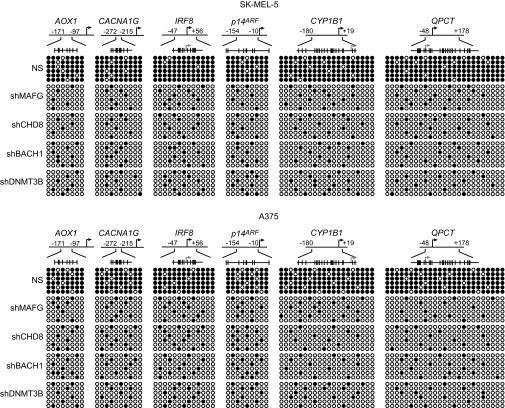
To determine the generality of these results, we repeated several of the key experiments in BRAF-positive SK-MEL-5 and A375 melanoma cells. Fig. 4A shows that knockdown of MAFG or its corepressors derepressed representative epigenetically silenced CIMP and HIM genes in both cell lines. Bisulfite sequencing showed, as expected, that methylation of these genes was significantly reduced following knockdown of MAFG, CHD8, BACH1, or DNMT3B (Fig. S5). The ChIP experiment of Fig. 4B shows that MAFG and it corepressors were associated with the promoters of representative epigenetically silenced genes in both SK-MEL-5 and A375 cells. Finally, treatment of SK-MEL-5 and A375 cells with PLX4720 or U0126 resulted in reduced MAFG levels (Fig. 4C) and derepression of epigenetically silenced genes (Fig. 4D). Collectively, these results confirm the general role of the MAFG-directed epigenetic silencing pathway in BRAF-positive melanoma cell lines.
Fig. 4.
Validation of the role of MAFG and its corepressors in epigenetic silencing in other BRAF-positive melanoma cell lines. (A) qRT-PCR analysis monitoring expression of representative CIMP and HIM genes in SK-MEL-5 (Left) and A375 (Right) cells expressing a MAFG, CHD8, BACH1, or DNMT3B shRNA. (B) ChIP analysis monitoring binding of MAFG, CHD8, BACH1, and DNMT3B on representative CIMP and HIM gene promoters in SK-MEL-5 (Left) and A375 (Right) cells. (C) Immunoblot analysis monitoring MAFG, p-ERK1/2, and t-ERK1/2 levels in SK-MEL-5 (Left) and A375 (Right) cells treated with DMSO, PLX4720, or U0126. (D) qRT-PCR analysis monitoring expression of CIMP and HIM genes in SK-MEL-5 (Left) and A375 (Right) cells treated with DMSO, PLX4720, or U0126. Data are represented as mean ± SD. *P ≤ 0.05; **P ≤ 0.01.
Fig. S5.
Bisulfite sequencing analysis of representative CIMP and HIM genes in additional human melanoma cell lines. Bisulfite sequencing analysis of representative CIMP and HIM genes in SK-MEL-5 (Upper) and A375 (Lower) cells expressing a NS, MAFG, CHD8, BACH1, or DNMT3B shRNA. (Upper) Schematic of each promoter; positions of CpGs are shown to scale by vertical lines. Each circle represents a methylated (●) or unmethylated (○) CpG dinucleotide. Each row represents a single clone.
Role of the MAFG-Directed Epigenetic Silencing Pathway in Melanomagenesis.
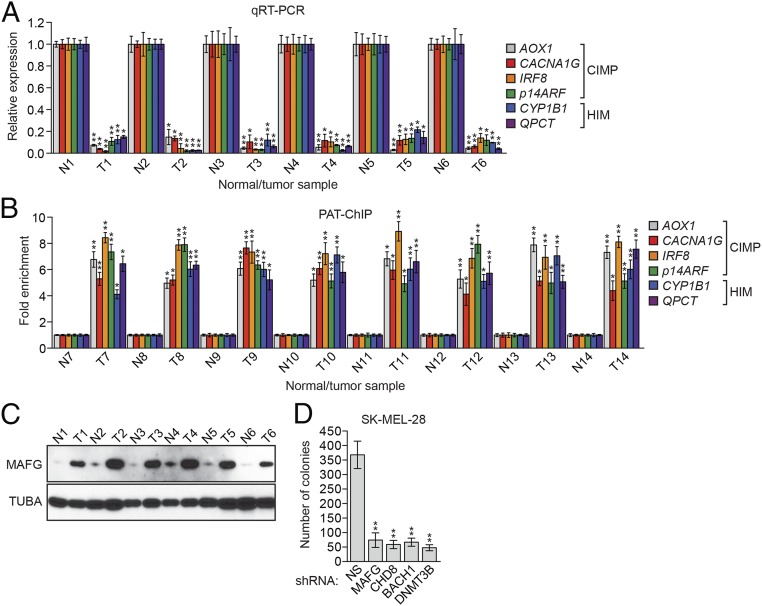
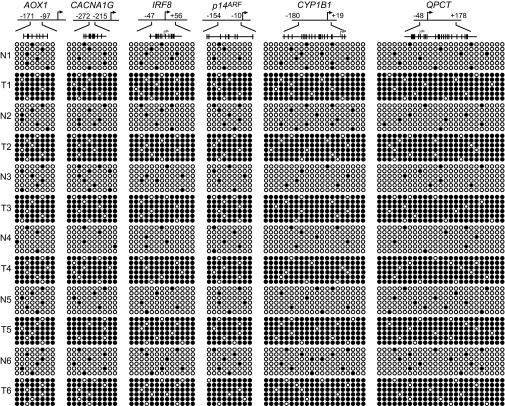
We next performed a series of experiments to evaluate the relevance of our findings to the development of melanomas containing BRAF(V600E). First, we analyzed expression levels of representative CIMP and HIM genes in snap-frozen BRAF-positive human melanoma samples. The qRT-PCR results of Fig. 5A show that the expression levels of the genes we analyzed were significantly lower in BRAF-positive melanomas than in matching normal tissues. Bisulfite sequencing showed that the promoters of these genes were hypermethylated in BRAF-positive mutant tumors compared with matching normal tissues (Fig. S6).
Fig. 5.
Role of the MAFG-directed epigenetic silencing pathway in melanomagenesis. (A) qRT-PCR analysis monitoring expression of representative CIMP and HIM genes in snap-frozen matched adjacent normal (N) and BRAF-positive human melanoma tumor (T) samples. (B) PAT-ChIP analysis monitoring binding of MAFG to representative CIMP and HIM gene promoters in FFPE matched adjacent N and BRAF-positive human melanoma T samples. (C) Immunoblot analysis monitoring MAFG levels in snap-frozen samples. (D) Soft agar assay measuring colony formation of SK-MEL-28 cells expressing a NS, MAFG, CHD8, BACH1, or DNMT3B shRNA. Data are represented as mean ± SD. *P ≤ 0.05; **P ≤ 0.01.
Fig. S6.
Bisulfite sequencing analysis of representative CIMP and HIM genes in snap-frozen human samples. Bisulfite sequencing analysis of representative CIMP and HIM genes in snap-frozen matched adjacent normal (N) and BRAF-positive human melanoma tumor (T) samples is shown. (Upper) Schematic of each promoter; positions of CpGs are shown to scale by vertical lines. (Lower) Each circle represents a methylated (●) or unmethylated (○) CpG dinucleotide. Each row represents a single clone.
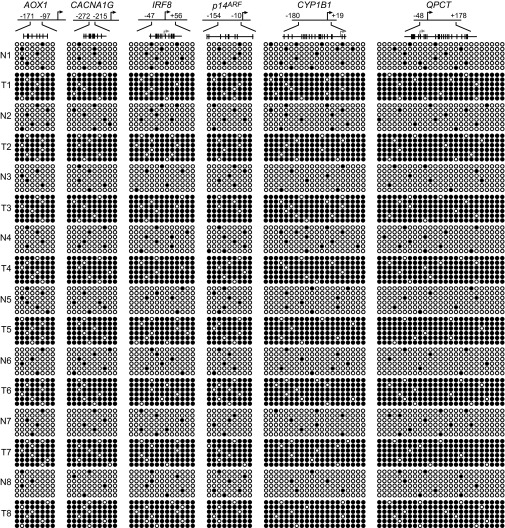
We next used a pathology tissue ChIP (PAT-ChIP) assay (13, 22) to measure association of MAFG with the promoters of representative CIMP and HIM genes in formalin-fixed paraffin embedded (FFPE) BRAF-positive human melanoma samples. Fig. 5B shows that MAFG was substantially enriched at these promoters in melanoma tumor samples relative to adjacent normal skin. Consistent with these results, these promoters were methylated in tumors but not in matched normal tissues (Fig. S7). Finally, the immunoblot of Fig. 5C shows that MAFG levels were higher in BRAF-positive melanoma samples relative to adjacent normal skin.
Fig. S7.
Bisulfite sequencing analysis of representative CIMP and HIM genes in FFPE human samples. Bisulfite sequencing analysis of representative CIMP and HIM genes in FFPE matched adjacent N and BRAF-positive human melanoma T samples. (Upper) Schematic of each promoter; positions of CpGs are shown to scale by vertical lines. (Lower) Each circle represents a methylated (●) or unmethylated (○) CpG dinucleotide. Each row represents a single clone.
We predicted that loss of MAFG, CHD8, BACH1, or DNMT3B, which results in derepression of multiple tumor-suppressor genes, would reduce the transformed phenotype. Consistent with this prediction, knockdown of each of these factors substantially reduced the ability of SK-MEL-28 cells to proliferate in soft agar (Fig. 5D).
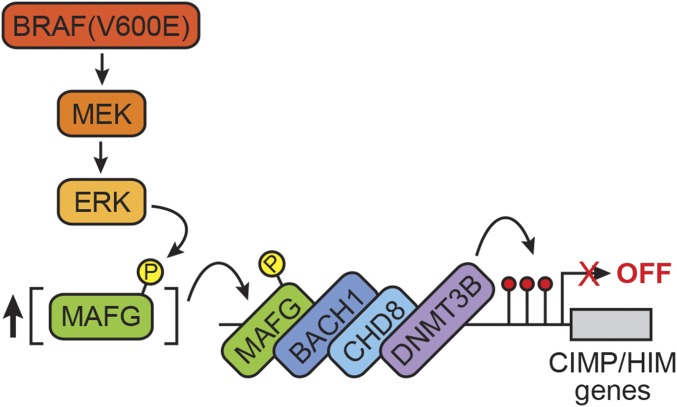
In this study, we have shown that the same epigenetic silencing pathway that mediates widespread promoter methylation and transcriptional repression in BRAF-positive CRCs (13) also directs epigenetic silencing of a similar set of genes in BRAF-positive melanoma. In this pathway, shown in Fig. 6, increased BRAF/MEK/ERK signaling results in ERK-directed phosphorylation at S124 of MAFG, a transcriptional repressor with sequence-specific DNA-binding activity. Phosphorylation of MAFG at S124 prevents polyubiquitination and subsequent proteasomal-mediated degradation, leading to increased MAFG levels, which drives DNA binding. DNA-bound MAFG recruits a corepressor complex that includes BACH1, CHD8, and DNMT3B, leading to promoter hypermethylation and transcriptional silencing of CIMP and HIM genes. The pathway we describe explains why CIMP and HIM genes are silenced in BRAF-positive CRCs and melanomas but transcriptionally active in normal cells containing WT BRAF.
Fig. 6.
Model for BRAF(V600E)-directed recruitment of MAFG and its corepressors to CIMP and HIM gene promoters. Increased BRAF/MEK/ERK signaling results in ERK-directed phosphorylation of MAFG. Phosphorylation of MAFG prevents its polyubiquitination and subsequent proteasomal-mediated degradation, leading to increased MAFG levels, which drives DNA binding. DNA-bound MAFG recruits a corepressor complex that includes BACH1, CHD8, and DNMT3B, leading to promoter hypermethylation and transcriptional silencing of CIMP and HIM genes.
In many cancers, it is well established that specific genes affecting cellular growth control are hypermethylated and transcriptionally silenced (23, 24). However, the mechanistic basis of epigenetic silencing is not well understood. According to one model, an epigenetic event, such as hypermethylation of a CpG-rich promoter region of a tumor suppressor gene, occurs randomly due, for example, to loss of fidelity or mutation of an epigenetic enzyme. The hypermethylation results in silencing of the tumor suppressor gene, which confers a selectable growth advantage (reviewed in 3). In a second so-called instructive model, transcriptional silencing occurs through a specific pathway, comprising a defined set of components, initiated by an oncoprotein (25). The finding that BRAF(V600E) can direct widespread transcriptional repression through a common pathway in unrelated solid tumor types provides particularly strong support for the instructive model of oncoprotein-directed epigenetic silencing.
Materials and Methods
Cell Line Culture and Drug Treatment.
SK-MEL-28, SK-MEL-5, A375, and RKO cells were obtained from the American Type Culture Collection and grown as recommended by the supplier. For drug treatments in Figs. 3 and 4, cells were treated with 0.1 or 1 μM PLX4720 (Selleckchem) or 0.2 or 2 μM U0126 (Cell Signaling Technology) for 24 h. For the experiment shown in Fig. S2D, cells were treated with 10 μM 5-azacytidine (Sigma) for 96 h with changes of fresh 5-azacytidine every 24 h.
qRT-PCR.
Total RNA was isolated, and RT was performed as described (26), followed by qRT-PCR using Power SYBR Green PCR Master Mix (Applied Biosystems). GAPDH was used as an internal reference gene for normalization. Gene primer sequences are shown in Table S1.
Table S1.
List of primers used for qRT-PCR, ChIP, bisulfite sequencing, and methylated DNA immunoprecipitation
| Gene | Forward (5′ → 3′) | Reverse (5′ → 3′) |
| qRT-PCR | ||
| ABTB2 | GCTGGTCAGTTTGTTGCTGA | TGGCTGAAGCAGTTCATGTC |
| ADAMTS1 | GGATGGCTGATGTTGGAACT | TAATTCATGGGCTGTGGTGA |
| ALOX12B | GGCAGAGGACACCTTCTTTG | GTCTGTGACGGGGAACTTGT |
| ALX4 | AGAGAGCAACAAGGGCAAGA | CACGTCTGGGTAGTGGGTCT |
| AOX1 | TCACTCACGGTGGAATTGAA | CAGGTGGACATTCGACATTG |
| BACH1 | TGCGATGTCACCATCTTTGT | CCTGGCCTACGATTCTTGAG |
| BNIP3 | TTCCTTCCATCTCTGCTGCT | ATCAAAAGGTGCTGGTGGAG |
| C20orf197 | CCACTTCCCAAGTGTTGGTT | ACGAATGCTGAGAAGCCAGT |
| CACNA1G | AAGCAGACAGTGGAGCCTGT | TCTGAGTCAGGCATTTCACG |
| CDO1 | GTACGCCAAGTTCGACCAGT | GTCCTTCACCCCAACAGAGA |
| CHD8 | GAGCCTATCCTCCCTGAACCA | AGAACTGCATGGAAGGCAAAG |
| CHFR | CCTCTGTGGCAAGTGATGAA | TCCAAATCCTCCTGATCCTG |
| CIDEB | GGAACTGCAGTGGACAGTGA | CACTCCTTGTAGGGCTCCAG |
| CLDN23 | TTGCCATGCAAACTCTCAAG | CCATTAAGCTGCTGGCATTT |
| COL1A2 | GTGGCCCAGAAGAACTGGTA | CGCCATACTCGAACTGGAAT |
| COL4A2 | AAGGAATCATGGGCTTTCCT | CTCTGGCACCTTTTGCTAGG |
| CRABP1 | GCAAGTGCAGGAGTTTAGCC | CACGGGTCCAGTAGGTTTTG |
| CRHR1 | CTCCTGGGCATCACCTACAT | GGAAGGATTCCAGGAAGGAG |
| CYP1B1 | TGATGGACGCCTTTATCCTC | GTGATAGTGGCCGGTACGTT |
| DAPK1 | AATGGAGTTGGCGATTTCAG | ATGGATTGACGTGGGATCAT |
| DDIT4L | GAAACAGAGCCGTTGACCAT | CAGGCTCTCTGGGTGATAGC |
| DFNA5 | GAATGAGGTCCTGTGCGTTT | GATGCCACCACACTTCTCCT |
| DNMT3B | CAGGGAAAACTGCAAAGCTC | TGTCTGAATTCCCGTTCTCC |
| DUSP26 | CGGTTTCTGCCACCTCTAAG | CAGGCTGTCTTGCCTGTGTA |
| EDIL3 | TTGGCTGATGGTTCCTTTTC | ATGGCATGGATTAGGAGTGC |
| EFEMP1 | CAGGGACGCACAACTGTAGA | ATTGAAACCCAGGACTGCAC |
| EFHD1 | GATGGCTTCATCGACCTGAT | GTCCTCATCCACCTCCTTGA |
| ELMO1 | CTGCTCAGCATGGAAATCAA | TCATAGTTGCTGGGCTCCTT |
| EPHB1 | CCTCCCTAATGTCCCAGGAT | CCTCAGACCAGAAGGCTGAC |
| FBN2 | TCCTGGATATCAGGCTACGC | TGAATTTGTGCACTGGGTGT |
| FGF4 | CTACAAGTACCCCGGCATGT | GAGGAAGTGGGTGACCTTCA |
| GDF15 | GAGCTGGGAAGATTCGAACA | AGAGATACGCAGGTGCAGGT |
| GJB5 | GGACTGCTTCATCTCCAAGC | AGATGAGCTCCACGAGGTTG |
| GRHL2 | ATGGCTACCTCACAGCCTTG | TAAGTGCTCTTGCCCCAACT |
| GRM4 | GAGGGCAGCTATGGTGAGAG | CCGTGGTATCTTCACCGACT |
| HAND1 | GTCCGCAGAAGGGTTAAACA | GGCAAGGCTGAAAATGAGAC |
| HLTF | CAGTGGAGGGGTCAAAGAAA | TGTCCAAACTGGTCAATCCA |
| HSPB6 | CCTCCTCAGGCTCCCTCTAT | GAATCCAGGAGTGGGTGAGA |
| ID4 | GGGTGGGCTACTTTTCTTCC | GTCGCTCTGGGTTTTACGAG |
| IGFBP3 | AGGGCACTCTGGGAACCTAT | TGCAGTCATCCGAAGAATTG |
| IGFBP7 | GGCATGGAGTGCGTGAAGAG | CTTGCTGACCTGGGTGATGG |
| IGLL1 | CTCCAAGCCAACAAGGCTAC | TACCATCTGCCTTCCAGGTC |
| IRF8 | AGTGGCTGATCGAGCAGATT | AGTGGCTGGTTCAGCTTTGT |
| LOX | ATATTCCTGGGAATGGCACA | CCAGGACTCAATCCCTGTGT |
| LRP2 | AAACAATGGTGGGTGCTCTC | TTCTTGCCATCACTTTGCAG |
| LXN | TGAAGGAGCTTGCGACTTTT | GCTTGGGCTACTCTGGCTTA |
| MAFG | TGTGTTTTGTATGTTGGGATTGG | CATGGCCCTGGTACAAAAGG |
| MLH1 | CAGAGGAAGATGGTCCCAAA | CAGGTTCCCTTCCTCATCAA |
| MT1G | CCCTGCTCCCAAGTACAAAT | GGAATGTAGCAAAGGGGTCA |
| NDNF | CGCTCCCTGCAGTTTAAAAG | AAGTTGCTGCGAAGTGGAGT |
| NEUROG1 | GTTACTTTCCCCCTCCCCTA | CTTTAAAGCTCCCGCTTCCT |
| NPM2 | TGCAGGCTGTTGCTTCATAC | TCTTGTCCTCCTGGTTTGCT |
| OVOL1 | CAGGGCTTCTAATGCTCAGG | AGTGCACACACACAAGCACA |
| p14ARF | CCCTCGTGCTGATGCTACTG | ACCTGGTCTTCTAGGAAGCGG |
| p16INK4A | CACATTCATGTGGGCATTTC | CCCCTGAGCTTCCCTAGTTC |
| PCDHAC2 | ACCTAGAGGAGGCTGGCATT | GACACTTCTCCTGCCTCTGG |
| PCSK1 | CTTGCTGGGCAGTATCCAAT | TGCGGGTAGTTTGTTTTTCC |
| PENK | AAGCCAAAGAGCTGCAGAAG | TTCAGGAAACCTCCATACCG |
| PPP1R3C | TTGCAAGAGCGAACAGTGAC | TGCTCAGTTGGAATGACAGG |
| PPP1R14A | CTGGACGTGGAGAAGTGGAT | AGCAGCTCCTGGATGAAGTC |
| PRDM2 | AGGTGCCTCCAGAACTAGCA | CCCCAAATCATTCACCTCAC |
| QPCT | AAGGGTGGAGAAGAGGGAAG | GCCATCTCTCCGAGTCTGTC |
| RASSF2 | GGTCTTCCTGCACTTGAAGC | GCATCTCCACACACAAGGTG |
| SEPT9 | CATCACGCACGATATTGAGG | CCAGCAGTTCTCGTTGTTGA |
| SFRP1 | AAGGGAGGCTCTCTGTAGGC | AATGACCAGGCCAATCAGTC |
| SFRP2 | GGGTCTGGTTGGTTGTTGTT | GGGCCACAGAGAAAATTGAA |
| SLC6A11 | AGCTGGGTAGTGGTTCATGC | ATCTCGGCTCACTGCAACTT |
| SLC6A18 | TGTTCCCTTACCTGGTCCTG | ATGTGCATGTTGGGAGTGAA |
| SLC18A2 | GTCCCCATCATCCCAAGTTA | TGTCTGAGATGGAGGCAGTG |
| SLC30A10 | ATCCACAATGTGACCATCCA | CTTGGAGATGCAGGGTGAGT |
| SOCS1 | CTCCTTCCCCTTCCAGATTT | CACATGGTTCCAGGCAAGTA |
| SPON1 | CACATTTGATGGGGTGACTG | TGTCTTCTCGGACCAATTCC |
| STOX2 | GGCGAACTCAACTCTTGTCC | TTCTTTCCCAGAGGTGATGG |
| THBD | CGGGTTGTGTGTCTGTTCAC | CCTCCATGCATCTCATAGCA |
| THBS1 | ACCAAAGCCTGCAAGAAAGA | TCTGTACCCCTCCTCCACAG |
| THBS2 | AAGTGTGTGAGCCCGAAAAC | GTACATGGGGTCGCTGAAGT |
| TLE4 | GTTTCCGAGGTGCTGAGAAG | GCTGTCATAACGAGCTGCAA |
| TMEFF2 | CAATGGGGAGAGCTACCAGA | TCTGTGGCACATGATCCTTC |
| TOLLIP | CGGTGGTACAGAGAGCCTTC | ACCACTTGTCCTCCACCTTG |
| TP73-AS1 | GGGTAACTCCCCACTGTTGA | GGCTGAGCTGGACAAAAGAC |
| TRIM40 | TGTGCAGGTTCTGTGAGGAG | AGGGCATTTTCAATGGTCAG |
| TSPYL5 | TCCCACTTTCAGCAGTCCTT | CCCAGGAGAAGCTTGAGATG |
| TUB | GAGGGAGAGGAAGCACACTG | ATTCACTGTGCCCCTACCTG |
| UCHL1 | AGCGTGAGCAAGGAGAAGTC | TTGAAGGGAAGAGGGGAAAT |
| VIM | GGCCCAGCTGTAAGTTGGTA | CCTAGCGGTTTAGGGGAAAC |
| WNT10B | GTCACTCTTGGTCCCTGGAA | GTTGGGGAGAAGGCTACACA |
| ZSCAN18 | GCTTTCCTGCAGCCATTTAG | TTGAAGAAAGCACTGGCAGA |
| ChIP | ||
| AOX1 | ATCCTGGCTGTGGGTAACTG | TATCGCTAGCGCATTCTCCT |
| CACNA1G | GTCTGGGCAGCAGTCTGATT | GGAGAGAACCACAGCTGGAA |
| CYP1B1 | CTGCGACTCCAGTTGTGAGA | GCAAAGTCGAGGTTTCCTCA |
| IRF8 | AATATCCAGCGCTCGTGAAG | GGCCCATTAATCAGAATCCA |
| P14ARF | GTGGGTCCCAGTCTGCAGTTA | CCTTTGGCACCAGAGGTGAG |
| QPCT | AAGGGTGGAGAAGAGGGAAG | GCCATCTCTCCGAGTCTGTC |
| Bisulfite sequencing | ||
| CYP1B1 | GTTTTTATGAAAGTTTGTTGGTAGAG | CCCACTCCCACTCCAAAATC |
| QPCT | GGGGTAGGAGGGTTGTAGTTTG | ACCAACAACAACAAATAAAAAATACC |
| Methylated DNA immunoprecipitation | ||
| CIDEB (−460 to −559) | CTGGAAAATGAAGCCAGAGC | TAGGGTCCTGTCTGGGACAC |
| EFHD1 (−616 to −720) | CCACTATGCCTGGCTGATTT | GTGTTGGTGGCAGGATCTTT |
| PRDM2 (321–428) | AGGTCACTTGTCCCCTGTTG | TCCAAATTGCCTGCCTATTC |
| SEPT9 (−729 to −817) | CGTTGGAAACACCGCTTTAT | CAGTGGTGAGAGGATGCAAA |
Bisulfite Sequencing.
Bisulfite modification was carried out using an EpiTect Bisulfite Kit (QIAGEN), followed by assay kits from EpigenDX for AOX1 (ADS2444), CACNA1G (ADS2300), IRF8 (ADS1254), p14ARF (ADS2130), or PCR primers for CYP1B1 and QPCT (Table S1). Multiple independent clones were sequenced from each PCR product within each cell line, of which six representative clones are displayed.
Methylated DNA Immunoprecipitation.
Genomic DNA was isolated and processed using the MethylMiner Methylated DNA Enrichment Kit (Invitrogen). The DNA eluate was analyzed by qRT-PCR using a primer pair (Table S1) that amplifies the promoter or 5′ UTR of the CIDEB, EFHD1, PRDM2, or SEPT9 gene.
ChIP Assays.
ChIP assays were performed as previously described (26) using the following Abs: MAFG (Santa Cruz Biotechnology), BACH1 (Santa Cruz Biotechnology), CHD8 (Bethyl Laboratories), and DNMT3B (Abcam). ChIP products were analyzed by quantitative PCR (primer sequences are shown in Table S1). Samples were quantified as the percentage of input, and then normalized to an irrelevant region in the genome (∼3.2 kb upstream from the transcription start site of GCLC). Fold enrichment was calculated by setting the IgG control immunoprecipitation sample to a value of 1.
Immunoblot Analysis.
Cell extracts were prepared by lysis in Laemmli buffer in the presence of protease inhibitor mixture (Roche). The following commercial Abs were used: MAFG, BACH1, CHD8, DNMT3B, phospho-ERK1/2 and total ERK1/2 (both from Cell Signaling Technology), myc (Roche), and α-tubulin (TUBA; Sigma).
Coimmunoprecipitation Assays.
SK-MEL-28 cell lysate was immunoprecipitated with a MAFG, BACH1, CHD8, DNMT3B, or control Ab (IgG; Millipore), and the immunoprecipitate was analyzed for MAFG, BACH1, CHD8, or DNMT3B by immunoblotting. Input lanes represent 5% of immunoprecipitated lanes.
In Vivo Kinase Assay.
The in vivo kinase assay was performed as previously described (13). Briefly, a plasmid encoding myc-tagged WT MAFG (pGIPZ-CMV-MAFG-WT), MAFG-T3A (pGIPZ-CMV-MAFG-T3A), or MAFG-S124A (pGIPZ-CMV-MAFG-S124A) was transfected into SK-MEL-28 cells, and cells were treated with 1 μM PLX4720 24 h later. Cell lysate was immunoprecipitated with a myc Ab, and immunoprecipitates were analyzed by immunoblotting with a phospho-(S/T)P Ab (Abcam).
HA-Ubiquitin Pull-Down Assays.
HA-ubiquitin pull-down assays were performed as previously described (13). Briefly, SK-MEL-28 cells were transfected with 5 μg of pGIPZ-CMV-MAFG-WT, pGIPZ-CMV-MAFG-T3A, or pGIPZ-CMV-MAFG-S124A; 5 μg of pcDNA3.1-HA-Ubiquitin (Addgene); and 0.5 μg of pEGFP-N1 (Clontech). To ensure equivalent transfection efficiency, EGFP expression was monitored 48 h later. PLX4720 (1 μM) was added to cells 24 h posttransfection, and cells were incubated for another 24 h. Cells were harvested, and pull-downs were performed using an HA Ab (Cell Signaling Technology) and anti-rabbit Trublot beads (eBioscience). Beads were incubated with lysate for 18 h, washed three times using NETN-150 buffer (20 mM Tris-HCl pH 8, 150 mM NaCl, 1 mM EDTA, 0.5% Nonidet P-40), and eluted in 2× sample buffer. Input samples were probed with a myc or TUBA Ab, and immunoprecipitated samples were probed with a myc Ab.
Melanoma Sample Analysis.
This study was approved by the Institutional Review Board at the University of Massachusetts Medical School (UMMS). Human samples were obtained with informed consent. Archived specimens with sufficient tissue for analysis were obtained from the Department of Pathology at UMMS, and the melanoma diagnosis was made by a UMMS pathologist (Table S2). BRAF mutational analysis was performed by the UMass Memorial Laboratory of Diagnostic Molecular Oncology.
Table S2.
List of melanoma tumor samples used in this study
| Tumor sample | Diagnosis | Melanoma type | Metastatic? | Tissue | Melanoma location | Mutated gene | Coding sequence change | Codon change |
| T1 | Malignant melanoma | Nodular | Yes | Lymph node | Right anterior medial thigh | BRAF | c.1799T > TA | 600V > E |
| T2 | Malignant melanoma | Nodular | Yes | Skin | NA | BRAF | c.1799T > TA | 600V > E |
| T3 | Malignant melanoma | Nodular | Yes | Skin | Right posterior shoulder | BRAF | c.1799T > TA | 600V > E |
| T4 | Malignant melanoma | NA | Yes | Skin | Left brain | BRAF | c.1799T > TA | 600V > E |
| T5 | Malignant melanoma | Nodular | Yes | Skin | Left groin lymph | BRAF | c.1799T > TA | 600V > E |
| T6 | Malignant melanoma | Nodular | Yes | Skin | Left groin lymph | BRAF | c.1799T > TA | 600V > E |
| T7 | Malignant melanoma | NA | Yes | Brain | NA | BRAF | c.1799T > TA | 600V > E |
| T8 | Malignant melanoma | Nodular | Yes | Skin | Right calf | BRAF | c.1799T > TA | 600V > E |
| T9 | Malignant melanoma | Nodular | No | Skin | Right posterior shoulder | BRAF | c.1799T > TA | 600V > E |
| T10 | Malignant melanoma | Nodular | Yes | Skin | Right flank | BRAF | c.1799T > TA | 600V > E |
| T11 | Malignant melanoma | Superficial spreading | No | Skin | Left vulva | BRAF | c.1799T > TA | 600V > E |
| T12 | Malignant melanoma | Superficial spreading | No | Skin | Left preauricular cheek | BRAF | c.1799T > TA | 600V > E |
| T13 | Malignant melanoma | NA | Yes | Right chest wall/flank | Right chest wall/flank mass | BRAF | c.1799T > TA | 600V > E |
| T14 | Malignant melanoma | Nodular | Yes | Lymph node | Left axillary lymph node | BRAF | c.1799T > TA | 600V > E |
NA, not available.
PAT-ChIP Assay.
FFPE tissue sections of matched adjacent normal tissue and tumor samples isolated from individuals with invasive or metastatic BRAF-positive melanoma were deparaffinized in Histolemon-Erba RS solution (Carlo Erba Reagents) four times for 10 min at room temperature. The tissue was then resuspended in 100% (vol/vol) ethanol, incubated for 10 min at room temperature, spun down, and resuspended in 95% (vol/vol) ethanol. The washing/resuspension steps were repeated, gradually increasing the percentage of water [to achieve 70%, 50%, 20%, and 0% (vol/vol) ethanol] to rehydrate the tissue. The resulting material was then processed as previously described (22).
Soft Agar Assay.
For each knockdown cell line, 1 × 10³ cells were mixed with the 0.45% agar solution and seeded in a six-well plate in triplicate on top of solidified 0.9% base agar. After incubation at 37 °C and 5% CO2 for 14 d, colonies were stained with 0.003% crystal violet, examined, and quantified under a microscope.
Statistics.
All quantitative data were collected from experiments performed in at least triplicate, and expressed as mean ± SD. Differences between groups were assayed using a two-tailed Student t test utilizing Microsoft Excel. Significant differences were considered when P < 0.05, *P ≤ 0.05, and **P ≤ 0.01.
Acknowledgments
We thank the University of Massachusetts Medical School (UMMS) RNAi Core Facility for providing shRNA clones and Sara Deibler for editorial assistance. This work was supported by Grant R01GM033977 from the NIH (to M.R.G.), who is also an investigator of the Howard Hughes Medical Institute.
Footnotes
The authors declare no conflict of interest.
This article contains supporting information online at www.pnas.org/lookup/suppl/doi:10.1073/pnas.1525619113/-/DCSupplemental.
References
- 1.Baylin SB, Jones PA. A decade of exploring the cancer epigenome - biological and translational implications. Nat Rev Cancer. 2011;11(10):726–734. doi: 10.1038/nrc3130. [DOI] [PMC free article] [PubMed] [Google Scholar]
- 2.Esteller M. Epigenetics in cancer. N Engl J Med. 2008;358(11):1148–1159. doi: 10.1056/NEJMra072067. [DOI] [PubMed] [Google Scholar]
- 3.Hassler MR, Egger G. Epigenomics of cancer - emerging new concepts. Biochimie. 2012;94(11):2219–2230. doi: 10.1016/j.biochi.2012.05.007. [DOI] [PMC free article] [PubMed] [Google Scholar]
- 4.Sharma S, Kelly TK, Jones PA. Epigenetics in cancer. Carcinogenesis. 2010;31(1):27–36. doi: 10.1093/carcin/bgp220. [DOI] [PMC free article] [PubMed] [Google Scholar]
- 5.Toyota M, et al. CpG island methylator phenotype in colorectal cancer. Proc Natl Acad Sci USA. 1999;96(15):8681–8686. doi: 10.1073/pnas.96.15.8681. [DOI] [PMC free article] [PubMed] [Google Scholar]
- 6.Lao VV, Grady WM. Epigenetics and colorectal cancer. Nat Rev Gastroenterol Hepatol. 2011;8(12):686–700. doi: 10.1038/nrgastro.2011.173. [DOI] [PMC free article] [PubMed] [Google Scholar]
- 7.De Roock W, Biesmans B, De Schutter J, Tejpar S. Clinical biomarkers in oncology: Focus on colorectal cancer. Mol Diagn Ther. 2009;13(2):103–114. doi: 10.1007/BF03256319. [DOI] [PubMed] [Google Scholar]
- 8.Rizzo S, et al. Prognostic vs predictive molecular biomarkers in colorectal cancer: Is KRAS and BRAF wild type status required for anti-EGFR therapy? Cancer Treat Rev. 2010;36(Suppl 3):S56–S61. doi: 10.1016/S0305-7372(10)70021-9. [DOI] [PubMed] [Google Scholar]
- 9.Tejpar S, et al. Prognostic and predictive biomarkers in resected colon cancer: Current status and future perspectives for integrating genomics into biomarker discovery. Oncologist. 2010;15(4):390–404. doi: 10.1634/theoncologist.2009-0233. [DOI] [PMC free article] [PubMed] [Google Scholar]
- 10.Dhomen N, Marais R. New insight into BRAF mutations in cancer. Curr Opin Genet Dev. 2007;17(1):31–39. doi: 10.1016/j.gde.2006.12.005. [DOI] [PubMed] [Google Scholar]
- 11.Kaneda A, Yagi K. Two groups of DNA methylation markers to classify colorectal cancer into three epigenotypes. Cancer Sci. 2011;102(1):18–24. doi: 10.1111/j.1349-7006.2010.01712.x. [DOI] [PubMed] [Google Scholar]
- 12.Yagi K, et al. Three DNA methylation epigenotypes in human colorectal cancer. Clin Cancer Res. 2010;16(1):21–33. doi: 10.1158/1078-0432.CCR-09-2006. [DOI] [PubMed] [Google Scholar]
- 13.Fang M, Ou J, Hutchinson L, Green MR. The BRAF oncoprotein functions through the transcriptional repressor MAFG to mediate the CpG Island Methylator phenotype. Mol Cell. 2014;55(6):904–915. doi: 10.1016/j.molcel.2014.08.010. [DOI] [PMC free article] [PubMed] [Google Scholar]
- 14.Muthusamy V, et al. Epigenetic silencing of novel tumor suppressors in malignant melanoma. Cancer Res. 2006;66(23):11187–11193. doi: 10.1158/0008-5472.CAN-06-1274. [DOI] [PubMed] [Google Scholar]
- 15.Koga Y, et al. Genome-wide screen of promoter methylation identifies novel markers in melanoma. Genome Res. 2009;19(8):1462–1470. doi: 10.1101/gr.091447.109. [DOI] [PMC free article] [PubMed] [Google Scholar]
- 16.Sigalotti L, et al. Whole genome methylation profiles as independent markers of survival in stage IIIC melanoma patients. J Transl Med. 2012;10:185. doi: 10.1186/1479-5876-10-185. [DOI] [PMC free article] [PubMed] [Google Scholar]
- 17.Thomas NE, et al. DNA methylation profiles in primary cutaneous melanomas are associated with clinically significant pathologic features. Pigment Cell Melanoma Res. 2014;27(6):1097–1105. doi: 10.1111/pcmr.12289. [DOI] [PMC free article] [PubMed] [Google Scholar]
- 18.Davies H, et al. Mutations of the BRAF gene in human cancer. Nature. 2002;417(6892):949–954. doi: 10.1038/nature00766. [DOI] [PubMed] [Google Scholar]
- 19.Wajapeyee N, Serra RW, Zhu X, Mahalingam M, Green MR. Oncogenic BRAF induces senescence and apoptosis through pathways mediated by the secreted protein IGFBP7. Cell. 2008;132(3):363–374. doi: 10.1016/j.cell.2007.12.032. [DOI] [PMC free article] [PubMed] [Google Scholar]
- 20.Tsai J, et al. Discovery of a selective inhibitor of oncogenic B-Raf kinase with potent antimelanoma activity. Proc Natl Acad Sci USA. 2008;105(8):3041–3046. doi: 10.1073/pnas.0711741105. [DOI] [PMC free article] [PubMed] [Google Scholar]
- 21.Favata MF, et al. Identification of a novel inhibitor of mitogen-activated protein kinase kinase. J Biol Chem. 1998;273(29):18623–18632. doi: 10.1074/jbc.273.29.18623. [DOI] [PubMed] [Google Scholar]
- 22.Fanelli M, Amatori S, Barozzi I, Minucci S. Chromatin immunoprecipitation and high-throughput sequencing from paraffin-embedded pathology tissue. Nat Protoc. 2011;6(12):1905–1919. doi: 10.1038/nprot.2011.406. [DOI] [PubMed] [Google Scholar]
- 23.Baylin SB. DNA methylation and gene silencing in cancer. Nat Clin Pract Oncol. 2005;2(Suppl 1):S4–S11. doi: 10.1038/ncponc0354. [DOI] [PubMed] [Google Scholar]
- 24.Esteller M. Epigenetics provides a new generation of oncogenes and tumour-suppressor genes. Br J Cancer. 2006;94(2):179–183. doi: 10.1038/sj.bjc.6602918. [DOI] [PMC free article] [PubMed] [Google Scholar]
- 25.Struhl K. Is DNA methylation of tumour suppressor genes epigenetic? eLife. 2014;3:e02475. doi: 10.7554/eLife.02475. [DOI] [PMC free article] [PubMed] [Google Scholar]
- 26.Gazin C, Wajapeyee N, Gobeil S, Virbasius CM, Green MR. An elaborate pathway required for Ras-mediated epigenetic silencing. Nature. 2007;449(7165):1073–1077. doi: 10.1038/nature06251. [DOI] [PMC free article] [PubMed] [Google Scholar]


