Significance
Though the two-start zigzag geometry of a nucleosome chain is dominant in chromatin fibers in vitro, it remains unknown whether it is preserved in living cells. Our combined nucleosome interaction capture technique and mesoscale modeling reveal that the zigzag motif is persistent in interphase and metaphase chromatin. For metaphase chromosomes, we observe a striking increase in occurrence of long-range internucleosome interactions, inconsistent with hierarchical coiling or a liquid melt. Instead, the data point to a new mechanism for higher-order folding, via hierarchical looping, similar to rope flaking used in mountaineering. This mechanism brings together distant DNA elements in a manner that can be controlled by linker histones and histone modifications. Implications for genomic accessibility and epigenetic functions naturally arise.
Keywords: chromatin higher-order structure, nucleosome, linker histone, mesoscale modeling, electron microscopy
Abstract
The architecture of higher-order chromatin in eukaryotic cell nuclei is largely unknown. Here, we use electron microscopy-assisted nucleosome interaction capture (EMANIC) cross-linking experiments in combination with mesoscale chromatin modeling of 96-nucleosome arrays to investigate the internal organization of condensed chromatin in interphase cell nuclei and metaphase chromosomes at nucleosomal resolution. The combined data suggest a novel hierarchical looping model for chromatin higher-order folding, similar to rope flaking used in mountain climbing and rappelling. Not only does such packing help to avoid tangling and self-crossing, it also facilitates rope unraveling. Hierarchical looping is characterized by an increased frequency of higher-order internucleosome contacts for metaphase chromosomes compared with chromatin fibers in vitro and interphase chromatin, with preservation of a dominant two-start zigzag organization associated with the 30-nm fiber. Moreover, the strong dependence of looping on linker histone concentration suggests a hierarchical self-association mechanism of relaxed nucleosome zigzag chains rather than longitudinal compaction as seen in 30-nm fibers. Specifically, concentrations lower than one linker histone per nucleosome promote self-associations and formation of these looped networks of zigzag fibers. The combined experimental and modeling evidence for condensed metaphase chromatin as hierarchical loops and bundles of relaxed zigzag nucleosomal chains rather than randomly coiled threads or straight and stiff helical fibers reconciles aspects of other models for higher-order chromatin structure; it constitutes not only an efficient storage form for the genomic material, consistent with other genome-wide chromosome conformation studies that emphasize looping, but also a convenient organization for local DNA unraveling and genome access.
The physical packaging of megabase pairs of genomic DNA stored as the chromatin fiber in eukaryotic cell nuclei has been one of the great challenges in biology (1). The limited resolution and disparate levels that can be studied by both experimental and modeling studies of chromatin, which exhibits multiple spatial and temporal scales par excellence, make it challenging to present an integrated structural view, from nucleosomes to chromosomes (2). Because all fundamental template-directed processes of DNA depend on chromatin architecture, advances in our understanding of chromatin higher-order organization are needed to help interpret numerous regulatory events from DNA damage repair to epigenetic control.
At the primary structural level, the DNA makes ∼1.7 left-superhelical turns around eight core histones to form a nucleosome core. The nucleosome cores are connected by linker DNA to form nucleosome arrays. An X-ray crystal structure of the nucleosome core has been solved at atomic resolution (3), and a short, four-nucleosome array has also been solved (4). Next, at the secondary structural level, the nucleosome arrays, aided by linker histones (H1 or H5), form a compact chromatin fiber with a diameter of ∼30 nm and longitudinal compaction of 5–7 nucleosomes per 11 nm (5–8). However, evidence for 30-nm fibers in interphase nuclei of living cells has been controversial (reviewed in refs. 9 and 10). For example, whereas a distinct 30-nm fiber architecture is observed in terminally differentiated cells (11, 12), neither continuous nor periodic 30-nm fibers are observed in the nuclei of proliferating cells (13–15). However, zigzag features of the chromatin fibers are well supported by nucleosome interaction mapping in vitro (16) and in vivo (15).
For chromatin architecture within metaphase chromosomes, fluorescence studies of mitotic chromosome condensation in vivo (17), cryo-EM observations of unfixed and unstained chromosomes in situ (18), and small-angle X-ray scattering (19) show no structures resembling folded 30-nm fibers and instead suggest random folding of soft polymers. Evidence is also accumulating that during chromosome condensation in mitosis, chromatin higher-order structure is dramatically altered at the global level (20) by significant increase in looping (21). A random type of looping, however, cannot explain sharp chromosomal boundaries separating the translocated genomic regions in metaphase chromosomes (22) as well as formation of highly localized fibers of transgenic DNA, up to 250 nm in diameter, detected by fluorescence imaging in vivo (17). In contrast, a hierarchical or layered looping could explain the above aspects of chromosome organization; in addition, it could help reconcile the experiments in living cells with in vitro data and determine which aspects of the secondary structure are retained in the metaphase chromosome and how these features correlate with the polymer melt model (18, 23).
Here we apply the EM-assisted nucleosome interaction capture (EMANIC) technique, which captures nearest-neighbor interactions in combination with mesoscale modeling of chromatin fibers (16) to deduce chromatin architecture in interphase nuclei and metaphase chromosomes. Our results reveal persistence of the zigzag geometry as a dominant architectural motif in these types of chromatin. For metaphase chromosomes, we report a dramatic increase in longer-range interactions, consistent with intrafiber looping, quite different from that seen in compact chromatin fibers in vitro and interphase chromatin in vivo. Modeling also shows hierarchical looping for long fibers, with the loop occurrence strongly modulated by the density of linker histones. Such looping of loosely folded zigzag arrays appears to be an efficient mechanism for both condensing and unraveling the genomic material. Our hierarchical looping mechanism can also explain how distant regulatory DNA sites can be brought together naturally for genic interactions and how linker histone levels and epigenetic histone modifications can further modulate global and local chromatin architecture.
Results
Chromatin Cross-Linking and EM Detect Internucleosomal Interactions in Situ.
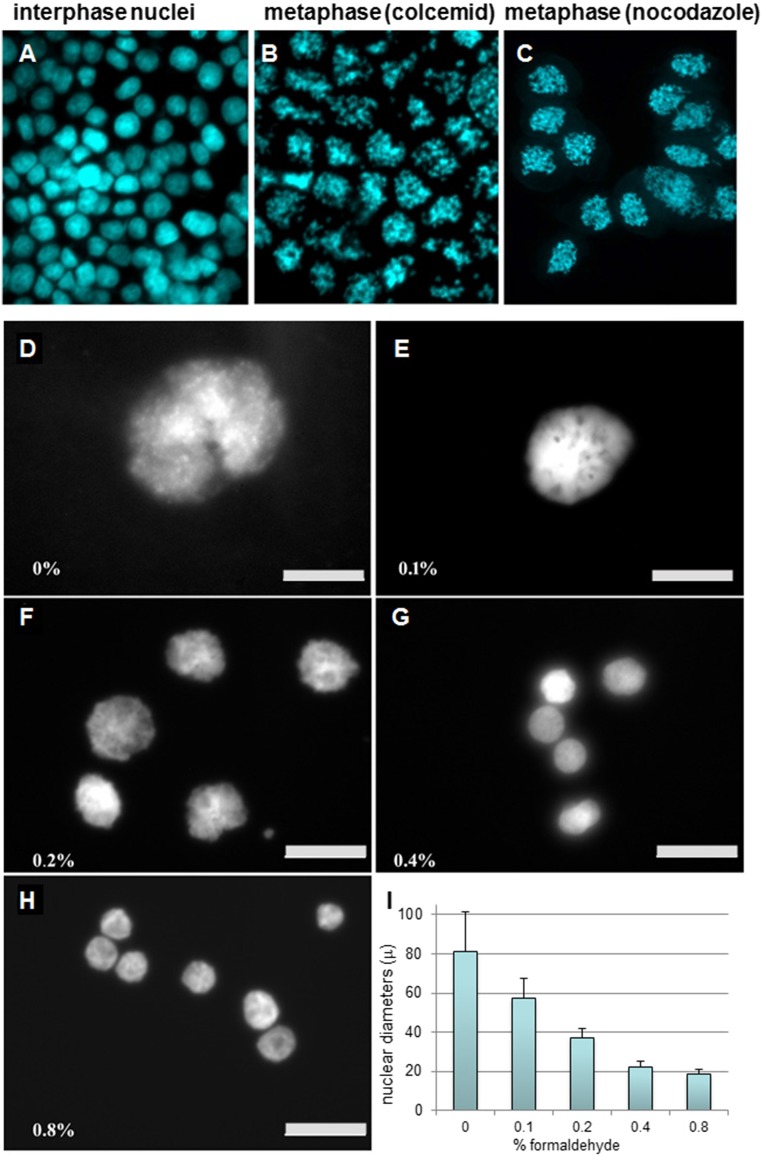
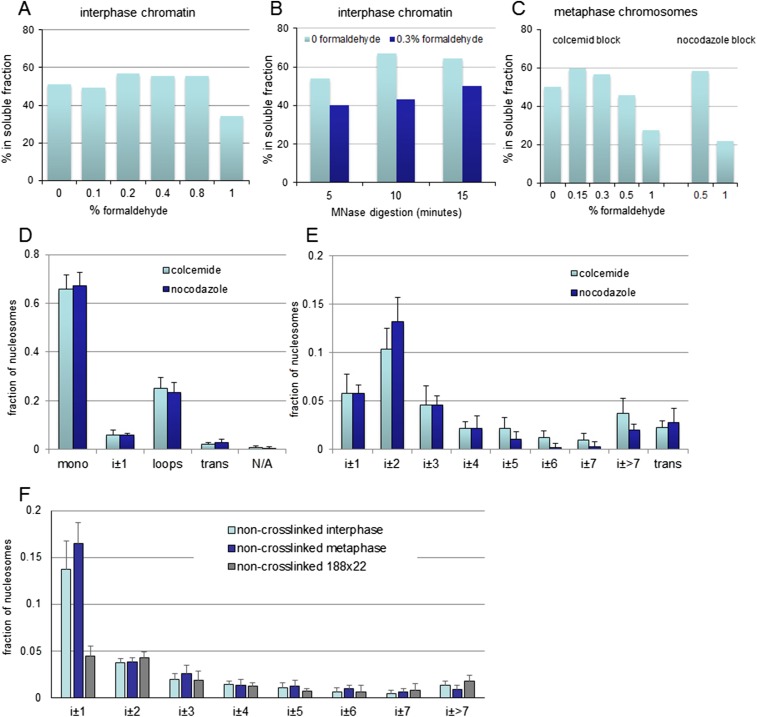
Our in situ EMANIC procedure starts with cross-linking living cells with formaldehyde, followed by fragmentation of the nuclear chromatin by micrococcal nuclease, isolation and unfolding of chromatin fragments, and scoring nearest-neighbor nucleosome interactions by transmission EM (Fig. 1A). We first used homogeneous populations of HeLa cells either in interphase or metaphase (Fig. S1 A–C) to establish an optimal extent of formaldehyde cross-linking in situ that allows chromatin isolation for EM. We observed that cross-linking with up to 0.5% formaldehyde does not inhibit the release of soluble chromatin (Figs. S1 and S2). With more than 0.8% formaldehyde, we observed a significant decrease in solubility and therefore used conditions that released >50% soluble chromatin.
Fig. 1.
Cross-linking and unfolding of native nucleosome chains for EM analysis. (A) Scheme of the experimental procedure steps. Interactions ±1, ±2, etc. result from intrafiber internucleosomal interactions; t (trans) results from interfiber internucleosomal interactions. (B) SDS/PAGE of histones from HeLa oligonucleosomes cross-linked with formaldehyde in situ, then isolated and treated with 0.5 μg/mL trypsin at +37 °C for the indicated periods of time. (C) Agarose gel electrophoresis of DNA from sucrose gradient fractionation of the intact and trypsin-treated chromatin isolated from formaldehyde-cross-linked metaphase HeLa chromosomes. Fraction numbers are indicated on top. P, pellet fraction; M, molecular weight markers. (D and E) Electron micrographs show partially cross-linked intact (D) and unfolded (E) HeLa metaphase oligonucleosomes.
Fig. S1.
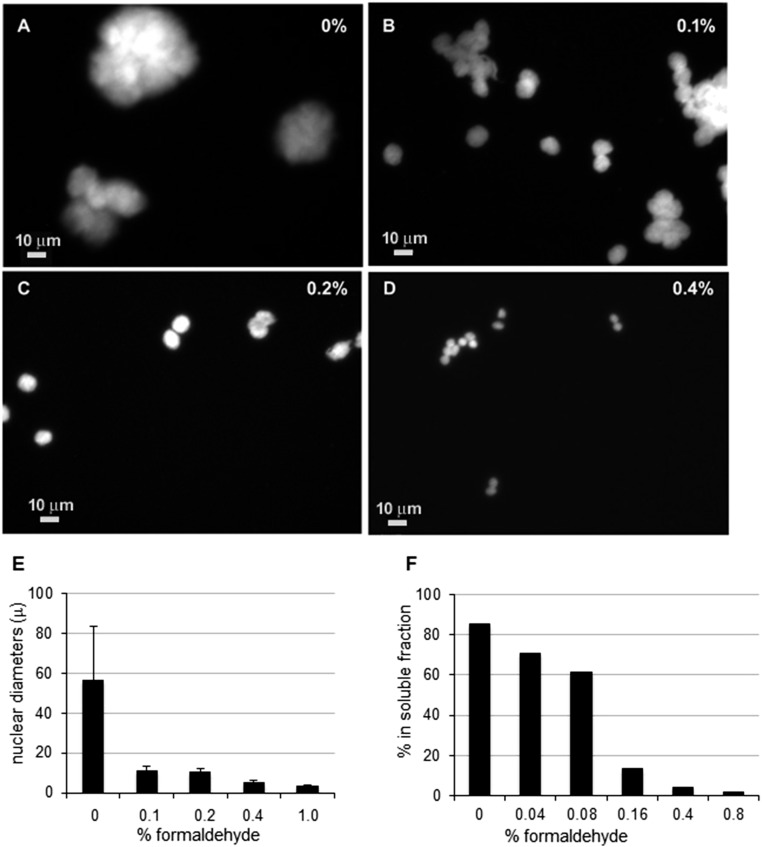
Preparing interphase and metaphase HeLa cells for EMANIC analysis. (A–C) Interphase nuclei (A) and metaphase chromosome spreads obtained after the colcemid block (B) and nocodazole block (C) were cytospinned on glass slides and stained by Hoechst 33258. (D–H) Fluorescence microscopy imaging (Hoechst 33258 staining) of nuclei isolated from HeLa cells cross-linked with increasing concentrations of formaldehyde as indicated. After isolation, the nuclei were placed in a low-salt buffer to induce nuclear chromatin unfolding. (I) Bar chart showing average diameters of the unfolded nuclei isolated from HeLa cells cross-linked with the indicated concentrations of formaldehyde.
Fig. S2.
Chromatin solubility and nucleosome interactions in HeLa cells after formaldehyde fixation with or without metaphase blocks with colcemid and nocodazole. (A) Chromatin solubility after MNase digestion (10 min) of nuclei isolated from interphase HeLa cells cross-linked with the indicated concentrations of formaldehyde. (B) Chromatin solubility after MNase digestion for indicated times of nuclei isolated from interphase HeLa cells cross-linked with 0% or 0.3% of formaldehyde. (C) Chromatin solubility after MNase digestion (10 min) of nuclei isolated from metaphase HeLa chromosomes prepared by either colcemid or nocodazole block and cross-linked with the indicated concentrations of formaldehyde. (D and E) EMANIC analysis showing fractions of total (free and interacting) nucleosomes within metaphase HeLa cells blocked in the presence of colcemid or nocodazole and cross-linked in situ with 0.3% or 0.5% formaldehyde, respectively. (D) Fractions of free mononucleosomes (mono) and interactions between the nearest neighbors (i ± 1), combined loops (i ± 2 through i ± 22), in-trans interactions between distinct fibers, and nonassigned interactions (N/A). (E) Fractions of interactions between the unique loop types (i ± 1 to i ± 7), combined loops (i ± >7), and in-trans interactions. (F) Fractions of control internucleosome interactions (without formaldehyde cross-linking) in native (HeLa) and reconstituted (clone 601 188 × 22 repeats) nucleosome arrays. Error bars show SDs.
Nuclease fragmentation and isolation of native chromatin fibers results in nucleosome chains coated with nonhistone “husks” (24) that obscure transmission electron microscopy imaging (Fig. 1D). The molecular composition of these husks is not defined, though it had been argued that insoluble nuclear proteins dominate chromatin cross-linking by formaldehyde in situ (25). To facilitate direct imaging of internucleosomal interactions in this chromatin, we introduced a mild trypsin treatment to digest the linker histone with minimal effect on the core histones (Fig. 1B). This procedure opens nucleosome arrays for EM analysis (Fig. 1E), while the residual DNA-depleted protein husks sediment to the bottom (fraction P in intact chromatin in Fig. 1C).
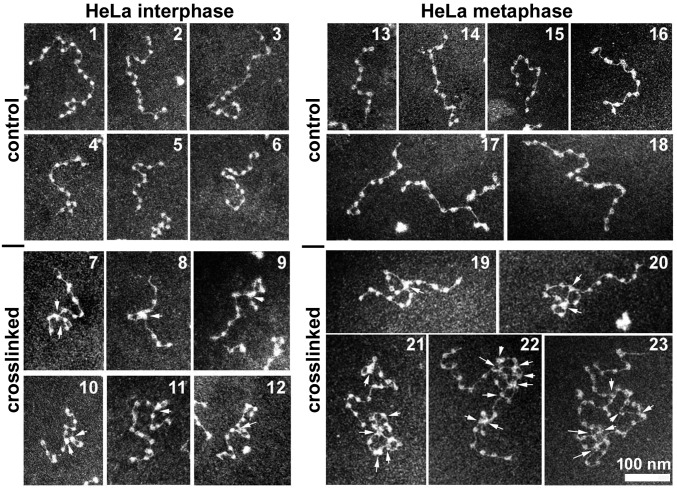
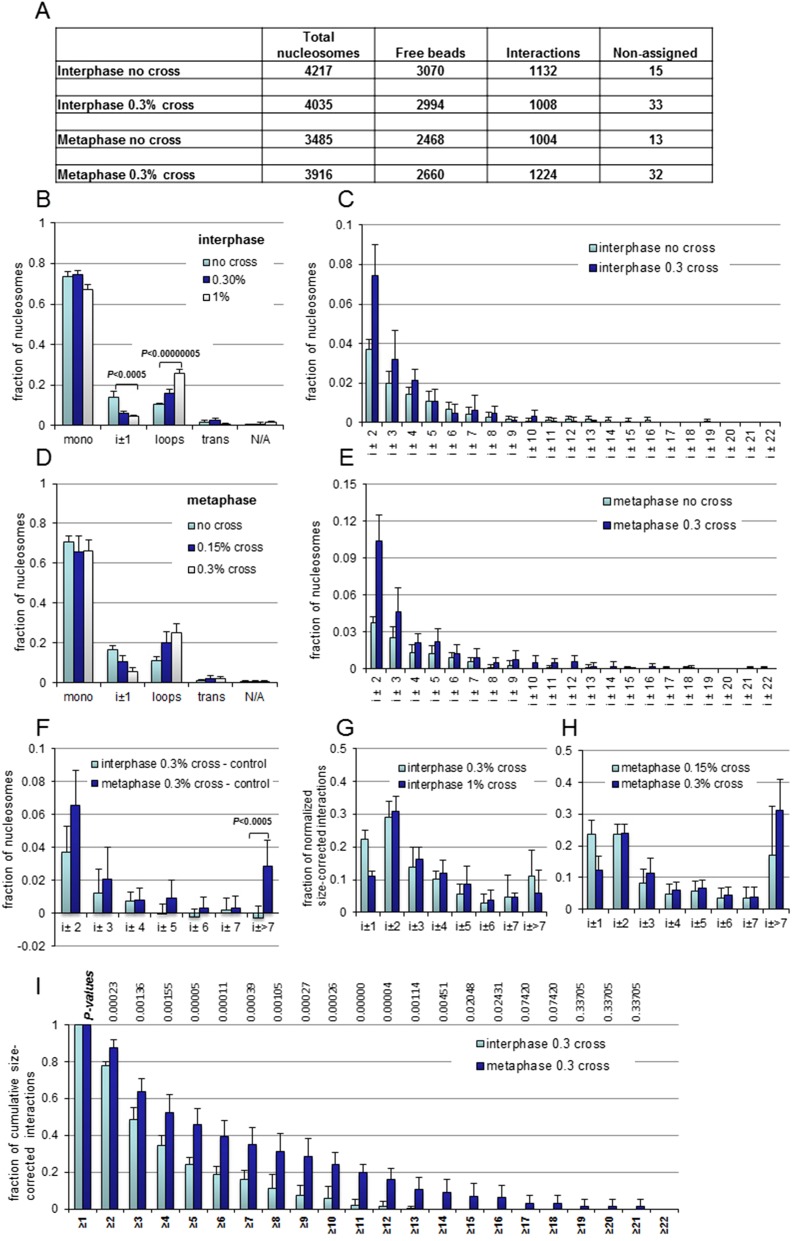
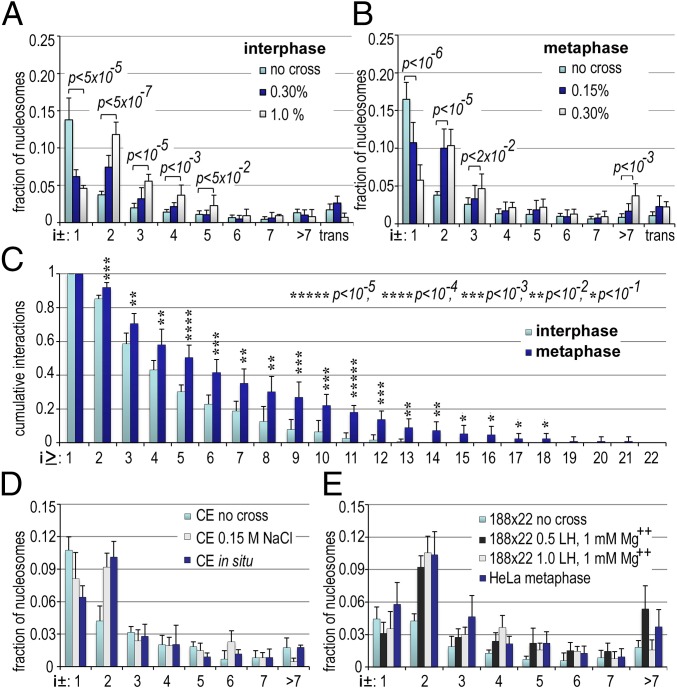
Fig. 2 shows typical EM images of cross-linked arrays. We record several thousand nucleosomes with nucleosome loop sizes up to 22 nucleosomes (Fig. S3 A–C; see also EMANIC dataset image files). EMANIC scoring of EM data from uncross-linked control cells and cells cross-linked with 0.3% and 1% formaldehyde reveal significant differences between the cross-linked HeLa and control arrays. Fig. 3A and Fig. S3 B and C show the relative abundance of cases where two consecutive nucleosomes are cross-linked (i ± 1), cases involving loops of one or more nucleosomes between the cross-linked pair (loops), cases where two nucleosomal arrays are cross-linked in trans (trans), and a low number of nonassigned or obscured contacts (N/A). Strikingly, between the control and 1% formaldehyde cross-linking, the extent of the i ± 1 interaction decreased approximately threefold, P < 5 × 10⁻⁴, and combined loops increased ∼2.5-fold, P < 5 × 10⁻⁸ (Fig. 3A), which suggests that most of the i ± 1 interactions seen in uncross-linked control chromatin originate from spontaneous sliding and formation of nucleosome dimers during isolation. Indeed, a comparison of the noncross-linked HeLa chromatin with 188-bp nucleosome arrays reconstituted from clone 601 DNA that preserve the nucleosome positioning with a single nucleotide resolution (16) shows a remarkably similar spontaneous nucleosome interactions for all types of interactions besides i ± 1 (Fig. S2F). For individual interactions, the most significant change between cross-linked and control chromatin (P < 5 × 10⁻⁷) is observed for i ± 2 with no significant interactions above i ± 5 (Fig. 3A). We thus conclude that the two-start zigzag geometry is preserved in nuclear chromatin of interphase proliferating cells despite the absence of visible 30-nm fibers.
Fig. 2.
Transmission EM of nucleosome chains isolated from HeLa chromatin cross-linked in situ. Dark-field EM images of uranyl acetate stained nucleosome arrays derived from control noncross-linked interphase (1–6) and metaphase (13–18) HeLa cells and nucleosome arrays isolated after limited formaldehyde cross-linking in living interphase (7–12) and metaphase (19–23) HeLa cells. Arrows show internucleosomal interactions.
Fig. S3.
Nucleosome interactions in control and cross-linked interphase and metaphase HeLa chromatin in situ. (A) Table showing the total number of nucleosomes, free and interacting nucleosomes within interphase and metaphase (colcemid block) HeLa cells scored without cross-linking (no cross) and after cross-linking with 0.3% formaldehyde. (B–E) Internucleosomal interactions within interphase (B and C) and metaphase (D and E) HeLa cells. (B and D) Fractions of the total nucleosomes, including individual mononucleosomes (mono), interactions between consecutive neighbors (i ± 1), combined loops (i ± 2 through i ± 22), in-trans interactions between distinct fibers, and nonassigned (obscured) interactions. (C and E) Fractions of total nucleosomes involved in interactions between the nearest neighbors (i ± 1), individual loop types (i ± 2 to i ± 22), in trans between distinct fibers (trans), and nonassigned (N/A) interactions. (F) Fractions of internucleosomal interactions within interphase and metaphase HeLa cells after subtraction of respective nucleosome control internucleosome interactions (without formaldehyde cross-linking). (G and H) Fractions of internucleosomal interactions multiplied by loop size correction coefficient Cicum calculated for each type of interactions (i ± 1 to i ± 22) as described in SI Materials and Methods and normalized to total number of interactions = 1. (I) Fractions of cumulative interactions (i ± ≥1 to i ± ≥22) from the interphase and metaphase HeLa cells multiplied by loop size correction coefficient Cicum as in F and G and normalized to all cumulative interactions i ± ≥1 = 1. Error bars show SDs. P values represent probabilities associated with Student’s t test.
Fig. 3.
Nucleosome interactions in interphase and metaphase chromatin in situ. (A and B) Internucleosomal interactions within interphase (A) and metaphase (B) HeLa cells scored without cross-linking (no cross) and after cross-linking with different formaldehyde concentrations in situ as indicated. A and B show fractions of the total nucleosomes including the nearest neighbors (i ± 1), unique loop types (i ± 2 to i ± 7), combined loops (i ± 8 through i ± 22), and in trans between distinct fibers. (C) Fractions of cumulative interactions (i ± ≥1 to i ± ≥22) from interphase and metaphase HeLa cells cross-linked with 0.3% formaldehyde and normalized to all interactions i ± ≥1 = 1. (D) Internucleosomal interactions within CE chromatin scored without cross-linking (no cross) and after cross-linking in vitro with 0.15 M NaCl, or in situ as indicated. Shown are fractions of total nucleosomes including the nearest neighbors (i ± 1), unique loop types (i ± 2 to i ± 7), combined loops (i ± 8 through i ± 22), and in trans between distinct fibers. (E) EMANIC of 188 × 22 reconstituted nucleosome arrays scored without cross-linking (no cross) and cross-linked at 0.15 M NaCl and 1 mM MgCl2 in vitro, and metaphase HeLa cross-linked in situ (0.3% formaldehyde). Shown are fractions of nucleosome interactions, including the nearest neighbors (i ± 1), unique loop types (i ± 2 to i ± 6), and combined loop interactions (i ± >7). Error bars show SDs. P values represent probabilities associated with two-tailed Student’s t test.
Nucleosome Interactions in Metaphase Chromosomes Reveal Hierarchical Looping.
We obtained mitotic cells by blocking proliferating HeLa cells with colcemid or nocodazole, yielding more than 98% in metaphase (Fig. S1 B and C). Cross-linking of metaphase cells with ≥0.5% formaldehyde had a stronger inhibiting effect on chromatin solubility compared with interphase (Fig. S2C). The resulting cross-linked metaphase chromatin fragments reveal many multiloop arrangements (Fig. 2, 19–23), strikingly different from the shorter single loops in interphase chromatin (Fig. 2, 7–12). Scoring multiple EM datasets from control, noncross-linked metaphase cells, and metaphase cells cross-linked with 0.15% and 0.3% formaldehyde reveal a highly significant decrease in interactions at i ± 1 and increase for i ± 2 (Fig. 3B), similar to those observed with interphase chromatin (Fig. 3A). Cross-linking after a nocodazole block yields a loop size distribution very similar to that observed with colcemid (Fig. S2 D and E). However, metaphase chromatin exhibits a strong increase in long-range interactions (i ± >7) compared with interphase chromatin (Fig. 3 A and B), suggesting extensive tertiary interactions. This difference is even stronger when the baseline interactions in the control chromatin are subtracted from the total counts (Fig. S3F). Most remarkably, the metaphase chromatin exhibits strong increase of interactions with cumulative loops that yield, e.g., a higher proportion of i ± >9 to i ± >12 loops compared with interphase chromatin (Fig. 3C).
Because the probability of loop detection could be affected by the total length of the nucleosome fragment, we calculated a correction coefficient to account for loop size (SI Materials and Methods). This analysis (Fig. S3 G–I) confirms that a significant difference (P < 0.001) in internucleosomal interaction occurs among a wide range of cumulative loops, i ± ≥5 to i ± ≥13. Thus, EMANIC studies of condensed metaphase chromosomes show a consistent increase in long-range loops and folds of the chromatin fiber at the higher hierarchical level (tertiary structure) without significant alteration of the lower nucleosome chain folding level (secondary structure).
Nucleosome Interactions in Chicken Erythrocyte Nuclei and Reconstituted Nucleosome Arrays Are Consistent with Zigzag Fibers.
In addition to HeLa cells, we examined nucleated chicken erythrocytes (CE) as a model cell type with confirmed chromatin 30-nm fibers in situ (12). Because cross-linking of whole CE cells inhibited chromatin solubilization, thus precluding EMANIC, we used isolated CE nuclei with fully condensed chromatin and established an optimal extent of formaldehyde (0.1%) for their cross-linking in situ (Fig. S4).
Fig. S4.
Formaldehyde fixation of CE cell nuclei gradually inhibits nuclear unfolding. (A–D) Fluorescence microscopy imaging (Hoechst 33258 staining) of CE nuclei cross-linked with increasing concentrations of formaldehyde as indicated. After cross-linking, the nuclei were placed in a low-salt buffer to induce nuclear chromatin unfolding. (E) Bar chart shows average diameters of the unfolded nuclei isolated cross-linked with the indicated concentrations of formaldehyde. (F) Bart chart shows percentage of soluble chromatin released after MNase digestion (10 min) of CE nuclei cross-linked with the indicated concentrations of formaldehyde.
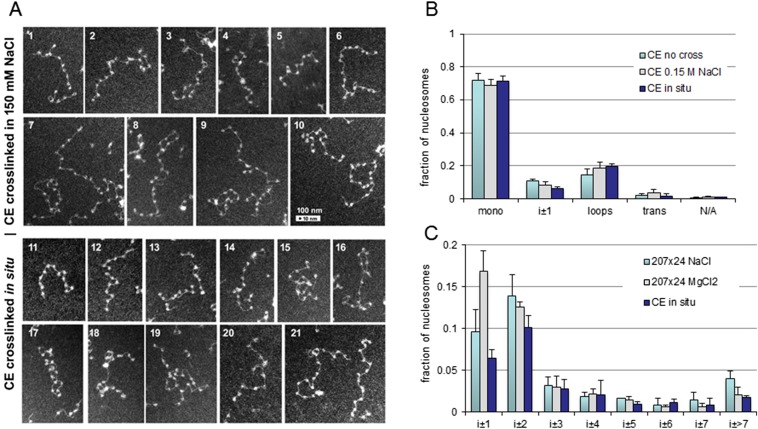
EMANIC experiments with the nuclear and soluble CE chromatin (Fig. 3D and Fig. S5) show predominantly short-range interactions (i ± 1 and i ± 2). As with interphase HeLa cells, the i ± 1 interactions are significantly weaker in situ than in the noncross-linked CE control. In contrast with HeLa chromatin that shows significant increases above control for i ± 3, i ± 4, and i ± 6, in addition to i ± 2, CE show no increase for any interaction above i ± 2 (Fig. 3 A and D). These findings support the predominance of a simple, solely two-start zigzag geometry in nuclear CE chromatin, consistent with previous observations (11, 12).
Fig. S5.
Nucleosome interactions in CE chromatin in vitro and in situ. (A) EM images of nucleosome arrays derived from isolated CE chromatin cross-linked in the presence of 0.15 M NaCl (1–10) and in CE nuclei in situ (11–21). (B) Internucleosomal interactions within CE chromatin scored without cross-linking (no cross) and after cross-linking in vitro with 0.15 M NaCl, or in situ as indicated. Shown are fractions of total nucleosomes, including individual mononucleosomes (mono) and interactions between the nearest neighbors (i ± 1), unique loop types (i ± 2 to i ± 7), combined loops (i ± >7), in trans between distinct fibers, and nonassigned interactions (N/A). (C) EMANIC of 207 × 24 reconstituted nucleosome arrays cross-linked at 0.15 M NaCl and 1 mM MgCl2 in vitro (data from ref. 16) and CE chromatin cross-linked in situ. Shown are fractions of nucleosome interactions, including the nearest neighbors (i ± 1), unique loop types (i ± 2 to i ± 6), and combined loop interactions (i ± >7). Error bars show SDs.
To determine whether there is a fundamental agreement in the patterns of nucleosome interactions between the in vitro and in situ structures, we compared in situ EMANIC data with results obtained from reconstituted nucleosome arrays. First, we took previous data obtained for 24-unit, 207-bp nucleosome repeat length (NRL) nucleosome core arrays reconstituted with linker histone to mimic CE chromatin. These 207 × 24 arrays were condensed by either 150 mM NaCl or 1 mM MgCl2 as done previously (16). Compared with the nuclear CE chromatin, the pattern of in situ cross-linking is similar to that of Na+-condensed 207 × 24 arrays, with more than twofold lower i ± 1 interactions than in the most compact Mg2+-condensed arrays (Fig. S5C). Thus, the majority of nuclear CE chromatin is consistent with a less-condensed form of the 30-nm fiber formed with monovalent cations rather than that achieved in the presence of divalent cations (16, 26).
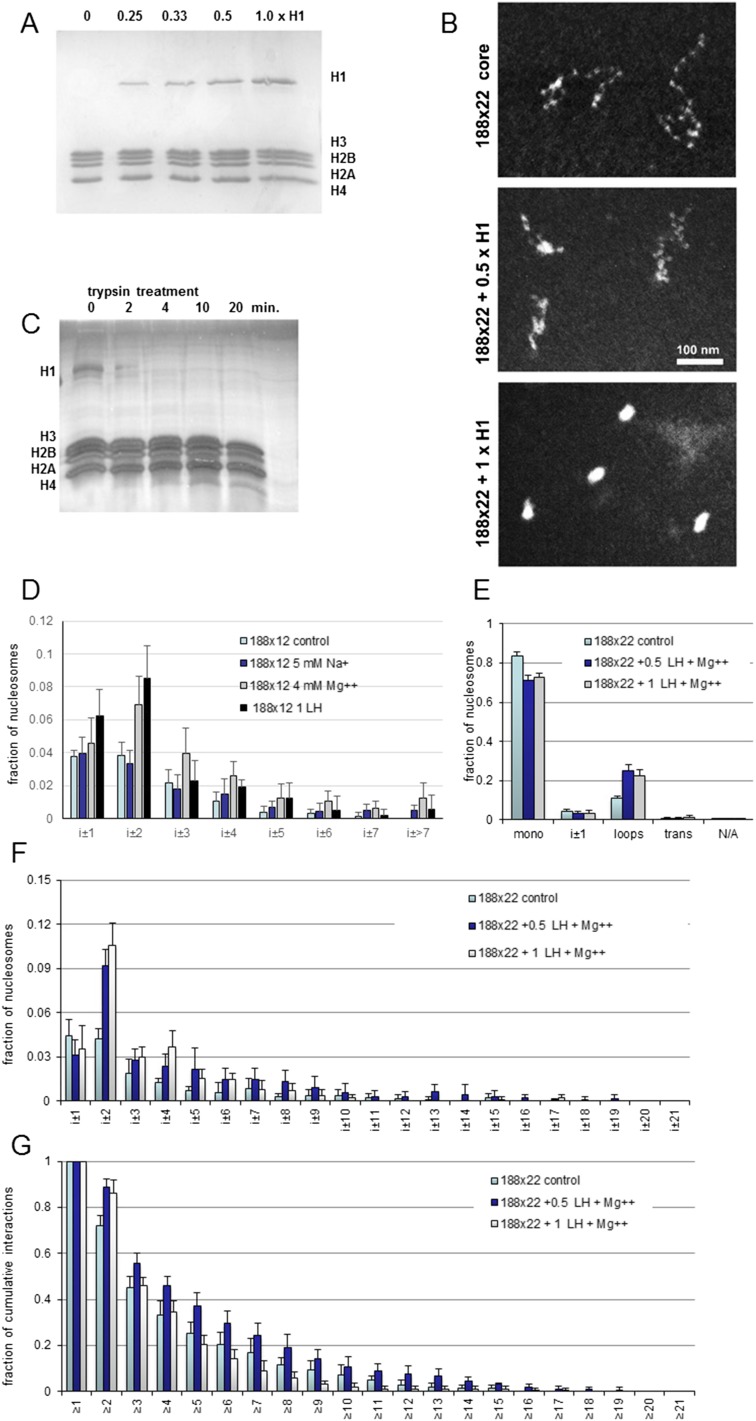
Next, we reconstituted and analyzed 12-unit and 22-unit arrays of strongly positioned nucleosomes (27) with NRL of 188 bp close to that of HeLa cells (28). The arrays were reassociated with increasing levels of linker histone H1 resulting in efficient compaction as seen by EM (Fig. S6). To reaffirm our in situ EMANIC experiments, we slightly digested the cross-linked 188 × 22 nucleosomes with trypsin to digest histone H1 while preserving core histones (Fig. S6C). In agreement with overall compaction, EMANIC shows a significant increase in i ± 2 interactions promoted by either 0.5 or one molecule of histone H1 (Fig. 3E). The 12 × 188 arrays condensed with one molecule of H1 per nucleosome also show a higher proportion of interactions at i ± 2 and a lesser proportion at i ± >7 than Mg2+-compacted arrays (Fig. S6). Strikingly, the arrays with 0.5 molecules of H1 per nucleosome show a dramatically higher proportion of nucleosome interactions in loops i ± >7 than fibers with one molecule of LH per nucleosome (Fig. 3E and Fig. S6), thus resembling the interaction pattern observed with metaphase chromosomes. Clearly, LH at the substoichiometric levels can promote interactions between distant nucleosomes more efficiently than in arrays with one molecule of LH per nucleosome or arrays lacking LH.
Fig. S6.
Folding and nucleosome interactions in reconstituted 188 × 22 arrays. (A) SDS/PAGE of histones from 188 × 22 nucleosome arrays reconstituted with different molar ratios of linker histone H1 per nucleosome. Coomassie R250 staining. (B) Dark-field EM images of uranyl acetate-stained nucleosome arrays from 188 × 12 nucleosome core arrays in HNE (Top), and 188 × 12 nucleosome arrays reconstituted with 0.5 (Middle) and one (Bottom) molecule of histone H1 per nucleosome in 0.15 M NaCl buffer. (C) SDS/PAGE of histones from 188 × 22 nucleosome arrays reconstituted with linker histone H1, crosslinked with formaldehyde, and then treated with 0.5 mg/mL trypsin at +37 °C for the indicated periods of time. Histones were heated for 30 min at +95 °C before electrophoresis to reverse formaldehyde cross-linking. SYPRO Ruby fluorescence staining. (D) EMANIC of the 188 × 12 nucleosome arrays without cross-linking (control) and cross-linked in presence of 5 mM Na+, 4 mM Mg2+, and one molecule per nucleosome linker histone H1 as indicated. (E–G) EMANIC of the 188 × 22 nucleosome arrays with increasing ratio of linker histone per nucleosome. (E) Fractions of the total nucleosomes, including individual mononucleosomes (mono), interactions between consecutive neighbors (i ± 1), combined loops (i ± 2 through i ± 21), in-trans interactions between distinct fibers (trans), and nonassigned interactions (N/A). (F) All interactions (i ± 1 through i ± 21). (G) Fractions of cumulative interactions (i ± ≥1 to i ± ≥21) normalized to all cumulative interactions i ± ≥1 = 1. Error bars show SDs.
Mesoscale Modeling Reveals Hierarchically Folded Loops in Chromatin Fibers.
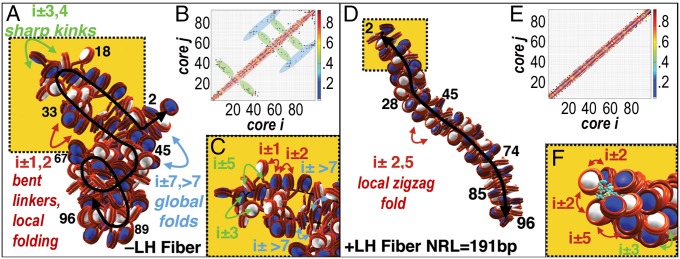
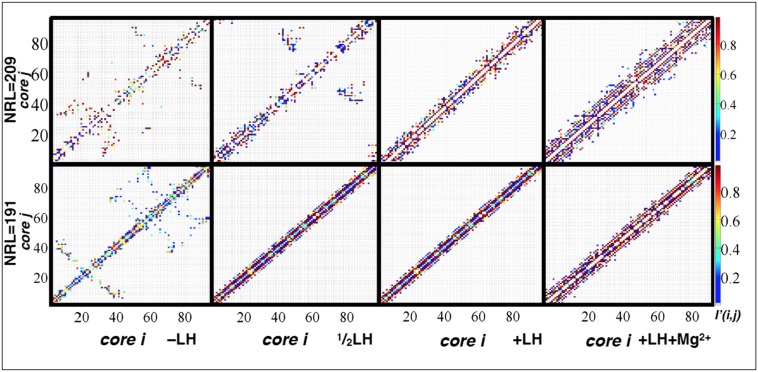
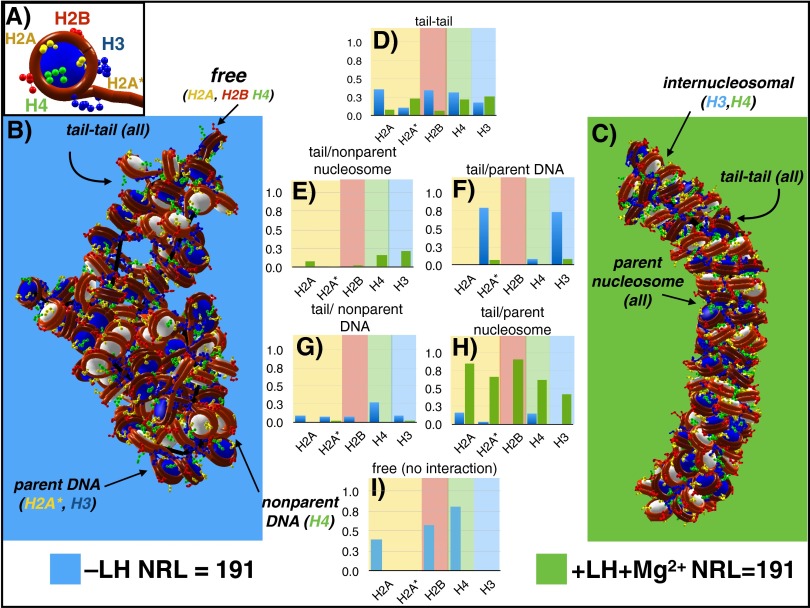
Mesoscale chromatin modeling can assess fiber configurations to analyze histone tail-mediated interactions and overall internucleosomal interactions (16, 29). Here we extend our chromatin model to long fibers of 96 nucleosomes (SI Materials and Methods) to investigate interactions between distant regions of chromatin fibers. Specifically, we simulate various 96-unit oligonucleosome systems with NRL = 191 bp [approximating HeLa chromatin with ∼188 bp (28) and NRL = 209 bp (close to CE chromatin with NRL ∼207–212 bp) (28)] with or without linker histone (LH); we also consider fully saturated LH (one LH per nucleosome) and half-saturated LH (one LH per two nucleosomes). As shown in Fig. 4, we observe hierarchical looping, with a significant proportion of zigzag motifs, leading to enhanced long-range internucleosomal interactions. The looped configurations are mediated by core histone tails (analyzed as described in SI Materials and Methods and Figs. S7 and S8). Computed interaction frequency contact maps, which quantitatively describe the distribution of all internucleosome interactions, show that the –LH, NRL = 191 bp fiber exhibits several folds, including one partial hairpin-type fold, and another wide loop, which is then folded (in 3D space) to efficiently compact with the previously mentioned hairpin. The resulting contact map shows not only local interactions evident in canonical zigzag topologies (i ± 2 dominant) close to the diagonal, but also straight lines perpendicular to the diagonal, indicative of hairpins. Hierarchical folds, or the contact of 2–3 separate loops colored in green, correspond to higher-order folds and regions parallel to the diagonal, shown in blue in the contact matrices (Fig. 4B).
Fig. 4.
Modeled folding motifs and analysis of interactions for nucleosome arrays folded with and without linker histone. For the 191 NRL repeat fiber, representative conformations are shown without linker histone (–LH) and one linker histone/nucleosome (+LH) in A and D, respectively, with corresponding normalized interaction frequency maps in B and E and illustrations of these contacts in C and F, respectively. The local interactions are highlighted in red, near the diagonal in the matrices. Interactions along straight lines perpendicular to the diagonal indicate hairpins and sharp kinks, resulting in midrange contacts and are highlighted in green. Off-diagonal parallel lines correspond to hierarchical loops, or loops of loops, resulting in i ± >7 contacts, highlighted in blue.
Fig. S7.
Select conformational contact maps of normalized nucleosome interaction frequencies. Maps are provided for four systems (without linker histone, –LH; with one linker histone per two nucleosomes, 1/2LH; with one linker histone per nucleosome, +LH; and one linker histone per one nucleosome plus divalent ions, +LH+Mg2+, all at monovalent salt concentration of [NaCl] = 150 mM, for two distinct linker length values: NRLs = 191 and 209 bp. Off-diagonal terms indicate higher-order folding, whereas diagonal terms indicate near-neighbor contacts evident in local folding (solenoid, two-start zigzag, etc.). Straight lines perpendicular to the diagonal indicate hairpins, whereas off-diagonal parallel lines show loops of loops or hierarchical loops. The fibers –LH 191 NRL, 1/2LH 209 NRL, and –LH 209 NRL reveal higher-order folds (i + >7), whereas the rest do not.
Fig. S8.
Histone tail interaction analysis for two fibers with NRL = 191 bp: without LH and with LH and divalent ions. (A) Single core with four classes of histone tails and coloring schemes used in plots. H2A (C-terminal) and H2A* (N-terminal) in yellow, H2B in red, H3 in blue, and H4 in green. (B and C) Typical fiber configuration of the NRL = 191 fiber without linker histone (–LH) and typical fiber configuration with linker histone and divalent ions (+LH+Mg2+), respectively. (D–I) Tail interaction plots determined by calculating the number of times a tail was found within a distance cutoff of 18 Å (the van der Waals radius of tail beads) of either another tail bead (D); a nonparental nucleosome bead (E) and parental nucleosome bead (F); a nonparental linker DNA bead (G) and parental linker DNA bead (H); or no beads (labeled “free”) (I). –LH fibers show significant increase in free tails and parent–DNA interaction, supporting experimental evidence that linker histones repress gene expression, which often relies heavily on H3–parental DNA interaction (16). The +LH+Mg2+ fiber tail patterns reveal significant tail–parent nucleosome interaction, whereas the –LH fiber shows significant tail–parent DNA interactions and free tails.
Folding of the 191-bp HeLa-like chromatin fibers was also simulated in the presence of linker histone (Fig. 4 D–F). Significantly, the experimental difference found for interphase and metaphase HeLa chromatin—namely, reduced long-range contacts for the former and enhanced higher-order interactions (i ± >7) for the latter (Fig. 3 A and B), is reproduced for our 96-unit core array system without and with linker histone-containing 150 mM Na+ fibers, respectively (Fig. 4 B and E).
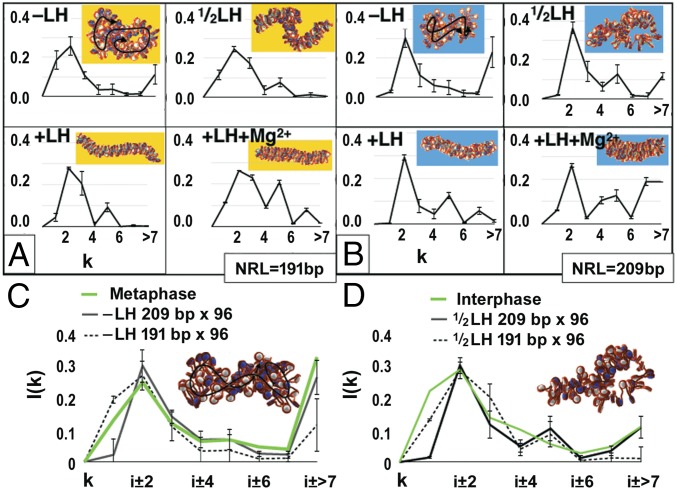
Linker histone H1 is nonessential for metaphase chromosome condensation (30) and the majority of proliferating cells contain different substoichiometric levels of linker histone (31). Therefore, folding of the 191- and 209-bp chromatin fibers was also simulated in the presence of stoichiometric (one LH per nucleosome) and substoichiometric (one LH per two nucleosomes) linker histone. A clear trend emerges from our models with different levels of LH (Fig. 5). For both 191-bp NRL arrays and 209-bp NRL arrays, well-defined 30-nm zigzag fibers are obtained, in agreement with well-recognized compaction of fibers due to LH-induced stem formation, which stabilizes zigzag structures (32, 33), but both 1/2LH structures are more flexible and looped compared with the fiber with saturated linker histones. Interestingly, though the fiber with shorter linker DNA has a relaxed zigzag structure with many i ± 1 and i ± 3 interactions, the longer-linker fiber exhibits a stronger content of zigzag motifs, in addition to long-range interactions (Fig. 5 A and B). Computed interaction frequency patterns show that –LH fibers have the closest correspondence to the metaphase chromatin, whereas 1/2LH fibers fit the interaction pattern observed in interphase cells (Fig. 5 C and D, green curves). Thus, the enhanced propensity for distant nucleosome interactions observed in condensed metaphase chromatin by EMANIC is consistent with the model-predicted intrinsic hierarchical looping of the nucleosome core array that is restricted by association with linker histone in both the experimental and the modeling systems.
Fig. 5.
Internucleosome interaction patterns for two NRLs folded with various linker histone levels and ionic conditions. Interaction patterns are shown for (A) NRL = 191 bp and (B) NRL = 209 bp, each for four modeled fiber types: without linker histone, –LH; with one linker histone per two nucleosomes, 1/2LH; with one linker histone per nucleosome, +LH; and one linker histone per one nucleosome plus divalent ions, +LH+Mg2+, all at monovalent salt concentration of [NaCl] = 150 mM. Typical fiber folding motifs are shown in the upper right of each plot with a projection of fiber axis shown in black for –LH structures. All plots are normalized by total number of interactions counted per system and scaled with an additional factor between 0.3 and 0.5 to match peaks to EMANIC data. (C and D) Nucleosome interaction plots comparing simulated NRL = 191 bp and NRL = 209 bp –LH (C) and 1/2LH (D) fibers to fractions of size-corrected interactions for human HeLa interphase and metaphase, in green (0.3% cross-linking from Fig. S3 G and H).
SI Materials and Methods
Fragmentation and Isolation of Cross-Linked Chromatin.
The fixed interphase cells were washed three times with cold PBS and then detached using a cell scraper. The fixed mitotic HeLa cells were spun down in a cold centrifuge and washed three times with 20 mL PBS (with centrifugation at 4,000 × g for 5 min.). Cell nuclei or chromosomes were isolated from both interphase and metaphase cells by resuspending the cells in RSB buffer [10 mM NaCl, 3 mM MgCl2, 10 mM Tris⋅HCl (pH 7.5)] containing 0.5% Nonidet P-40 in RSB with 1 mM PMSF at 4 °C. The cell suspensions were homogenized by 20–30 strokes of pestle A in a Dounce homogenizer over 30 min on ice. Nuclei were centrifuged for 10 min at 4,600 × g, and the nuclear pellets were resuspended in RSB plus 1 mM PMSF at ∼1 mg/mL of DNA determined spectrophotometrically. Chicken erythrocyte nuclei were isolated as described (27), resuspended in a RSB–Hepes buffer [10 mM NaCl, 3 mM MgCl2, 10 mM Hepes (pH 7.5)], and then cross-linked with 0.1–1.0% formaldehyde at room temperature for 10 min. Cross-linking was stopped by adding 1 M glycine to yield a final concentration of 125 mM and by putting samples on ice. The fixed nuclei were spun immediately in cold centrifuge and washed three times with 20 mL RSB by centrifugation at 4,600 × g for 5 min and resuspended in RSB buffer to a concentration of ∼1 mg/mL of DNA.
The isolated formaldehyde cross-linked nuclei were treated with micrococcal nuclease (MNase) to prepare chromatin fragments with an average DNA size of 2,400 bp, corresponding to 12 nucleosomes, similar to the size used for in vitro EMANIC. The size of the nuclease fragments was determined by agarose DNA electrophoresis after DNA deproteinization by 1% SDS and 0.5 mg/mL proteinase K and reversal of formaldehyde cross-linking by heating at 65 °C for 90 min. The MNase digestion was stopped by adding 5 mM EDTA, rapidly cooling on ice, and spinning down for 5 min at 4,600 × g and −4 °C. The nuclear pellet was resuspended in TE buffer [10 mM Tris, 1 mM EDTA (pH 8.0)] with mild shaking and centrifuged for 10 min at 18,000 × g and −4 °C. The supernatants were combined and the concentration of soluble DNA was monitored spectrophotometrically.
Chromatin Unfolding and Fixation for EM.
The released soluble chromatin was dialyzed in solutions of very low ionic strength [5 mM Na-borate (pH 9.0)]. To induce complete unfolding of isolated chromatin for EM, the nucleosome arrays were treated with 0.5 μg/mL trypsin (Sigma; T8003) at +37 °C for 2–5 min. The unfolded nucleosome arrays were fixed with 0.1% glutaraldehyde for 16 h and then concentrated to 0.25 mg/mL DNA before sucrose gradient fractionation. Concentrated chromatin samples were loaded on 11-mL gradients of 5–25% sucrose in TE buffer and centrifuged in a preparative ultracentrifuge with a SW41 Ti rotor (Beckman) for 8 h at +4 °C. Aliquots of the sucrose gradient fractions were treated with 0.5 mg/mL Proteinase K in 1% SDS for 1.5 h, incubated for 6 h at +65 °C for decross-linking, and DNA analyzed by electrophoresis in 0.8% agarose in TAE buffer as before (27). Fractions enriched in particles with DNA sizes corresponding to 10–24 nucleosomes were taken for EM analysis of internucleosomal cross-links.
Reconstitution and Biochemical Analysis of the Nucleosome Arrays.
Procedures for construction of DNA templates (188 × 12 and 188 × 22) for multimeric oligonucleosome arrays, their reconstitution with core histone octamers by salt dialysis, characterization by micrococcal nuclease mapping, agarose gel electrophoresis, restriction enzyme protection, analytical ultracentrifugation, and electron microscopy to verify the correct number and positioning of the nucleosome cores are as described in ref. 27. Additional reconstitutions with linker histone were performed by mixing reconstituted 188 × 12 core arrays with either 1 mg/mL recombinant linker histone variant H10 (New England BioLabs; catalog no. M2501S) or 1 mg/mL chicken erythrocyte linker histone H1 at a molar ratio of 0.25–1 molecule histone H1 per nucleosome in solution containing 500 mM NaCl, 10 mM Hepes, 0.1 mM EDTA and dialyzing into final 5 mM NaCl, 10 mM Hepes, 0.1 mM EDTA (pH 7.5), as described (27). Linker histone H1 isolations were conducted using 1-mL HiTrap Sepharose HP ion exchange column (GE Healthcare) essentially as described in ref. 27 for linker histone H5, but the fractions containing linker histone H1 eluting at ∼0.35 M NaCl from the gradient was collected.
EMANIC.
For transmission EM of the partially cross-linked nucleosome arrays, we used positive staining with uranyl acetate and dark-field mode imaging, a highly sensitive staining technique that was modified for EMANIC by optimizing the thickness of the carbon coating, mesh size of EM grids, stain concentrations, and grid treatments and washing regimens (16). Dark-field EM images were obtained and digitally recorded either at 100 kV using a Tecnai 12-electron microscope (FEI Corp.) with an F224 2K slow scan CCD camera (Tietz Video and Image Processing Systems) or at 120 kV using a JEM-1400 electron microscope (JEOL USA) with an SC1000 ORIUS 11-megapixel CCD camera (Gatan Inc.). Images were collected at 42,000, 52,000, or 67,000 magnification. For each sample, nucleosomal arrays containing at least 10 distinguishable nucleosome cores were selected to score internucleosomal interactions. Individual nucleosomes were overlaid with masks of nucleosome-size disks that were scaled to diameter of 110 Å for each given magnification, centered over each nucleosome, and connected with lines tracing the underlying linker DNA. Supplementary EMANIC dataset image files (Dataset S1) show all individual nucleosome arrays for HeLa metaphase and interphase overlaid with scoring masks. Internucleosomal interactions were scored as positive if the scaled nucleosome disks contacted each other. SDs and SE of mean were obtained from at least three EM experiments and at least two independently cross-linked samples; P values represent probability associated with a Student’s two-sample unequal variance t test with a two-tailed distribution.
Size-Correction Coefficients Used to Compare Data for Nucleosome Experiments with Different Size Distributions.
We calculated size-correction coefficients for an observed nucleosome chain with M nucleosomes by assuming that each nucleosome number N (N is between 1 and M) has an equal chance of contacting each another bead in the native state but only a fraction of those will be preserved in the isolated nucleosome chain. The predicted proportion of each given observed fraction of interactions depends on the loop size:
For example, the fraction of observed interaction at Pii±3 = 0.1364 for a 12-bead chain, but the fraction of interaction at Pii ± 11 = 0.01515 because the loop i ± 11 is longer. No loops above i ± 11 can be observed within a 12-mer array.
Theoretical fraction of equal interactions Pt does not depend on the loop size and is obtained by the inverse of the number of nucleosomes in the array:
For example, the fraction of interaction for all possible interactions in the 12-mer from Pti ± 1 to Pti ± 11 is equal to = 0.0909 (1/11). We can now calculate a size-correction coefficient:
For example, the correction coefficient for interactions at i ± 3, Ci ± 3 = 0.666 and Ci ± 11 = 6.000 for a 12-bead chain.
For each experimentally observed set of EMANIC arrays where the nucleosome number in the array K is distributed between J and L, we calculated its fraction in the whole sample by dividing the number of all arrays with K nucleosomes (Nk) by the sum of all observed arrays with the nucleosome number between J and L:
For example, in the 0.3% colcemid interphase experiment, the nucleosome array sizes are distributed between 10 and 31, and the fraction of 12-mer arrays (R12) is 0.0517.
We will now obtain the cumulative correction coefficient for each given interaction Cicum as a sum of all correction coefficients for all arrays with nucleosome number between J and L:
For example, in the 0.3% colcemid interphase experiment, the cumulative size-correction coefficient at i ± 3, Ci ± 3cum = 0.6283 and at Ci ± 11 = 1.943.
Finally, we take the observed number of each given type of interactions Piobs in the EMANIC experiments for all arrays and calculate the size-corrected interaction:
The corrected types of interactions are normalized for final analysis. For example, in the 0.3% colcemid interphase EMANIC experiment, the observed normalized interaction at i ± 3 = 0.132 and at i ± 11 = 0.020, and the corrected normalized interaction at i ± 3 = 0.115 and at i ± 11 = 0.040. After size correction, the i ± 3, like other small interactions, did not change much, but i ± 11 increased twofold because this is a relatively long loop compared with the total distribution in the sample.
Mesoscale Modeling and Monte Carlo Simulations.
Our computational mesoscale chromatin model is described in detail in our previous publications (2, 16, 29, 33, 44).
In brief, the model captures the mesoscale electrostatic, excluded volume, and elastic properties of the nucleosome, linker DNAs, and linker histone. The coarse-graining approach is tailored to each element based on all-atom models and experimental data. The nucleosome core, formed by the globular part of the eight core histones and the wrapped DNA, is approximated as a rigid surface made of 300 pseudocharges, which are adjusted using the discrete surface-charge optimization (DiSCO) method at different salt concentrations (45). The 10 flexible core histone tails in the nucleosome are modeled as charged elastic polymers with a resolution of 5 amino acids per spherical bead; the parameters of the force field are adjusted using the Warshel–Levitt united-atom protein model. The linker DNA connecting consecutive nucleosomes is represented as an elastic worm-like chain model of n spherical beads, where n = 4 for NRL = 191 bp and n = 6 for NRL = 209 bp (32); the negative charge associated to the DNA phosphate backbone is adjusted using the Stigter’s procedure at different salt concentrations, as detailed by Schlick et al. (46). To treat linker histone presence, we use a coarse-grain model of the H1.4 (rat) all-atom molecular model developed in refs. 16 and 33. The short N-terminal domain is neglected, and the globular head and C-terminal domain are approximated by three rigid spherical beads aligned through the nucleosome dyad axis where charges are adjusted using the DiSCO procedure (33, 45).
All beads constituting these chromatin elements interact with electrostatic and excluded volume terms as detailed in ref. 32. The atomistic electrostatic field of each chromatin element in the presence of monovalent ions is adjusted using Debye–Hückel charges at different salt concentrations (47). The presence of a small concentration of Mg2+ divalent ions changes the physical properties of linker DNA through ion condensation; this effect is accounted by reducing the repulsion and persistence length of the linker DNAs (16).
To equilibrate and sample the configurations of chromatin fibers we use four Monte Carlo (MC) moves that capture the multiscale dynamics of the system (47). Local translation and rotation of DNA beads and nucleosome cores are evaluated using a Metropolis acceptance algorithm, along with a global pivot of a portion of the chromatin fiber. To properly sample the flexible core histone tails, we apply a configurational-bias MC move that regrows the tails using a Rosenbluth algorithm, as detailed in ref. 29.
For starting configurations, we design idealized uniform zigzag configurations of 96-unit oligonucleosomes with dominant i + 2 zigzag or solenoidal topology approximating coordinates from cryo-EM and crystallographic structures. Furthermore, two different linker DNA lengths are modeled: NRL = 191 bp and 209 bp, which approximate, respectively, the NRLs of proliferating HeLa and differentiated cells. These 96-nucleosome arrays were built with a z-rise of 5 nm and triplet angle of 43.14°. Four conditions: without linker histone, −LH; with one linker histone per two nucleosomes, 1/2LH; with one linker histone per nucleosome, +LH; and one linker histone per one nucleosome and plus divalent ions, +LH+Mg2+, all at monovalent salt concentration of [NaCl] = 150 mM, were simulated for each fiber, with six ensemble runs started with different random seeds for each condition. All systems were run from idealized zigzag topologies, with additional solenoid structures run only for Mg2+ systems, in accordance with experimental evidence that divalent ions encourage solenoidal competition with zigzag topologies (16). For each set of parameters, three twist angles were considered, to model natural twist variations in chromatin DNA from –12° to +12° about the mean twist value (32). All simulations were run for 60–120 million steps or more, saving data every 10,000 steps, resulting in total energy values less than –103 kcal/mol and good convergence in terms of global properties (energy, sedimentation coefficients) and local features (triplet angles, dimer distances, etc.) of the fiber. These features were inspected to verify that SDs were small both across the conformations and throughout the trajectory frames used. The probability of occurrence and average step size of global and local (rotation, translation, tail regrowth) MC moves were adjusted for each simulation so that the accepted/attempted ratio varied between 0.3 and 0.5, with smooth energy convergence for all term types (bend, stretch, twist, Debye–Hückel, and Lennard–Jones). All resulting structures were also inspected visually to ensure that essentially small fluctuations about a global conformational mean occur over the last 10 million steps.
For all analyses, the last 1 million steps of each ensemble member (100 frames) were used in all plots presented. Standard ensemble averaging was performed and SDs calculated for each system. Interactions separated by a distance greater than seven nucleosomes were summed and are reported for clarity and comparison with experimental values. Interaction plots were size-corrected and normalized by a coefficient between 0.3 and 0.5 such that the maximum of the ensemble average values of 191 arrays corresponded to the maximum value in EMANIC metaphase data; similarly, the 209 NRL array data were scaled to CE cells. Tail–tail interaction frequencies were calculated using a cutoff of 18 Å (the van der Waals radius of tail beads) and normalized by total number of interactions counted for H2A, H2B, H3, and H4 tails in four separate categories: free tails (no interaction), parental linker DNA, nonparental linker DNA, parental nucleosomal (interactions with histones on the same core), and internucleosomal (interactions with histones on separate cores) interactions as discussed in ref. 16. The resulting tail interactions are presented in Fig. S8.
To determine the frequency of interaction between nucleosomes, we developed a method comparable to EMANIC in chromatin fibers (16). In our approach, nucleosome i is considered in contact with nucleosome j when the distance between a tail bead of i and a tail bead or core charge of j is smaller than the corresponding tail–tail or tail–core excluded volume distance (29). For a given frame M, such pairwise distances define a symmetric, binary interaction matrix for all nucleosome pairs, δi,j(M). The average of the matrix δi,j over sampled configurations gives the internucleosome interaction matrix I′(i,j). To determine the number of interactions for all elements separated by k neighbors, we define a function of k as follows:
where N is the total number of nucleosomes in the fiber (32). Resulting nucleosome interaction frequencies were determined using a 20-Å short-range cutoff in tail–tail distances, which were then normalized by the total number of interactions counted per ensemble.
Code Scaling.
To make possible simulations of large fibers to study regular folding and long-range interactions (>50 nucleosomes), we revamped our mesoscale code by an efficient scaling of long-range interactions by index parallelization. Standard message–passing–interface commands (BCAST and ALLREDUCE) were implemented such that each processor reads in coordinates at the onset of the simulation, when random numbers are generated on the master process. Subsequently, random numbers and coordinates are passed on to the entire system, where load balancing of long-range electrostatic terms is performed by index decomposition. All resulting energy terms are then collected, summed, and redistributed hierarchically through the master process with the ALLREDUCE command, at which point each process independently performs the MC acceptance/rejection protocols. This scheme has subsequently been shown to produce system-size scaling of computational speedup, allowing for efficient calculation of fibers several orders of magnitude larger than previously accessible.
Discussion
Our combined experiments and modeling of chromatin higher-order structures have presented, to our knowledge for the first time, the path and interactions of the nucleosome chain in interphase cells and metaphase chromosomes. Our results suggest a new hierarchical looping model for condensed chromatin. Such looping, also termed flaking in connection with folding ropes without tangling and self-crossing, as for mountain climbing and rappelling, appears to be an efficient mechanism for both condensing and accessing the genomic material; it also reconciles observations of sharp boundaries between chromosomal segments with experiments showing no distinct chromatin fibers, interpreted as a polymer melt.
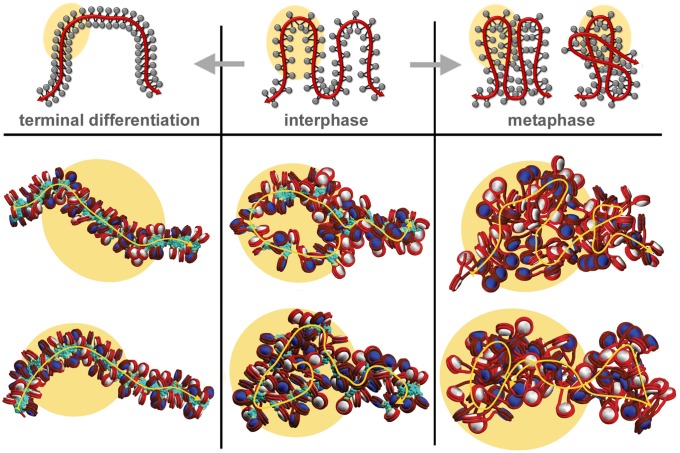
Previously, strong evidence for the zigzag nucleosome arrangement was provided by cryo-EM and tomographic studies in situ for differentiated cells with distinct 30- to 40-nm fibers (11, 12). However, such fibers were inexplicably absent from interphase chromatin and metaphase chromosomes of proliferating cells (13, 17, 19). Our data clearly show that the zigzag geometry is dominant in both the interphase and metaphase HeLa cells as well as terminally differentiated CE cells, suggesting a common nucleosome chain folding mode for all three cell types (Fig. 6). The absence of distinct 30-nm signals in proliferating cells can be explained by the open and irregular nucleosome array, lacking a uniform diameter (Fig. 6, Center and Right). Recent genome-wide in situ probing of short-range internucleosomal interactions in yeast nuclei is also consistent with a zigzag organization without a regular helical or repeated structure (15).
Fig. 6.
A three-state model of chromatin higher-order folding in proliferating and differentiated cells. Schematic drawing of nucleosome chain folding in living cells (Upper) and mesoscale chromatin models (Lower) suggest that increased linker histone association in the terminally differentiated state would stabilize compact and distinct 30-nm zigzag fibers (Left). In the proliferating (cycling) interphase state, the nucleosome chains are folded in loose zigzag-chain loops (Center). In the metaphase state, a reduction of linker histone binding would promote lateral associations between the nucleosome-chain loops to produce proximal loops that stack over each other, folding hierarchically at various angular orientations (Right). Linker histones are shown in turquoise.
Our chromatin fiber models with different levels of linker histone (Fig. 5) also show internucleosome interactions and folds in line with previous simulated and experimental trends (16, 32, 34). The fibers with reduced densities of linker histone are significantly more flexible than other fibers, in good agreement with recent observations regarding the absence of distinct 30-nm fibers in cycling cells (13, 17, 19). This type of fiber best represents the interphase chromatin (Fig. 6, Center). Our results are robust in the sense that common types of folding motifs for LH-depleted systems are consistently observed across various linker lengths and associated ensembles. Additionally, fibers with NRL = 209 bp and saturated linker histone (one molecule per nucleosome) fit well with terminally differentiated cells (Fig. 6, Left), which are known to contain distinct 30-nm fibers (12). Thus, our models can unify the views for the internal structure of both condensed chromatin fibers in differentiated cells and uncondensed interphase chromatin in proliferating cells.
The striking increase in intermediate-range interactions (i ± >7) for metaphase chromosomes (Figs. 2 and 3) is consistent with increased looping and flaking of nucleosome arrays during their tight condensation (Fig. 6). Our models of long chromatin fibers without linker histones (–LH) exhibit significant folding for both DNA linker lengths, and the resulting internucleosome interaction plots show excellent agreement with experiment in metaphase HeLa cells (Fig. 5 A–C). Specifically, fibers with reduced LH exhibit hierarchical looping (tertiary structures seen on Figs. 4 A–C and 6, Right), which, together with EMANIC, provide the best fit for metaphase chromosomes (Fig. 6, Right). The previously unseen ability of chromatin on this scale to maintain local geometric constraints (native i ± 2 interactions) while exhibiting flexible, higher-order folding is significant. These findings, in line with recent experimental data (15), provide an exciting interpretation of DNA structural compaction not yet observed at these scales (<20 kbp). Such hierarchical looping explains how linker histone modulates condensed fiber formation as well as unraveling, and underscores the role of linker histone variations in gene activation/silencing (35), cell differentiation (36), and communication between distant gene control elements (34). The proposed hierarchical looping motif is also consistent with ∼250-nm folding subunits in metaphase chromosomes (17).
Full compaction of the 30-nm fiber in vitro is achieved in most experimental systems by the binding of approximately one LH per nucleosome (5, 8, 26). However, LH is present at various lower levels in proliferating cells (31) and is not required for metaphase chromatin condensation (30, 37). The above-cited studies are consistent with our finding that the pattern of internucleosomal interactions in metaphase chromosomes is typical of chromatin without LHs (Fig. 5C). Linker histone H1 becomes extensively phosphorylated during mitosis, and the phosphorylated form has a reduced affinity to metaphase chromosomes (38). Furthermore, inhibition of histone H1 phosphorylation in metaphase-blocked cells was associated with chromosome decondensation (39). To account for these findings, we propose that phosphorylation of histone H1 at the metaphase stage promotes nucleosome chain flexibility and looping, leading ultimately to chromosome condensation. Importantly, our recent mesoscale modeling with flexible LH tails showed that a reduction of the net positive charge on the histone H1 C-terminal tail led to asymmetric binding with nucleosomes, reduced association with DNA linkers, and enhanced long-range interactions (33).
In interphase nuclei, genome-wide chromosome conformation capture studies reveal long-distance chromatin interactions ranging from a dozen kilobases to several megabases of DNA in conserved topologically associating domains (TADs) (40, 41) that reflect structural organization of the genome (1). In contrast, similar studies in metaphase chromosomes suggest a homogeneous state described by chromatin loops compressed along the chromosomal axis with diminished TADs and other genomic interactions (20). Our model reconciles both observations by showing that the transition between the open chromatin loops in interphase chromatin and hierarchical looping in metaphase chromosomes (Fig. 6) obscures genomic interactions seen in interphase chromatin (21) due to formation of new long-range chromosomal contacts.
The type of interactions at the range of <20 kb of DNA revealed by our EM-assisted nucleosome capture experiments and modeling suggest a global nucleosome array condensation mechanism: in mitosis, the loop size would be modulated by factors promoting frequency of loop formation along the chromosome axis such as condensin (30, 37) as well as chromatin fiber flexibility and interdigitation such as decreased linker histone affinity (38), metaphase-specific histone modifications (42), and increased divalent cation association (43). Further experimental and modeling studies of nucleosome interactions using high-resolution multiscale computational approaches (2, 44) are essential for connecting chromatin's structural and epigenetic states.
Materials and Methods
Cells.
HeLa cells were grown to ∼90% confluence and gently washed by pipetting to detach the mitotic cells. To block mitosis in metaphase, cells were incubated with 0.1 μg/mL colcemid (Gibco 15210-040) or 0.4 μg/mL nocodazole (Sigma M1404) for 16 h, and cell layers were gently washed by pipetting. The detached cells (>98% in metaphases) were collected by centrifugation for 3 min at 1,000 × g. Fresh chicken whole blood was obtained from Bell and Evans, and CEs were isolated as in ref. 27. HeLa S3 cells (ATCC no. CCL-2.2) were grown at +37 °C and 5% CO2 in RPMI medium 1640 (Invitrogen) and 10% FBS (HyClone SH30071.03).
Chromatin Cross-Linking by Formaldehyde.
In vitro formaldehyde fixation of reconstituted oligonucleosome arrays was conducted as in ref. 16. For in situ EMANIC, the attached interphase HeLa cells were washed twice with PBS and cross-linked for 10 min at room temperature with 0.1–1% formaldehyde in PBS while still attached to the culture dishes. Detached mitotic HeLa cells were spun down for 3 min at 1,000 × g, washed twice with PBS, and cross-linked for 10 min at room temperature with 0.1–1% formaldehyde in PBS in suspension. Cross-linking was stopped by adding 125 mM glycine and rapidly cooling on ice. Chromatin was isolated and unfolded for imaging by transmission EM as described in SI Materials and Methods.
EMANIC.
For transmission electron microscopy of the partially cross-linked nucleosome arrays, we used positive staining with uranyl acetate and dark-field mode imaging that was modified for EMANIC by optimizing the thickness of the carbon coating, mesh size of EM grids, stain concentrations, and grid treatments and washing regimens. EMANIC analysis of in vitro and in situ cross-linked arrays was conducted essentially as described (16). EMANIC data are presented by two types of bar charts: as a fraction of total nucleosomes (cross-linked and free) convenient to relate the efficiencies of cross-linking in different samples and as fraction of combined interactions (i ± 1 to i ± 24) convenient to relate to model predictions and compare samples with different size distributions (SI Materials and Methods).
Supplementary Material
Acknowledgments
We thank Antoni Luque (San Diego State University) for his modeling work on earlier aspects of this project; undergraduate interns at Pennsylvania State College of Medicine: Elizabeth Blaisse and Valentina Kostyuk for experimental assistance; R. Myers for technical assistance with electron microscopy at the Pennsylvania State Hershey Imaging Facility; and computing support from New York University High Performance Computing clusters and Blue Gene at Computational Center for Nanotechnology Innovations. This work was supported by National Science Foundation Grants MCB-1021681 and 1516999 (to S.A.G.), NIH Grant R01 GM55164 (to T.S.), and Philip Morris USA and Philip Morris International (T.S.).
Footnotes
The authors declare no conflict of interest.
This article is a PNAS Direct Submission.
This article contains supporting information online at www.pnas.org/lookup/suppl/doi:10.1073/pnas.1518280113/-/DCSupplemental.
References
- 1.Eagen KP, Hartl TA, Kornberg RD. Stable chromosome condensation revealed by chromosome conformation capture. Cell. 2015;163(4):934–946. doi: 10.1016/j.cell.2015.10.026. [DOI] [PMC free article] [PubMed] [Google Scholar]
- 2.Ozer G, Luque A, Schlick T. The chromatin fiber: Multiscale problems and approaches. Curr Opin Struct Biol. 2015;31:124–139. doi: 10.1016/j.sbi.2015.04.002. [DOI] [PMC free article] [PubMed] [Google Scholar]
- 3.Richmond TJ, Davey CA. The structure of DNA in the nucleosome core. Nature. 2003;423(6936):145–150. doi: 10.1038/nature01595. [DOI] [PubMed] [Google Scholar]
- 4.Schalch T, Duda S, Sargent DF, Richmond TJ. X-ray structure of a tetranucleosome and its implications for the chromatin fibre. Nature. 2005;436(7047):138–141. doi: 10.1038/nature03686. [DOI] [PubMed] [Google Scholar]
- 5.Thoma F, Koller T, Klug A. Involvement of histone H1 in the organization of the nucleosome and of the salt-dependent superstructures of chromatin. J Cell Biol. 1979;83(2 Pt 1):403–427. doi: 10.1083/jcb.83.2.403. [DOI] [PMC free article] [PubMed] [Google Scholar]
- 6.Gerchman SE, Ramakrishnan V. Chromatin higher-order structure studied by neutron scattering and scanning transmission electron microscopy. Proc Natl Acad Sci USA. 1987;84(22):7802–7806. doi: 10.1073/pnas.84.22.7802. [DOI] [PMC free article] [PubMed] [Google Scholar]
- 7.Ghirlando R, Felsenfeld G. Hydrodynamic studies on defined heterochromatin fragments support a 30-nm fiber having six nucleosomes per turn. J Mol Biol. 2008;376(5):1417–1425. doi: 10.1016/j.jmb.2007.12.051. [DOI] [PMC free article] [PubMed] [Google Scholar]
- 8.Song F, et al. Cryo-EM study of the chromatin fiber reveals a double helix twisted by tetranucleosomal units. Science. 2014;344(6182):376–380. doi: 10.1126/science.1251413. [DOI] [PubMed] [Google Scholar]
- 9.Grigoryev SA, Woodcock CL. Chromatin organization—the 30 nm fiber. Exp Cell Res. 2012;318(12):1448–1455. doi: 10.1016/j.yexcr.2012.02.014. [DOI] [PubMed] [Google Scholar]
- 10.Luger K, Dechassa ML, Tremethick DJ. New insights into nucleosome and chromatin structure: An ordered state or a disordered affair? Nat Rev Mol Cell Biol. 2012;13(7):436–447. doi: 10.1038/nrm3382. [DOI] [PMC free article] [PubMed] [Google Scholar]
- 11.Horowitz RA, Agard DA, Sedat JW, Woodcock CL. The three-dimensional architecture of chromatin in situ: Electron tomography reveals fibers composed of a continuously variable zig-zag nucleosomal ribbon. J Cell Biol. 1994;125(1):1–10. doi: 10.1083/jcb.125.1.1. [DOI] [PMC free article] [PubMed] [Google Scholar]
- 12.Scheffer MP, Eltsov M, Frangakis AS. Evidence for short-range helical order in the 30-nm chromatin fibers of erythrocyte nuclei. Proc Natl Acad Sci USA. 2011;108(41):16992–16997. doi: 10.1073/pnas.1108268108. [DOI] [PMC free article] [PubMed] [Google Scholar]
- 13.Fussner E, et al. Constitutive heterochromatin reorganization during somatic cell reprogramming. EMBO J. 2011;30(9):1778–1789. doi: 10.1038/emboj.2011.96. [DOI] [PMC free article] [PubMed] [Google Scholar]
- 14.Ricci MA, Manzo C, García-Parajo MF, Lakadamyali M, Cosma MP. Chromatin fibers are formed by heterogeneous groups of nucleosomes in vivo. Cell. 2015;160(6):1145–1158. doi: 10.1016/j.cell.2015.01.054. [DOI] [PubMed] [Google Scholar]
- 15.Hsieh TH, et al. Mapping nucleosome resolution chromosome folding in yeast by micro-C. Cell. 2015;162(1):108–119. doi: 10.1016/j.cell.2015.05.048. [DOI] [PMC free article] [PubMed] [Google Scholar]
- 16.Grigoryev SA, Arya G, Correll S, Woodcock CL, Schlick T. Evidence for heteromorphic chromatin fibers from analysis of nucleosome interactions. Proc Natl Acad Sci USA. 2009;106(32):13317–13322. doi: 10.1073/pnas.0903280106. [DOI] [PMC free article] [PubMed] [Google Scholar]
- 17.Strukov YG, Wang Y, Belmont AS. Engineered chromosome regions with altered sequence composition demonstrate hierarchical large-scale folding within metaphase chromosomes. J Cell Biol. 2003;162(1):23–35. doi: 10.1083/jcb.200303098. [DOI] [PMC free article] [PubMed] [Google Scholar]
- 18.Eltsov M, Maclellan KM, Maeshima K, Frangakis AS, Dubochet J. Analysis of cryo-electron microscopy images does not support the existence of 30-nm chromatin fibers in mitotic chromosomes in situ. Proc Natl Acad Sci USA. 2008;105(50):19732–19737. doi: 10.1073/pnas.0810057105. [DOI] [PMC free article] [PubMed] [Google Scholar]
- 19.Nishino Y, et al. Human mitotic chromosomes consist predominantly of irregularly folded nucleosome fibres without a 30-nm chromatin structure. EMBO J. 2012;31(7):1644–1653. doi: 10.1038/emboj.2012.35. [DOI] [PMC free article] [PubMed] [Google Scholar]
- 20.Naumova N, et al. Organization of the mitotic chromosome. Science. 2013;342(6161):948–953. doi: 10.1126/science.1236083. [DOI] [PMC free article] [PubMed] [Google Scholar]
- 21.Imakaev MV, Fudenberg G, Mirny LA. Modeling chromosomes: Beyond pretty pictures. FEBS Lett. 2015;589(20 Pt A):3031–3036. doi: 10.1016/j.febslet.2015.09.004. [DOI] [PMC free article] [PubMed] [Google Scholar]
- 22.Daban JR. Stacked thin layers of metaphase chromatin explain the geometry of chromosome rearrangements and banding. Sci Rep. 2015;5:14891. doi: 10.1038/srep14891. [DOI] [PMC free article] [PubMed] [Google Scholar]
- 23.McDowall AW, Smith JM, Dubochet J. Cryo-electron microscopy of vitrified chromosomes in situ. EMBO J. 1986;5(6):1395–1402. doi: 10.1002/j.1460-2075.1986.tb04373.x. [DOI] [PMC free article] [PubMed] [Google Scholar]
- 24.Lowary PT, Widom J. Higher-order structure of Saccharomyces cerevisiae chromatin. Proc Natl Acad Sci USA. 1989;86(21):8266–8270. doi: 10.1073/pnas.86.21.8266. [DOI] [PMC free article] [PubMed] [Google Scholar]
- 25.Belmont AS. Large-scale chromatin organization: The good, the surprising, and the still perplexing. Curr Opin Cell Biol. 2014;26:69–78. doi: 10.1016/j.ceb.2013.10.002. [DOI] [PMC free article] [PubMed] [Google Scholar]
- 26.Robinson PJ, Fairall L, Huynh VA, Rhodes D. EM measurements define the dimensions of the “30-nm” chromatin fiber: Evidence for a compact, interdigitated structure. Proc Natl Acad Sci USA. 2006;103(17):6506–6511. doi: 10.1073/pnas.0601212103. [DOI] [PMC free article] [PubMed] [Google Scholar]
- 27.Correll SJ, Schubert MH, Grigoryev SA. Short nucleosome repeats impose rotational modulations on chromatin fibre folding. EMBO J. 2012;31(10):2416–2426. doi: 10.1038/emboj.2012.80. [DOI] [PMC free article] [PubMed] [Google Scholar]
- 28.van Holde KE. Chromatin. Springer; New York: 1988. [Google Scholar]
- 29.Arya G, Schlick T. Role of histone tails in chromatin folding revealed by a mesoscopic oligonucleosome model. Proc Natl Acad Sci USA. 2006;103(44):16236–16241. doi: 10.1073/pnas.0604817103. [DOI] [PMC free article] [PubMed] [Google Scholar]
- 30.Hashimoto H, et al. Histone H1 null vertebrate cells exhibit altered nucleosome architecture. Nucleic Acids Res. 2010;38(11):3533–3545. doi: 10.1093/nar/gkq076. [DOI] [PMC free article] [PubMed] [Google Scholar]
- 31.Woodcock CL, Skoultchi AI, Fan Y. Role of linker histone in chromatin structure and function: H1 stoichiometry and nucleosome repeat length. Chromosome Res. 2006;14(1):17–25. doi: 10.1007/s10577-005-1024-3. [DOI] [PubMed] [Google Scholar]
- 32.Perišić O, Collepardo-Guevara R, Schlick T. Modeling studies of chromatin fiber structure as a function of DNA linker length. J Mol Biol. 2010;403(5):777–802. doi: 10.1016/j.jmb.2010.07.057. [DOI] [PMC free article] [PubMed] [Google Scholar]
- 33.Luque A, Collepardo-Guevara R, Grigoryev S, Schlick T. Dynamic condensation of linker histone C-terminal domain regulates chromatin structure. Nucleic Acids Res. 2014;42(12):7553–7560. doi: 10.1093/nar/gku491. [DOI] [PMC free article] [PubMed] [Google Scholar]
- 34.Kulaeva OI, et al. Internucleosomal interactions mediated by histone tails allow distant communication in chromatin. J Biol Chem. 2012;287(24):20248–20257. doi: 10.1074/jbc.M111.333104. [DOI] [PMC free article] [PubMed] [Google Scholar]
- 35.Bhattacharjee RN, Banks GC, Trotter KW, Lee HL, Archer TK. Histone H1 phosphorylation by Cdk2 selectively modulates mouse mammary tumor virus transcription through chromatin remodeling. Mol Cell Biol. 2001;21(16):5417–5425. doi: 10.1128/MCB.21.16.5417-5425.2001. [DOI] [PMC free article] [PubMed] [Google Scholar]
- 36.Zhang Y, et al. Histone h1 depletion impairs embryonic stem cell differentiation. PLoS Genet. 2012;8(5):e1002691. doi: 10.1371/journal.pgen.1002691. [DOI] [PMC free article] [PubMed] [Google Scholar]
- 37.Shintomi K, Takahashi TS, Hirano T. Reconstitution of mitotic chromatids with a minimum set of purified factors. Nat Cell Biol. 2015;17(8):1014–1023. doi: 10.1038/ncb3187. [DOI] [PubMed] [Google Scholar]
- 38.Bleher R, Martin R. Nucleo-cytoplasmic translocation of histone H1 during the HeLa cell cycle. Chromosoma. 1999;108(5):308–316. doi: 10.1007/s004120050382. [DOI] [PubMed] [Google Scholar]
- 39.Th’ng JP, Guo XW, Swank RA, Crissman HA, Bradbury EM. Inhibition of histone phosphorylation by staurosporine leads to chromosome decondensation. J Biol Chem. 1994;269(13):9568–9573. [PubMed] [Google Scholar]
- 40.Nora EP, et al. Spatial partitioning of the regulatory landscape of the X-inactivation centre. Nature. 2012;485(7398):381–385. doi: 10.1038/nature11049. [DOI] [PMC free article] [PubMed] [Google Scholar]
- 41.Lieberman-Aiden E, et al. Comprehensive mapping of long-range interactions reveals folding principles of the human genome. Science. 2009;326(5950):289–293. doi: 10.1126/science.1181369. [DOI] [PMC free article] [PubMed] [Google Scholar]
- 42.Wilkins BJ, et al. A cascade of histone modifications induces chromatin condensation in mitosis. Science. 2014;343(6166):77–80. doi: 10.1126/science.1244508. [DOI] [PubMed] [Google Scholar]
- 43.Strick R, Strissel PL, Gavrilov K, Levi-Setti R. Cation-chromatin binding as shown by ion microscopy is essential for the structural integrity of chromosomes. J Cell Biol. 2001;155(6):899–910. doi: 10.1083/jcb.200105026. [DOI] [PMC free article] [PubMed] [Google Scholar]
- 44.Collepardo-Guevara R, et al. Chromatin unfolding by epigenetic modifications explained by dramatic impairment of internucleosome interactions: A multiscale computational study. J Am Chem Soc. 2015;137(32):10205–10215. doi: 10.1021/jacs.5b04086. [DOI] [PMC free article] [PubMed] [Google Scholar]
- 45.Zhang Q, Beard DA, Schlick T. Constructing irregular surfaces to enclose macromolecular complexes for mesoscale modeling using the discrete surface charge optimization (DISCO) algorithm. J Comput Chem. 2003;24(16):2063–2074. doi: 10.1002/jcc.10337. [DOI] [PubMed] [Google Scholar]
- 46.Schlick T, Li B, Olson WK. The influence of salt on the structure and energetics of supercoiled DNA. Biophys J. 1994;67(6):2146–2166. doi: 10.1016/S0006-3495(94)80732-5. [DOI] [PMC free article] [PubMed] [Google Scholar]
- 47.Arya G, Schlick T. A tale of tails: How histone tails mediate chromatin compaction in different salt and linker histone environments. J Phys Chem A. 2009;113(16):4045–4059. doi: 10.1021/jp810375d. [DOI] [PMC free article] [PubMed] [Google Scholar]
Associated Data
This section collects any data citations, data availability statements, or supplementary materials included in this article.


