Significance
FoxP3+ regulatory T (Treg) cells are essential controllers of immune and autoimmune responses. Their homeostatic balance integrates genetic and environmental inputs, which result in marked interindividual variation in their proportions in mice and humans. The instability of Treg cells and of the lineage-determining factor FoxP3 observed here in the NZW strain, accompanied by low sensitivity to trophic cytokines and network-level dysregulation of the Treg transcriptional signature, has implications for our understanding and potential therapeutic handling of Treg-linked disease—autoimmune or neoplastic.
Keywords: Treg homeostasis, FoxP3 stability, immunoregulation, inbred mice
Abstract
Regulatory T (Treg) cells that express the transcription factor FoxP3 play a key role in self-tolerance and the control of inflammation. In mice and humans, there is a wide interindividual range in Treg frequency, but little is known about the underlying genetic or epigenetic mechanisms. We explored this issue in inbred strains of mice, with a special focus on the low proportion of Treg cells found in NZW mice. Mixed bone marrow chimera experiments showed this paucity to be intrinsic to NZW Treg cells, a dearth that could be tied to poor stability of the Treg pool and of FoxP3 expression. This instability was not a consequence of differential epigenetic marks, because Treg-specific CpG hypomethylation profiles at the Foxp3 locus were similar in all strains tested. It was also unrelated to the high expression of IFN signature genes in NZW, as shown by intercross to mice with an Ifnar1 knockout. NZW Tregs were less sensitive to limiting doses of trophic cytokines, IL-2 and -33, for population homeostasis and for maintenance of FoxP3 expression. Gene-expression profiles highlighted specific differences in the transcriptome of NZW Tregs compared with those of other strains, but no single defect could obviously account for the instability. Rather, NZW Tregs showed a general up-regulation of transcripts normally repressed in Treg cells, and we speculate that this network-level bias may account for NZW Treg instability.
FoxP3+ T regulatory (Treg) cells help maintain lymphoid homeostasis in many immunological contexts: tolerance to self vs. autoimmune deviation, fetal–maternal tolerance, allergy, responses to pathogens, and interactions with commensal microbes (1–3). Their importance is highlighted by the devastating multiorgan inflammation of FoxP3-deficient scurfy mice or immunodysregulation polyendocrinopathy enteropathy X-linked (IPEX) patients (4). In addition, Treg cells partake in extraimmune regulatory activities (3). In keeping with these pleiotropic roles, several pathways and molecular mediators partake in Treg cell function, involving cell–cell interactions, soluble cytokines, or small-molecule mediators (5, 6). A number of phenotypic variants of FoxP3+ T cells have been described, with different effector functions and tissue localizations (7). Treg cells share a common transcriptional program that distinguishes them from “conventional” CD4+ (Tconv) cells (8, 9), of which different facets are controlled by FoxP3 interaction with several transcriptional cofactors, and FoxP3-dependent and -independent chromatin modifications (10).
Treg cells are under strong homeostatic control (11, 12), perhaps made most evident for the rapid amplification that restores, in a matter of days, normal proportions of Treg cells after their acute ablation in mice (13, 14). Cytokines—IL-2 foremost—are thought to be the main controllers of Treg proportions and numbers (15–22), although the relative importance of these controllers varies with location and subphenotype [e.g., the alarmin IL-33 has a more profound role in tissue Tregs (21–23)]. Perhaps surprisingly, in light of this apparently tight control, there is a wide range of variation in Treg proportions, with several studies having observed up to fourfold variation in the blood of healthy humans (e.g., refs. 24–26). The same variation is observed among inbred mouse strains (27, 28). It must be said, however, that after many contradictory reports, often from insufficiently powered or confounded studies, there is limited evidence that these Treg variations in blood correlate with autoimmune disease, in humans or in mice.
Beyond the question of homeostatic control of Treg cell numbers and proportion, the phenotypic stability of Treg cells has received much attention (extensively reviewed in ref. 29). Stability of the suppressive phenotype is important for Treg cells, given their T-cell receptor’s (TCR’s) propensity to self-reactivity, to avoid their conversion into proinflammatory effectors. Although early reports of large-scale dedifferentiation of Treg cells into Th1/17 effectors were likely artifacts of incompletely tight lineage-tracing systems or of transfer into alymphoid hosts, exposure of Treg cells to conditions of inflammatory stress or deficiency in trophic cytokines destabilizes FoxP3 expression, removing its repression of cytokine and other effector genes. This stability is reinforced at the molecular level by specific demethylation at particular regions of the Foxp3 locus and other key Treg transcripts that correlate with stable expression and by feedback loops involving protein cofactors and miRNAs that act as genetic switches to lock in the core Treg phenotype (30, 31).
An earlier report highlighted the range of variation in CD25hi putative Treg cells across a broad range of inbred mouse strains. Here, we expanded on these studies by examining the underlying cellular and molecular underpinnings of these variations, focusing more specifically on the very low proportion of Treg cells found in lymphoid organs of the NZW/LacJ strain. The results point to a disconnect between Treg thymic selection and peripheral maintenance, the latter dominated in this instance by instability intrinsic to Tregs, at the molecular and cellular levels.
Results
FoxP3 Treg Cell Proportions Across Inbred Strains of Mice.
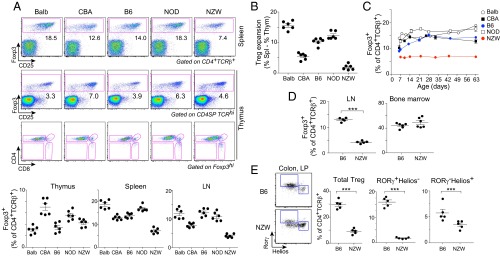
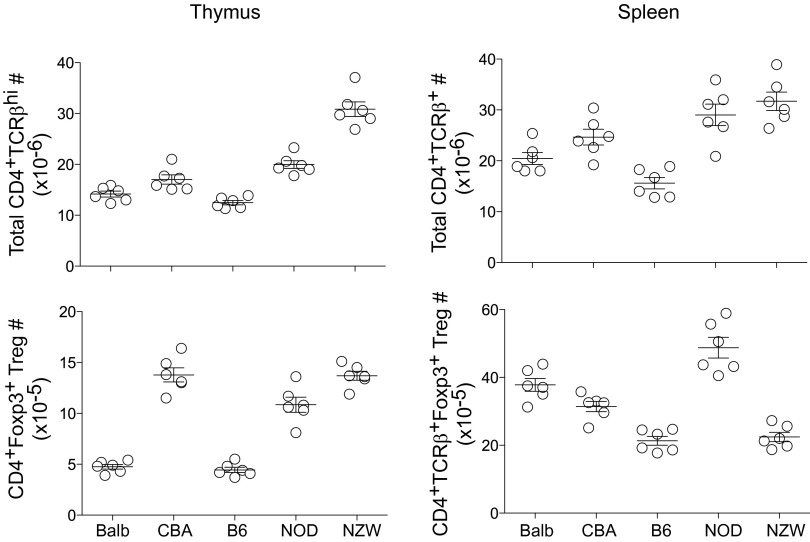
After on our earlier screen (27) that showed a wide range of variation in Treg frequencies among inbred strains, we analyzed in more detail a representative panel of five inbred strains harboring the greatest differences: Balb/cByJ, C57BL/6, CBA/J, NOD/Ltj, and NZW/LacJ (hereafter Balb, B6, CBA, NOD, and NZW). The latter two were chosen for their relevance to autoimmune diseases [autoimmune diabetes (NOD) or contribution to lupus-like disease in the NZWxNZB F1]. Wide differences in proportions of splenic Treg cells were again observed across these inbred strains, with NOD and NZW representing opposite extremes (Fig. 1A, Upper). In terms of numbers, NOD and Balb mice had large Treg pools in line with their proportions (Fig. S1). NZW mice had a generally large CD4+ T population, but not the Treg numbers that would be expected. In the thymus, normal profiles of differentiation were observed in all strains, FoxP3hi cells being found mainly in the CD4 single-positive compartment (Fig. 1A). The rankings were different when comparing spleen and thymic Tregs, indicating that the size of the splenic Treg pool responds to independent homeostatic cues and that the low proportion of NZW Tregs does not result from biased thymic differentiation. This difference was illustrated by calculating the difference between proportions of thymic and splenic Tregs. There was an expansion in all strains, which was very sharp for Balb but almost absent for NZW (Fig. 1B).
Fig. 1.
Interstrain variations in Treg cell frequency. (A) Representative flow-cytometry plots of spleen and thymic Treg cells (Upper); values were pooled from several experiments (Lower). (B) Difference in Treg proportions between spleen and thymus (data from A). (C) Kinetic of Foxp3+Treg cells appearance in spleen (averaged from n = 2–3 per time point). (D) Foxp3+ Treg cell percentages in LN and BM. (E) Colonic LP Tregs shown as proportion of CD4+TCRβ+ for total Treg or the main RORγ+Helios− and RORγ−Helios+ subsets. Data were pooled from two independent experiments.
Fig. S1.
Total T-cell and Treg cell numbers in main lymphoid organs. Total CD4+TCRβ+ T-cell numbers in thymus and spleen of 9-wk-old males (Upper Left and Upper Right, respectively). Total CD4+TCRβ+Foxp3+Treg cell numbers in thymus and spleen (n = 6 per group).
We analyzed the kinetics of appearance of Treg cells in the spleen during ontogeny. Differences in the proportions of FoxP3+ Tregs within the CD4+ T-cell compartment were already present in 7-d-old mice, although they were further amplified with time. The NZW phenotype was already notable a few days after birth and persisted in adult mice (Fig. 1C).
We then focused on the NZW phenotype, which may be a model for subclinical Treg deficiency. The relative paucity of Treg cells was present in lymph nodes (LNs), ruling out spleen-specific differences (Fig. 1D). The Hunter group has recently described an unusually high proportion of Tregs among bone marrow (BM) CD4+ T cells. Interestingly, the relative dearth of Treg cells was absent in the NZW BM. Several groups have described distinct Treg subpopulations in the colonic lamina propria (LP), which differ in their origin, relation to the gut microbiota, and expression of key transcription factors (23, 32–35). Treg cells were found in low proportions in the NZW colonic LP (Fig. 1E), with this drop being marked for RORγ+Helios− Tregs. Thus, NZW mice stand out with their widespread Treg deficit, which spans almost all compartments, with the striking exception of the BM.
Intrinsic Factors Influence Treg Proportions.
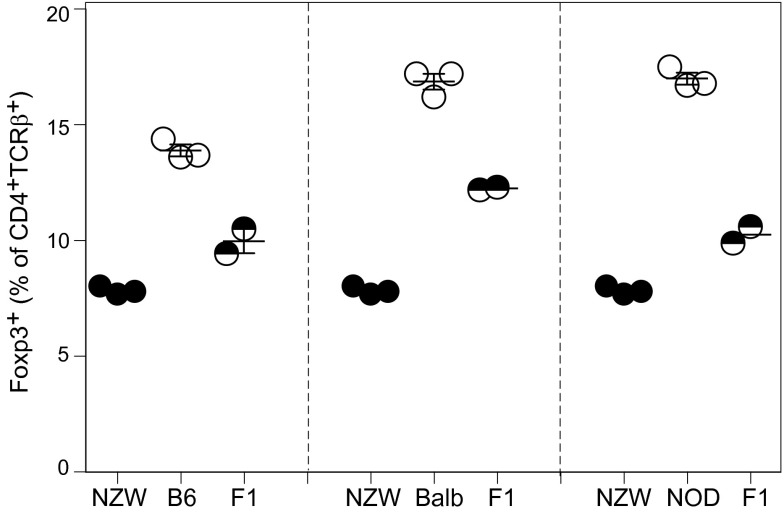
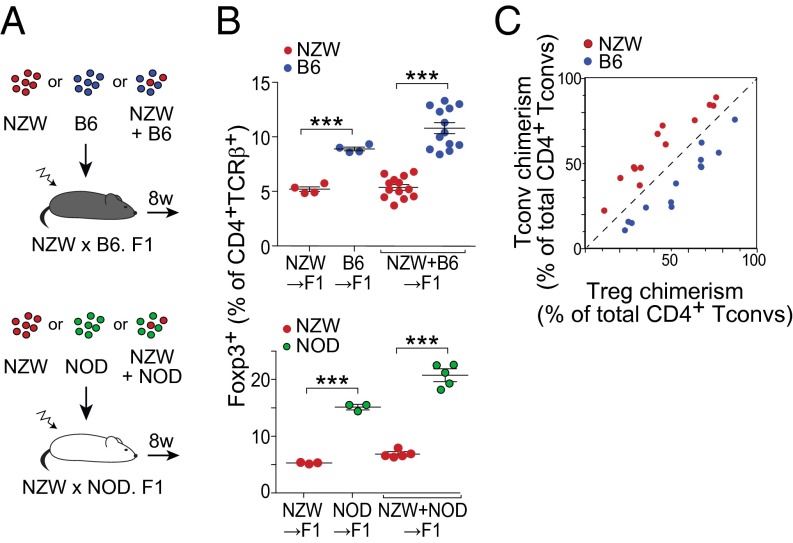
The low proportion of Treg cells in spleen of NZW mice might reflect genetic differences intrinsic to NZW Treg themselves or alterations in other immunocytes or in stromal cells that support or influence them. To address this issue, we performed mixed BM chimera experiments, using as hosts F1 mice from an intercross between NZW and B6 (or NOD) to avoid rejection across major histocompatibility complex barriers. These F1 mice had Treg proportions intermediate between the two parent strains, confirming a genetic determinism, likely polygenic (Fig. S2). The F1 hosts were irradiated and reconstituted with BM cells from NZW and B6 origin, alone or mixed in varying proportions, ranging for 10–90% (Fig. 2 A, Upper, and B, Upper; similar experiments were performed in the NZWxNOD combination, at a 50/50 ratio only, and results are shown in Fig. 2 A, Lower, and B, Lower). In mice reconstituted with pure BM cells from either parent, the proportion of splenic Treg cells in the resulting CD4+ T-cell pool largely recapitulated that of the parent strains (Fig. 2B, Left). After reconstitution with a mix of parental BM cells, the same differences were observed, even slightly accentuated (Fig. 2B, Right).
Fig. S2.
Intercross between NZW and B6 or NOD mice. Percentage of splenic Foxp3+ Treg cells among CD4+TCRβ+ T cells from 9-wk-old (NZWxB6) or (NZWxNOD) F1 males (n = 3 per group).
Fig. 2.
Factors intrinsic to NZW Treg cells themselves restrain low percentage in spleen. (A) Schematic representation of the BM chimeras reconstituted with one or a mix of parental BM. (B) Percentage of splenic FoxP3+ Treg cells of either origin. (C) Relation between the proportion of each donor (chimerism) in Treg and Tconv cells, with each mouse represented by two points. Data were pooled from two independent experiments.
Because the mixed BM chimeras combined stromal and myeloid elements from both parents, reproducing the strain-specific differences in Treg proportions demonstrated that the differences were intrinsic to CD4+ T cells. To determine whether the difference varied with the actual representation of CD4+ T cells from either parent in each chimera, we replotted the mixed-chimera data to relate the chimerism in Treg and Tconv cells (Fig. 2C), which showed a constant underrepresentation of NZW-derived across all donor proportions. This finding means that the low proportion of Tregs derived from NZW stem cells is not affected by the overall representation of B6 or NZW Tconv cells. The implication is that the different Treg/Tconv proportions were intrinsic to CD4+ T cells, ruling out as an explanation a differential supply of trophic cytokines like IL-2 by Tconv cells or a competition between NZW Tregs for limited homeostatic support.
Turnover and Stability of the CD4+ Foxp3+ Treg Cell Pool.
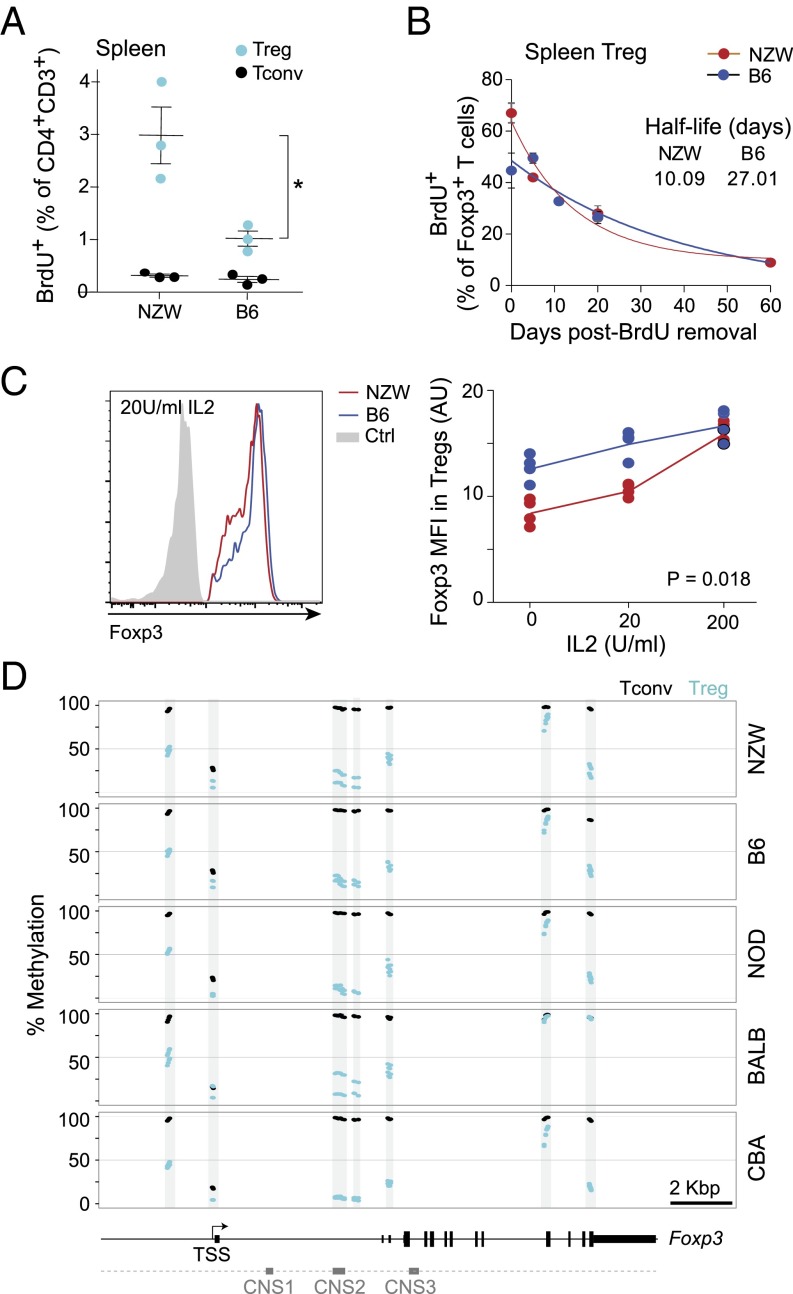
We then analyzed Treg population dynamics. Because a defect in proliferative expansion might account for the lower proportion of Treg cells, we determined the rate of cell division via short-term bromo-deoxyuridine (BrdU) labeling (Fig. 3A). Marked proliferation of Treg cells from NZW mice was observed, with approximately threefold more Treg cells actively proliferating than in B6 mice. In contrast, Tconv cells from the two strains divided at similar low rates, indicating that the cell-cycling differences observed in Tregs did not affect the T cells as a whole. To explore the decay of the NZW Treg population, we performed a chase experiment after long-term (5-wk) BrdU labeling (Fig. 3B). The loss of BrdU+ cells after BrdU removal was substantially faster among for NZW than for B6 Tregs (half-life 10.09 and 27.01 d, respectively; Fig. 3B). Thus, Treg populations appeared less stable in NZW than B6 mice, with a high proliferation rate likely in compensation.
Fig. 3.
Instability of NZW Treg and Foxp3 expression. (A) Proportion of BrdU-labeled Treg and Tconv cells after 6-h incorporation in vivo. (B) Clearance of BrdU-labeled Treg cells, previously labeled for 5 wk with BrdU in drinking water. Data were fit to an exponential (n = 2–4 mice per time point; data pooled from two independent experiments). (C) Loss of FoxP3 expression in sorted CD4+TCRβ+CD25hi Tregs cultured with varying amounts of IL-2 for 48 h; three independent experiments are summarized in Right. *P = 0.018. (D) Proportion of methylated CpG at the Foxp3 locus in splenic CD25hi Treg and naive Tconv cells (in duplicate).
Given this relative instability of Treg cells in NZW mice, we hypothesized that instability in Foxp3 expression might be involved, because sustained FoxP3 is necessary for Treg stability (36). We compared Foxp3 expression in Treg cells from NZW and B6 mice placed under conditions of limiting trophic cytokines in vitro, which leads to a gradual loss of FoxP3 (37, 38). Primary Tregs were sorted and cultured with anti-CD3/CD28 stimulation and no or limiting concentrations of IL-2, after which intracellular Foxp3 protein was quantitated by flow cytometry (Fig. 3C). With low or no IL-2 addition, FoxP3 decreased significantly more in Treg cells from NZW than B6 mice, although the difference disappeared at saturating doses of IL-2 (200 U/mL). Thus, FoxP3 was less stable in NZW than in B6 Tregs under conditions of homeostatic stress.
The stability of FoxP3 expression is associated with DNA hypomethylation at specific CpG-containing regions of the Foxp3 locus, in particular in the CNS2 region, which is important to stabilize FoxP3 expression (38, 39). We thus analyzed CpG methylation in DNA from Treg and Tconv cells (two independent samples per strain). Methylation frequencies followed published patterns, with strong Treg vs. Tconv differences at several locations (upstream enhancer, CNS2). The patterns were essentially identical for all strains, however, with only minor differences (CNS2 hypomethylation strongest in NOD and an additional hypomethylated site in the 3′ UTR for CBA Tregs) that did not correlate with Treg proportions and were not NZW-specific (Fig. 3D).
In Vivo Responsiveness of Treg Cells to Trophic Cytokines.
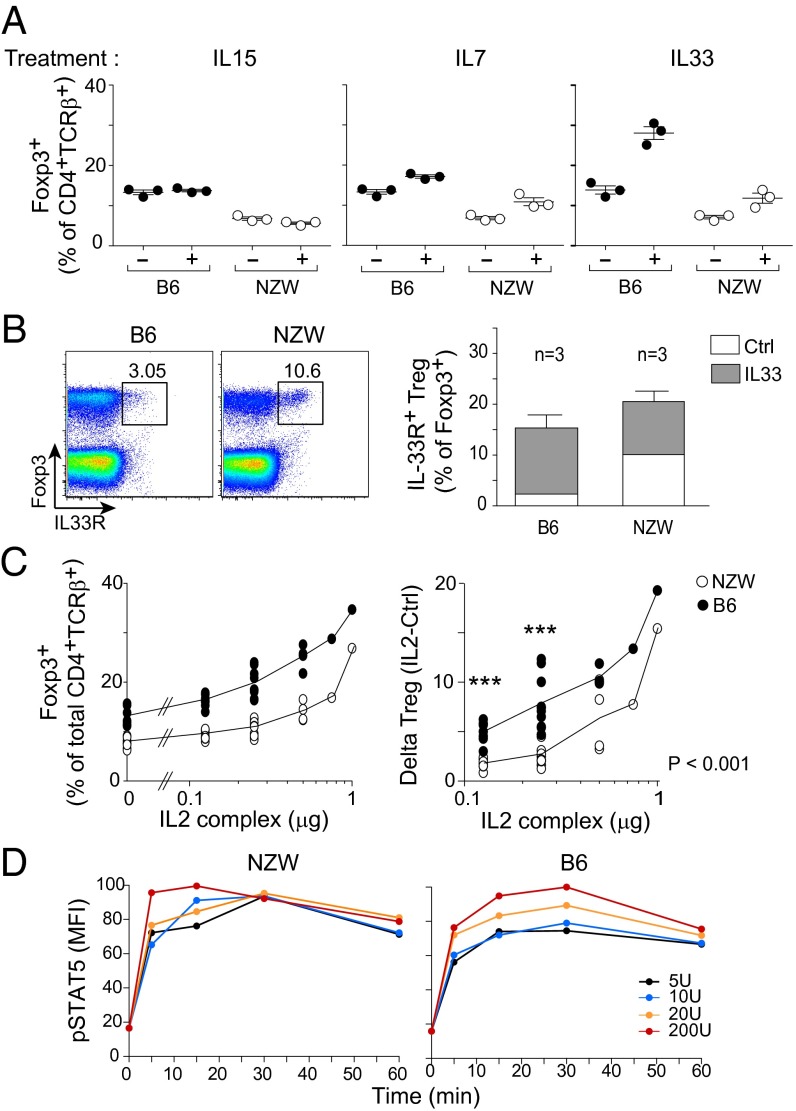
Continuous stimulation of Treg cells with trophic cytokines is crucial for maintaining their survival and stability in vivo. Of these cytokines, IL-2 is the most recognized (15, 16), but there have been reports that IL-7 (17–19), IL-15 (19, 20), and IL-33 (21, 22, 40) also influence Treg homeostasis. Insufficient response to signals delivered by trophic cytokines may thus account for Treg instability in NZW mice. We investigated how NZW Treg cells expanded in response to IL-7 or -15 (administered as stabilized but active complexes with a specific mAb) or IL-33. IL-15 induced no significant changes, and IL-7 modestly increased the proportions of splenic Treg cells, but similarly in both strains (Fig. 4A). IL-33 is a member of the IL-1 family of cytokines, and its receptor, IL-33R (a.k.a. ST2), is expressed on a fraction of Treg cells, particularly in nonlymphoid tissue Tregs, the main responders to IL-33 (3). Administration of IL-33 induced a stronger increase in splenic Tregs of B6 mice (Fig. 4A), and, paradoxically, IL-33R was expressed by more Tregs at baseline in NZW mice, but it was in B6 mice that IL-33R+ Tregs expanded most robustly in response to IL-33 (Fig. 4B).
Fig. 4.
NZW Treg cells are less sensitive to limiting amount of IL-2 in vivo. (A) Percentage of splenic Foxp3+ Tregs at day 5 of treatment in vivo with mIL-15/mIL-15Rα or mIL-7/anti–IL-7 mAb complexes, or recombinant IL-33, at days 0 and 3. (B) IL-33R expression in splenic CD4+ T cells at steady state (Left) and after IL-33 administration per A (Right). (C, Left) Treg frequency at day 5 after daily administration of IL-2/anti–IL-2 complexes in vivo. (C, Right) Same data, but shown as a difference from baseline. (D) Evolution of phospho-STAT5 mean fluorescence intensity after in vitro stimulation of splenic Tregs with graded doses of IL-2.
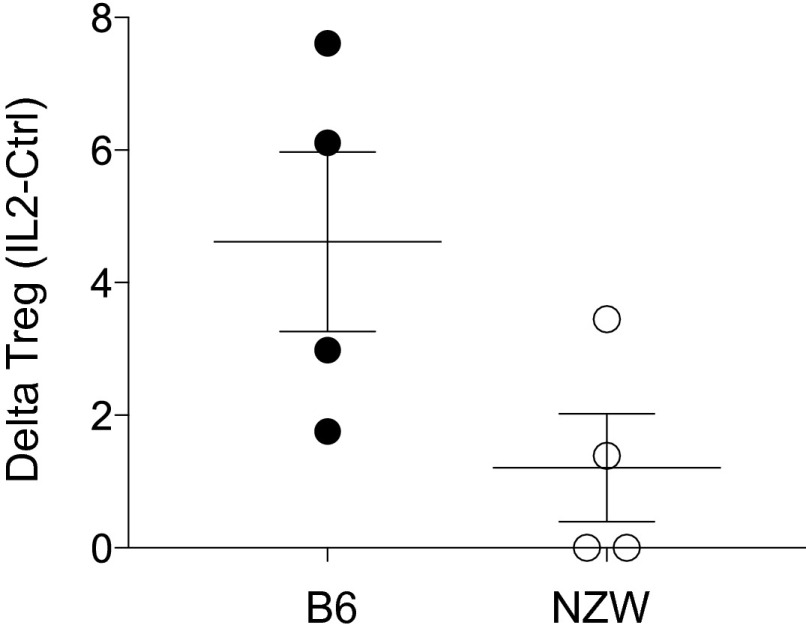
Because IL-2 is the major driver of differentiation and homeostasis of Treg cells, we searched for related perturbations in NZW mice. Injections of low amounts of IL-2 complex (0.125 and 0.25 μg) had less effect on NZW Treg cells relative to B6 (P < 0.001), but at high doses the response was similar in both strains (Fig. 4C). Injection of low doses of IL-2 into NZW + B6 mixed BM chimeras constructed as above also showed this difference, demonstrating that deficiency in responsiveness to IL-2 was Treg-intrinsic and ruling out the alternative explanation of differential consumption of IL-2 in NZW and B6 mice (Fig. S3).
Fig. S3.
NZW Treg cells are intrinsically less sensitive to limiting amount of IL-2 in vivo. Treg frequency at day 5 of daily administration of IL-2/anti–IL-2 complexes in vivo into (NZW+B6 → NZWxB6.F1) mixed BM chimeras, calculated as the difference from the mean of 4 untreated controls.
Given this lower sensitivity to IL-2, we investigated IL-2 signaling in NZW Tregs. The high-affinity IL-2 receptor (CD25) was expressed at similar levels at the Treg cell surface in B6 and NZW mice (Fig. 1A). Challenging primary Treg cells in vitro with a range of IL-2 concentrations induced robust and comparable STAT5 phosphorylation in both strains if anything, faster in NZW, demonstrating that the early IL-2 signaling pathway was fully functional in NZW Tregs (Fig. 4D).
Peculiarities of the NZW Treg Transcriptome.
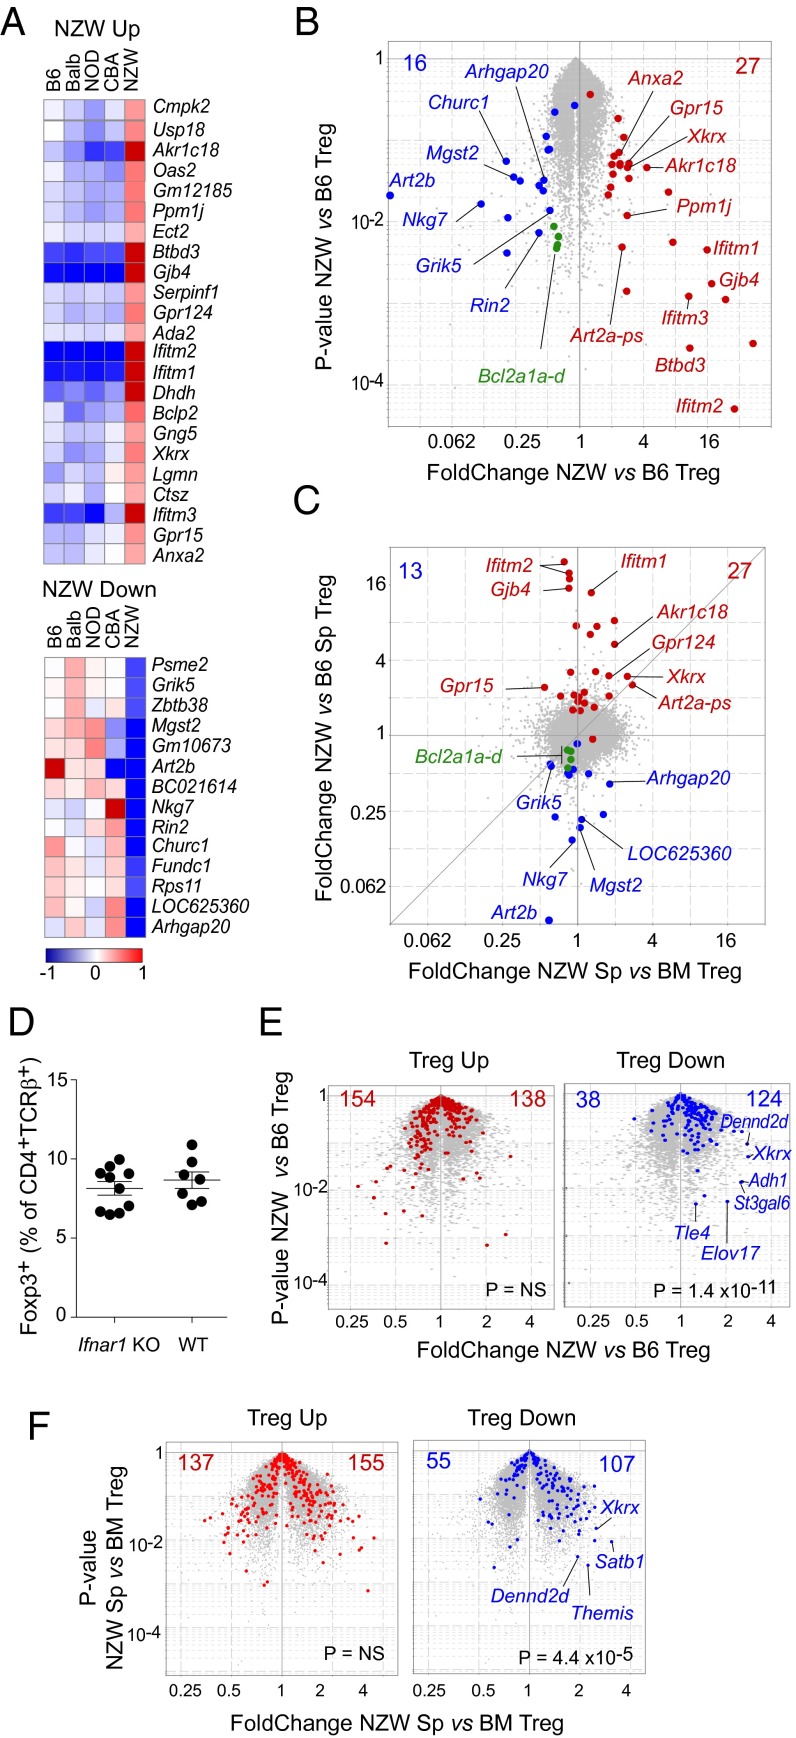
Because intrinsic factors accounted for the dearth of NZW Tregs, they might be reflected in these cells’ transcriptome. Gene-expression profiles of splenic Tregs from the five inbred strains were generated. From these data, we fitted a linear model to determine the transcripts whose expression in Tregs uniformly distinguished NZW from the four other inbred strains. This process identified 39 genes [24 overexpressed and 15 underexpressed by twofold in NZW, at a false discovery rate (FDR) of <0.01; Fig. 5 A and B; listed in Table S1]. This gene set did not contain transcripts that immediately suggested explanations for the NZW Treg deficit, although we did note a slight underexpression of some members of the Bcl2 family (Bcl2a1a/b/c/d, 0.59–0.66 fold change). The Art2b transcript was also strongly depressed in NZW Tregs, as discussed below.
Fig. 5.
Transcriptional particularities of NZW Treg cells. Splenic CD4+TCRβ+CD25hi Tregs from the inbred strains were sorted for gene-expression profiling. (A) Transcripts were identified by linear regression as uniquely misexpressed in NZW Tregs (fold change > 2, FDR <0.05), log2 of normalized expression values shown here. (B) Volcano plot comparing NZW vs. B6 Tregs; red and blue dots denoted NZW-up and -down transcripts. (C) Fold change/fold change plot comparing NZW Tregs from spleen vs. BM. (D) Proportions of Foxp3+ Tregs in spleen of F2 mice from an intercross between NZW and B6 mice carrying an Ifnar1 deficiency. (E) Same volcano plot as in A, but highlighting transcripts of the canonical Treg signature: Treg-up and -down signatures (red and blue, respectively). (F) Volcano plot comparing NZW Tregs from spleen vs. BM with same highlighting as in E.
Table S1.
Genes expressed differentially in NZW Tregs vs. other strains
| ProbeSetID | Gene symbol | Fold change, NZ vs. mean | -log10 (P value) | FDR | IFNsig gene | MeanExpTreg.B6 | MeanExpTreg.Ba | MeanExpTreg.CB | MeanExpTreg.NO | MeanExpTreg.NZ |
| 10569014 | Ifitm2 | 38.1 | 9.078 | 0.001 | 1 | 75 | 88 | 99 | 82 | 3,218 |
| 10383756 | Ifitm2 | 25.0 | 8.935 | 0.001 | 1 | 232 | 287 | 296 | 268 | 6,671 |
| 10553299 | Ifitm2 | 21.7 | 9.089 | 0.001 | 1 | 186 | 207 | 224 | 202 | 4,385 |
| 10516487 | Gjb4 | 20.0 | 7.402 | 0.001 | 0 | 41 | 30 | 37 | 37 | 721 |
| 10558769 | Ifitm1 | 15.9 | 7.735 | 0.001 | 1 | 40 | 42 | 43 | 39 | 645 |
| 10385504 | Gm5431 | 11.3 | 4.791 | 0.001 | 1 | 23 | 22 | 14 | 13 | 210 |
| 10476538 | Btbd3 | 11.1 | 8.08 | 0.001 | 0 | 26 | 23 | 28 | 28 | 288 |
| 10569017 | Ifitm3 | 9.9 | 4.343 | 0.001 | 1 | 142 | 146 | 288 | 103 | 1,518 |
| 10563314 | Dhdh | 6.8 | 5.916 | 0.001 | 0 | 50 | 60 | 67 | 49 | 375 |
| 10407435 | Akr1c18 | 6.2 | 3.172 | 0.001 | 0 | 35 | 24 | 15 | 14 | 142 |
| 10565990 | Art2a-ps | 4.1 | 2.404 | 0.01 | 0 | 45 | 26 | 13 | 17 | 112 |
| 10495042 | Ppm1j | 3.3 | 4.652 | 0.001 | 0 | 97 | 80 | 75 | 66 | 268 |
| 10399710 | Rsad2 | 3.3 | 2.427 | 0.01 | 1 | 57 | 31 | 26 | 32 | 124 |
| 10606654 | Xkrx | 3.2 | 3.493 | 0.001 | 0 | 64 | 42 | 70 | 49 | 176 |
| 10385507 | Gm12185 | 3.2 | 4.63 | 0.001 | 1 | 76 | 66 | 58 | 56 | 209 |
| 10533198 | Oas2 | 3.2 | 3.236 | 0.001 | 1 | 55 | 37 | 30 | 37 | 133 |
| 10571142 | Gpr124 | 3.2 | 4.791 | 0.001 | 0 | 42 | 35 | 35 | 38 | 119 |
| 10440131 | Gpr15 | 2.6 | 2.8 | 0.01 | 0 | 57 | 56 | 77 | 70 | 163 |
| 10388430 | Serpinf1 | 2.5 | 4.551 | 0.001 | 0 | 48 | 44 | 44 | 47 | 116 |
| 10395039 | Cmpk2 | 2.4 | 2.535 | 0.01 | 1 | 91 | 75 | 83 | 55 | 180 |
| 10434672 | Gng5 | 2.3 | 3.846 | 0.001 | 0 | 532 | 431 | 547 | 435 | 1,085 |
| 10586744 | Anxa2 | 2.2 | 2.668 | 0.01 | 0 | 140 | 137 | 197 | 175 | 338 |
| 10558754 | Athl1 | 2.1 | 2.334 | 0.01 | 0 | 217 | 271 | 304 | 238 | 532 |
| 10361799 | Adat2 | 2.0 | 4.974 | 0.001 | 0 | 125 | 120 | 124 | 111 | 244 |
| 10490212 | Ctsz | 2.0 | 2.575 | 0.01 | 0 | 366 | 415 | 462 | 292 | 755 |
| 10497520 | Ect2 | 2.0 | 4.87 | 0.001 | 0 | 60 | 54 | 53 | 52 | 110 |
| 10563094 | Rps11 | 0.5 | 4.269 | 0.001 | 0 | 3,675 | 3,311 | 3,457 | 3,111 | 1,677 |
| 10560945 | Grik5 | 0.5 | 3.942 | 0.001 | 0 | 163 | 204 | 161 | 166 | 85 |
| 10595803 | Rnf7 | 0.5 | 3.248 | 0.01 | 0 | 172 | 158 | 210 | 193 | 86 |
| 10385511 | Psme2 | 0.5 | 2.985 | 0.01 | 1 | 775 | 1002 | 758 | 795 | 401 |
| 10592001 | St14 | 0.5 | 2.455 | 0.01 | 0 | 84 | 67 | 101 | 96 | 40 |
| 10603785 | Fundc1 | 0.5 | 2.981 | 0.01 | 0 | 601 | 535 | 571 | 449 | 247 |
| 10476759 | Rin2 | 0.4 | 3.67 | 0.001 | 0 | 92 | 82 | 132 | 108 | 38 |
| 10585286 | Arhgap20 | 0.4 | 2.999 | 0.01 | 0 | 311 | 421 | 516 | 320 | 144 |
| 10414738 | LOC547323 | 0.4 | 2.124 | 0.01 | 0 | 491 | 885 | 953 | 767 | 276 |
| 10501046 | Gm10673 | 0.3 | 3.41 | 0.01 | 0 | 325 | 342 | 226 | 461 | 91 |
| 10396694 | Churc1 | 0.3 | 3.05 | 0.01 | 0 | 853 | 537 | 718 | 491 | 164 |
| 10598152 | LOC625360 | 0.2 | 4.043 | 0.001 | 1 | 157 | 126 | 187 | 106 | 33 |
| 10491952 | Mgst2 | 0.2 | 3.345 | 0.01 | 0 | 178 | 195 | 100 | 219 | 41 |
| 10464594 | BC021614 | 0.2 | 7.188 | 0.001 | 0 | 307 | 290 | 311 | 343 | 63 |
| 10552406 | Nkg7 | 0.1 | 4.205 | 0.001 | 0 | 442 | 406 | 958 | 470 | 52 |
| 10565994 | Art2b | 0.0 | 3.393 | 0.001 | 0 | 883 | 387 | 97 | 407 | 11 |
To refine the candidate selection, we profiled BM Tregs from NZW and B6 mice, given that the NZW Treg deficit was absent in the BM, suggesting that the BM microenvironment somehow corrected a defect observed in the spleen. As illustrated in Fig. 5C, most of the transcripts that distinguished NZW from other strains were not differential between NZW splenic and BM Tregs, with the exception of Xkrx, Gpr124, the Art2a-ps pseudogene, and Grik5. Unfortunately, the known function or ontology of these genes failed to identify a possible connection with Treg viability or homeostasis.
Many of the transcripts overexpressed in NZW Tregs were classic IFN-Responsive Genes (e.g., Ifitm1/2/3, Rsad2, Oas2, etc.). This finding was not surprising given the dysregulation of IFN in human systemic lupus erythematosus (SLE) (41, 42) and in NZW/B lupus model mice (ref. 43 and references therein). Because recent studies have reported Treg modulation by IFN (reviewed in ref. 44), we hypothesized that overexposure to IFN might account, at least in part, for the NZW Treg phenotype. This possibility was tested by breeding F2 mice from an intercross between NZW and B6 mice carrying a knockout mutation of the key IFN receptor gene, Ifnar1. There was no difference between Ifnar1-proficient and deficient mice (Fig. 5D), arguing against a major role for IFN in limiting Treg proportions in NZW mice.
Finally, we highlighted the transcripts of the canonical Treg signature over the comparison of NZW vs. B6 splenic Tregs (Fig. 5E). Although the Treg-up signature was comparably expressed, the Treg-down signature proved to be significantly biased as a whole (124 vs. 38 transcripts, Chisq P = 1.4 × 10⁻¹¹). These shifts were mostly minor (with most fold changes between 1.3 and 1.5), suggesting that the overexpression of the Treg-down signature as a whole, rather than any specific gene, might account for unstable Treg cells in NZW mice. Indeed, comparing Tregs from NZW spleen and BM (where the defect is not observed) again brought out the overexpression of the Treg-down transcripts, further supporting the connection between misexpression of normally repressed genes and Treg stability.
Discussion
Investigating the origins of variation in Treg frequencies between inbred strains, and the particularly low representation in NZW mice, led to several observations that may be of importance in understanding the similar degree of variation found in humans. First, this low proportion appeared to be mainly intrinsic to Treg cells, reflecting differential stability of the Treg pool and of FoxP3 expression. Second, this instability did not reflect epigenetic instability of FoxP3 expression, but, rather, lower sensitivity to a limiting supply of IL-2 and a general perturbation affecting, at the network level, the core “Treg gene signature” of genes normally repressed in Treg cells.
In NZW mice, the combination of normal thymic Treg frequencies, low proportion in peripheral lymphoid organs, high proliferative rates, and unusually shorter half-lives indicated that these cells are unstable in vivo. Unexpectedly, although low Treg proportions were observed in the main peripheral lymphoid organs and in the colon [which includes Treg populations thought to be both of thymic and peripheral origin (45)], we observed in the NZW BM the high proportion of Treg usually found there, suggesting that different homeostatic mechanisms govern this specialized subset of nonlymphoid tissue Tregs and/or that the BM milieu might contain factors able to correct the Treg intrinsic defect of NZW mice. The dearth of NZW Tregs in NZW spleen and LNs was detectable as early as 5 d after birth, arguing against its being a secondary consequence of inflammatory deviation and autoantibodies in the NZW mouse (also supported by the mixed BM chimera results). Instead, one might speculate that an inherent defect in seeding the proper homeostatic niches might be involved. This Treg instability could result from several mechanisms, including unstable expression of Foxp3, which is required to preserve Treg lineage identity. Indeed, we observed heightened Foxp3 instability in NZW Tregs in conditions of limiting IL-2. Importantly, hypomethylation of the Foxp3 locus, and in particular its CNS2 region, was not involved, as might have been envisaged (46, 47). The methylation pattern at Foxp3 proved remarkably similar between strains. Overall, the NZW defect seemed to affect both Treg cells and FoxP3.
Interestingly, NZW Tregs proved less responsive than reference B6 Tregs to IL-2 at limiting doses. This decreased sensitivity was manifest in two different ways: as lower maintenance of Foxp3 expression in cultures in vitro and as a lesser growth effect of IL-2 in vivo. In both, NZW Tregs caught up with B6 Tregs at higher IL-2 doses. Results from mixed BM chimeras argued that defective IL-2 production by NZW Tconv cells could not be responsible for this defect. The initial nodes of the response to IL-2 also seemed normal in NZW Tregs: comparable CD25 at the cell surface, no suggestive coding-region polymorphism in the NZW Il2ra locus, and comparable induction of STAT5 phosphorylation, ruling out defects in IL-2 sensing and/or immediate downstream signaling events. Thus, the defective response to low-dose IL-2 must occur at downstream steps of the signaling pathway and/or along STAT5-independent pathways triggered by IL-2, such as the Akt/mTOR pathway, known to have a negative impact on Treg cells (48). A poor integrative response of IL-2–delivered signals in NZW Tregs may be connected to their less effective response to IL-33, despite higher expression of IL-33R.
Overall, the comparative analysis of gene-expression profiles from Treg cells across strains allowed the identification of two subsets of genes specifically overexpressed or underexpressed in NZW mice, wherein we sought to identify putatively causal genes—for instance, those related to cell survival and apoptosis. We found no difference in Mcl1, which encodes an antiapoptotic molecule shown to promote Treg survival (49), or any difference in transcripts from the Sle1a lupus susceptibility region, which the Morel group have found to regulate Treg proportions (50), albeit by an indirect mechanism involving Tconv and dendritic cells, hence different from the intrinsic defect tracked here. The defective expression of Art2b in NZW Tregs is consistent with previous reports of Art2b inactivity in NZW (51) and is also shared by Tconv cells (www.immgen.org). This difference was intriguing because Art2b partakes in NAD-induced cell death, to which Treg cells are particularly sensitive (52), but seems unlikely to explain the NZW Treg defect because it goes in the wrong direction: if anything, low Art2b would be expected to protect and stabilize Treg cells [Adriouch et al. showed that NZW T cells are resistant to NAD-induced apoptosis (51)]. We also observed no marked misexpression of proapoptotic or antiapoptotic molecules in NZW Tregs, with perhaps the slight exception of Bcl2a1 family members (reduced to 0.6–0.7 of B6 levels). Finally, the presence of IFN-responsive genes among the NZW-up signature turned out to be a red herring, as revealed by intercrossing the Ifnar1 deficiency.
Instead, we noted that NZW Tregs showed an asymmetric alteration of their Treg signature. Treg-down genes were less repressed in NZW than in B6 Tregs, whereas transcripts of the Treg-up signature appeared normal. We thus speculate that a global network effect, disturbing much of the Treg-down signature rather than any one transcript, might account for unstable NZW Treg cells. The causal relationship between this global effect and the low sensitivity to IL-2 could go either way: Tonic IL-2 signals received by Tregs at baseline might be needed to repress the Treg-down signature; alternatively, the low Treg-down gene set may comprise negative feedback elements that dampen IL-2 signals (an element that could further help IL-2 be predominantly sensed by Treg over Tconv cells), and their incomplete suppression in NZW Tregs accounts for less sensitive IL-2 sensing. These possible connections will need to be explored to assess whether these mechanisms and candidates can account for the low Treg frequencies in some humans and how much they partake in the unfolding of autoimmune disease.
Materials and Methods
Mice and Treatments.
Mice were maintained as specific pathogen-free at Harvard Medical School (Institutional Animal Care and Use Committee Protocol 02954) or were purchased from The Jackson Laboratory. For BM chimeras, recipient mice were lethally irradiated (10 Gy) 6 h before i.v. transplantation of 5 × 10⁶ T-cell–depleted BM cells. Cytokine complexes were formed by mixing the following: recombinant mouse IL-7 (Peprotech) with anti-IL-7 M25 mAb (BioXCell); recombinant mouse IL-15 (Peprotech) with recombinant mouse IL-15RαFc (R&D); recombinant mouse IL-2 (Peprotech) with anti-mouse IL-2 JES6-1A12 mAb (BioLegend) (all mixed 20 min at 4 °C before i.p. injection). Recombinant murine IL-33 (BioLegend) was injected directly. BrdU was either injected i.p. twice at 3-h intervals or supplied in drinking water (21).
Flow Cytometry.
Cells were isolated from lymphoid organs by mechanical disruption and from colon LP by collagenase/dispase digestion. For phospho-STAT5, cells were fixed [2% (wt/vol) paraformaldehyde, 20 min at room temperature], permeabilized overnight in 90% (vol/vol) methanol, and stained with anti-pStat5 (Tyr-694) (eBiosciences). To evaluate ex vivo FoxP3 stability, flow-sorted Tregs were cultured with anti-CD3/CD28 antibody-coated beads (Life Technologies) and graded amounts of IL-2 for 48 h before FoxP3 quantitation.
Microarray Profiling and Analysis.
Treg cells (50,000) were double-sorted and RNA-prepared, and gene profiling was performed on Affymetrix MoGene 1.0 ST microarrays per ImmGen SOP (www.immgen.org), in biological duplicates. Data were analyzed with the Multiplot Studio module from GenePattern. Treg-up and -down signatures have been described (53). Datasets deposited in the GEO repository, accession no. GSE76265.
Methylation Analysis.
Genomic DNA from sorted Treg and Tconv cells was purified and bisulfite-treated (EZ DNA Methylation-Direct Kit; ZYMO) and amplified as described (38). PCR products were pooled, ligated to Illumina sequencing adaptors, multiplexed, and sequenced (Illumina MiSeq) to ∼250 Kreads per sample.
Statistical Significance.
Statistical significance was mostly determined by Student t test (two-tailed, unpaired; *P < 0.05; **P < 0.01; ***P < 0.001).
Acknowledgments
We thank Drs. S. Adriouch, E. Sefik, and D. Zemmour for useful discussion or help with Treg and methylation analysis; and K. Hattori, G. Buruzala, and A. Rhoads for help with mice, flow cytometry, and microarrays. This work was supported by NIH Grant AI051530. F.D. was supported by a grant from the American Diabetes Association (7-11-MN-04).
Footnotes
The authors declare no conflict of interest.
Data deposition: The data reported in this paper have been deposited in the Gene Expression Omnibus (GEO) database, www.ncbi.nlm.nih.gov/geo (accession no. GSE76265).
This article contains supporting information online at www.pnas.org/lookup/suppl/doi:10.1073/pnas.1524660113/-/DCSupplemental.
References
- 1.Sakaguchi S. Naturally arising CD4+ regulatory t cells for immunologic self-tolerance and negative control of immune responses. Annu Rev Immunol. 2004;22:531–562. doi: 10.1146/annurev.immunol.21.120601.141122. [DOI] [PubMed] [Google Scholar]
- 2.Josefowicz SZ, Lu LF, Rudensky AY. Regulatory T cells: Mechanisms of differentiation and function. Annu Rev Immunol. 2012;30:531–564. doi: 10.1146/annurev.immunol.25.022106.141623. [DOI] [PMC free article] [PubMed] [Google Scholar]
- 3.Panduro M, Benoist C, Mathis D. TISSUE-Tregs. Annu Rev Immunol. 2016 doi: 10.1146/annurev-immunol-032712-095948. in press. [DOI] [PMC free article] [PubMed] [Google Scholar]
- 4.Ramsdell F, Ziegler SF. FOXP3 and scurfy: How it all began. Nat Rev Immunol. 2014;14(5):343–349. doi: 10.1038/nri3650. [DOI] [PubMed] [Google Scholar]
- 5.Vignali DA, Collison LW, Workman CJ. How regulatory T cells work. Nat Rev Immunol. 2008;8(7):523–532. doi: 10.1038/nri2343. [DOI] [PMC free article] [PubMed] [Google Scholar]
- 6.Shevach EM. Mechanisms of foxp3+ T regulatory cell-mediated suppression. Immunity. 2009;30(5):636–645. doi: 10.1016/j.immuni.2009.04.010. [DOI] [PubMed] [Google Scholar]
- 7.Feuerer M, Hill JA, Mathis D, Benoist C. Foxp3+ regulatory T cells: Differentiation, specification, subphenotypes. Nat Immunol. 2009;10(7):689–695. doi: 10.1038/ni.1760. [DOI] [PubMed] [Google Scholar]
- 8.Fontenot JD, et al. Regulatory T cell lineage specification by the forkhead transcription factor foxp3. Immunity. 2005;22(3):329–341. doi: 10.1016/j.immuni.2005.01.016. [DOI] [PubMed] [Google Scholar]
- 9.Hill JA, et al. Foxp3 transcription-factor-dependent and -independent regulation of the regulatory T cell transcriptional signature. Immunity. 2007;27(5):786–800. doi: 10.1016/j.immuni.2007.09.010. [DOI] [PubMed] [Google Scholar]
- 10.Samstein RM, et al. Foxp3 exploits a pre-existent enhancer landscape for regulatory T cell lineage specification. Cell. 2012;151(1):153–166. doi: 10.1016/j.cell.2012.06.053. [DOI] [PMC free article] [PubMed] [Google Scholar]
- 11.Smigiel KS, Srivastava S, Stolley JM, Campbell DJ. Regulatory T-cell homeostasis: Steady-state maintenance and modulation during inflammation. Immunol Rev. 2014;259(1):40–59. doi: 10.1111/imr.12170. [DOI] [PMC free article] [PubMed] [Google Scholar]
- 12.Li X, Zheng Y. Regulatory T cell identity: Formation and maintenance. Trends Immunol. 2015;36(6):344–353. doi: 10.1016/j.it.2015.04.006. [DOI] [PMC free article] [PubMed] [Google Scholar]
- 13.Kim JM, Rasmussen JP, Rudensky AY. Regulatory T cells prevent catastrophic autoimmunity throughout the lifespan of mice. Nat Immunol. 2007;8(2):191–197. doi: 10.1038/ni1428. [DOI] [PubMed] [Google Scholar]
- 14.Feuerer M, Shen Y, Littman DR, Benoist C, Mathis D. How punctual ablation of regulatory T cells unleashes an autoimmune lesion within the pancreatic islets. Immunity. 2009;31(4):654–664. doi: 10.1016/j.immuni.2009.08.023. [DOI] [PMC free article] [PubMed] [Google Scholar]
- 15.Fontenot JD, Rasmussen JP, Gavin MA, Rudensky AY. A function for interleukin 2 in Foxp3-expressing regulatory T cells. Nat Immunol. 2005;6(11):1142–1151. doi: 10.1038/ni1263. [DOI] [PubMed] [Google Scholar]
- 16.Barron L, et al. Cutting edge: Mechanisms of IL-2-dependent maintenance of functional regulatory T cells. J Immunol. 2010;185(11):6426–6430. doi: 10.4049/jimmunol.0903940. [DOI] [PMC free article] [PubMed] [Google Scholar]
- 17.Kim GY, et al. An in vivo IL-7 requirement for peripheral Foxp3+ regulatory T cell homeostasis. J Immunol. 2012;188(12):5859–5866. doi: 10.4049/jimmunol.1102328. [DOI] [PMC free article] [PubMed] [Google Scholar]
- 18.Mazzucchelli R, et al. Development of regulatory T cells requires IL-7Ralpha stimulation by IL-7 or TSLP. Blood. 2008;112(8):3283–3292. doi: 10.1182/blood-2008-02-137414. [DOI] [PMC free article] [PubMed] [Google Scholar]
- 19.Bayer AL, Lee JY, de la Barrera A, Surh CD, Malek TR. A function for IL-7R for CD4+CD25+Foxp3+ T regulatory cells. J Immunol. 2008;181(1):225–234. doi: 10.4049/jimmunol.181.1.225. [DOI] [PMC free article] [PubMed] [Google Scholar]
- 20.Raynor J, et al. IL-15 fosters age-driven regulatory T cell accrual in the face of declining IL-2 levels. Front Immunol. 2013;4:161. doi: 10.3389/fimmu.2013.00161. [DOI] [PMC free article] [PubMed] [Google Scholar]
- 21.Kolodin D, et al. Antigen- and cytokine-driven accumulation of regulatory T cells in visceral adipose tissue of lean mice. Cell Metab. 2015;21(4):543–557. doi: 10.1016/j.cmet.2015.03.005. [DOI] [PMC free article] [PubMed] [Google Scholar]
- 22.Vasanthakumar A, et al. The transcriptional regulators IRF4, BATF and IL-33 orchestrate development and maintenance of adipose tissue-resident regulatory T cells. Nat Immunol. 2015;16(3):276–285. doi: 10.1038/ni.3085. [DOI] [PubMed] [Google Scholar]
- 23.Schiering C, et al. The alarmin IL-33 promotes regulatory T-cell function in the intestine. Nature. 2014;513(7519):564–568. doi: 10.1038/nature13577. [DOI] [PMC free article] [PubMed] [Google Scholar]
- 24.Brusko TM, Wasserfall CH, Clare-Salzler MJ, Schatz DA, Atkinson MA. Functional defects and the influence of age on the frequency of CD4+ CD25+ T-cells in type 1 diabetes. Diabetes. 2005;54(5):1407–1414. doi: 10.2337/diabetes.54.5.1407. [DOI] [PubMed] [Google Scholar]
- 25.Ferraro A, et al. Interindividual variation in human T regulatory cells. Proc Natl Acad Sci USA. 2014;111(12):E1111–E1120. doi: 10.1073/pnas.1401343111. [DOI] [PMC free article] [PubMed] [Google Scholar]
- 26.Orrù V, et al. Genetic variants regulating immune cell levels in health and disease. Cell. 2013;155(1):242–256. doi: 10.1016/j.cell.2013.08.041. [DOI] [PMC free article] [PubMed] [Google Scholar]
- 27.Feuerer M, et al. Enhanced thymic selection of FoxP3+ regulatory T cells in the NOD mouse model of autoimmune diabetes. Proc Natl Acad Sci USA. 2007;104(46):18181–18186. doi: 10.1073/pnas.0708899104. [DOI] [PMC free article] [PubMed] [Google Scholar]
- 28.Romagnoli P, Tellier J, van Meerwijk JP. Genetic control of thymic development of CD4+CD25+FoxP3+ regulatory T lymphocytes. Eur J Immunol. 2005;35(12):3525–3532. doi: 10.1002/eji.200535225. [DOI] [PMC free article] [PubMed] [Google Scholar]
- 29.Sawant DV, Vignali DA. Once a Treg, always a Treg? Immunol Rev. 2014;259(1):173–191. doi: 10.1111/imr.12173. [DOI] [PMC free article] [PubMed] [Google Scholar]
- 30.Fu W, et al. A multiply redundant genetic switch ‘locks in’ the transcriptional signature of regulatory T cells. Nat Immunol. 2012;13(10):972–980. doi: 10.1038/ni.2420. [DOI] [PMC free article] [PubMed] [Google Scholar]
- 31.Lu LF, et al. A Single miRNA-mRNA Interaction Affects the Immune Response in a Context- and Cell-Type-Specific Manner. Immunity. 2015;43(1):52–64. doi: 10.1016/j.immuni.2015.04.022. [DOI] [PMC free article] [PubMed] [Google Scholar]
- 32.Lathrop SK, et al. Peripheral education of the immune system by colonic commensal microbiota. Nature. 2011;478(7368):250–254. doi: 10.1038/nature10434. [DOI] [PMC free article] [PubMed] [Google Scholar]
- 33.Atarashi K, et al. Induction of colonic regulatory T cells by indigenous Clostridium species. Science. 2011;331(6015):337–341. doi: 10.1126/science.1198469. [DOI] [PMC free article] [PubMed] [Google Scholar]
- 34.Ohnmacht C, et al. The microbiota regulates type 2 immunity through RORγ+ T cells. Science. 2015;349(6251):989–993. doi: 10.1126/science.aac4263. [DOI] [PubMed] [Google Scholar]
- 35.Sefik E, et al. MUCOSAL IMMUNOLOGY. Individual intestinal symbionts induce a distinct population of RORγ⁺ regulatory T cells. Science. 2015;349(6251):993–997. doi: 10.1126/science.aaa9420. [DOI] [PMC free article] [PubMed] [Google Scholar]
- 36.Williams LM, Rudensky AY. Maintenance of the Foxp3-dependent developmental program in mature regulatory T cells requires continued expression of Foxp3. Nat Immunol. 2007;8(3):277–284. doi: 10.1038/ni1437. [DOI] [PubMed] [Google Scholar]
- 37.Rubtsov YP, et al. Stability of the regulatory T cell lineage in vivo. Science. 2010;329(5999):1667–1671. doi: 10.1126/science.1191996. [DOI] [PMC free article] [PubMed] [Google Scholar]
- 38.Feng Y, et al. Control of the inheritance of regulatory T cell identity by a cis element in the Foxp3 locus. Cell. 2014;158(4):749–763. doi: 10.1016/j.cell.2014.07.031. [DOI] [PMC free article] [PubMed] [Google Scholar]
- 39.Li X, Liang Y, LeBlanc M, Benner C, Zheng Y. Function of a Foxp3 cis-element in protecting regulatory T cell identity. Cell. 2014;158(4):734–748. doi: 10.1016/j.cell.2014.07.030. [DOI] [PMC free article] [PubMed] [Google Scholar]
- 40.Kuswanto W, et al. Poor repair of skeletal muscle in aging mice reflects a defect in local, interleukin-33-dependent, accumulation of regulatory T cells. Immunity. 2016 doi: 10.1016/j.immuni.2016.01.009. in press. [DOI] [PMC free article] [PubMed] [Google Scholar]
- 41.Baechler EC, et al. Interferon-inducible gene expression signature in peripheral blood cells of patients with severe lupus. Proc Natl Acad Sci USA. 2003;100(5):2610–2615. doi: 10.1073/pnas.0337679100. [DOI] [PMC free article] [PubMed] [Google Scholar]
- 42.Bennett L, et al. Interferon and granulopoiesis signatures in systemic lupus erythematosus blood. J Exp Med. 2003;197(6):711–723. doi: 10.1084/jem.20021553. [DOI] [PMC free article] [PubMed] [Google Scholar]
- 43.Zhan Y, et al. Bcl-2 antagonists kill plasmacytoid dendritic cells from lupus-prone mice and dampen interferon-α production. Arthritis Rheumatol. 2015;67(3):797–808. doi: 10.1002/art.38966. [DOI] [PubMed] [Google Scholar]
- 44.Piconese S, Pacella I, Timperi E, Barnaba V. Divergent effects of type-I interferons on regulatory T cells. Cytokine Growth Factor Rev. 2015;26(2):133–141. doi: 10.1016/j.cytogfr.2014.10.012. [DOI] [PubMed] [Google Scholar]
- 45.Ai TL, Solomon BD, Hsieh CS. T-cell selection and intestinal homeostasis. Immunol Rev. 2014;259(1):60–74. doi: 10.1111/imr.12171. [DOI] [PMC free article] [PubMed] [Google Scholar]
- 46.Floess S, et al. Epigenetic control of the foxp3 locus in regulatory T cells. PLoS Biol. 2007;5(2):e38. doi: 10.1371/journal.pbio.0050038. [DOI] [PMC free article] [PubMed] [Google Scholar]
- 47.Yamada T, et al. iPath2.0: Interactive pathway explorer. Nucleic Acids Res. 2011;39(Web Server issue):W412–W415. doi: 10.1093/nar/gkr313. [DOI] [PMC free article] [PubMed] [Google Scholar]
- 48.Pollizzi KN, Powell JD. Regulation of T cells by mTOR: The known knowns and the known unknowns. Trends Immunol. 2015;36(1):13–20. doi: 10.1016/j.it.2014.11.005. [DOI] [PMC free article] [PubMed] [Google Scholar]
- 49.Pierson W, et al. Antiapoptotic Mcl-1 is critical for the survival and niche-filling capacity of Foxp3⁺ regulatory T cells. Nat Immunol. 2013;14(9):959–965. doi: 10.1038/ni.2649. [DOI] [PMC free article] [PubMed] [Google Scholar]
- 50.Cuda CM, Wan S, Sobel ES, Croker BP, Morel L. Murine lupus susceptibility locus Sle1a controls regulatory T cell number and function through multiple mechanisms. J Immunol. 2007;179(11):7439–7447. doi: 10.4049/jimmunol.179.11.7439. [DOI] [PubMed] [Google Scholar]
- 51.Adriouch S, Ohlrogge W, Haag F, Koch-Nolte F, Seman M. Rapid induction of naive T cell apoptosis by ecto-nicotinamide adenine dinucleotide: Requirement for mono(ADP-ribosyl)transferase 2 and a downstream effector. J Immunol. 2001;167(1):196–203. doi: 10.4049/jimmunol.167.1.196. [DOI] [PubMed] [Google Scholar]
- 52.Hubert S, et al. Extracellular NAD+ shapes the Foxp3+ regulatory T cell compartment through the ART2-P2X7 pathway. J Exp Med. 2010;207(12):2561–2568. doi: 10.1084/jem.20091154. [DOI] [PMC free article] [PubMed] [Google Scholar]
- 53.Feuerer M, et al. Genomic definition of multiple ex vivo regulatory T cell subphenotypes. Proc Natl Acad Sci USA. 2010;107(13):5919–5924. doi: 10.1073/pnas.1002006107. [DOI] [PMC free article] [PubMed] [Google Scholar]
- 54.Krueger F, Andrews SR. Bismark: A flexible aligner and methylation caller for Bisulfite-Seq applications. Bioinformatics. 2011;27(11):1571–1572. doi: 10.1093/bioinformatics/btr167. [DOI] [PMC free article] [PubMed] [Google Scholar]


