Significance
4-methylumbelliferone (4-MU) is an oral drug that inhibits synthesis of hyaluronan, an extracellular matrix polymer implicated in autoimmunity. In the experimental autoimmune encephalomyelitis (EAE) model of multiple sclerosis (MS), 4-MU drives the polarization of T cells away from a Th1 phenotype, associated with disease progression, and toward a FoxP3+ regulatory T-cell phenotype, associated with disease prevention. Moreover, 4-MU inhibits the reactive response of astrocytes, immunocompetent resident cells of the CNS, and prevents trafficking of activated T cells to the CNS. These data suggest that the extracellular matrix, and hyaluronan in particular, may be an active contributor to autoimmune pathogenesis in EAE and, furthermore, that 4-MU is a promising strategy for treatment of CNS autoimmunity.
Keywords: hyaluronan, multiple sclerosis, T-cell polarization, T-cell trafficking, astrogliosis
Abstract
The extracellular matrix polysaccharide hyaluronan (HA) accumulates at sites of autoimmune inflammation, including white matter lesions in multiple sclerosis (MS), but its functional importance in pathogenesis is unclear. We have evaluated the impact of 4-methylumbelliferone (4-MU), an oral inhibitor of HA synthesis, on disease progression in the experimental autoimmune encephalomyelitis (EAE) mouse model of MS. Treatment with 4-MU decreases the incidence of EAE, delays its onset, and reduces the severity of established disease. 4-MU inhibits the activation of autoreactive T cells and prevents their polarization toward a Th1 phenotype. Instead, 4-MU promotes polarization toward a Th2 phenotpye and induction of Foxp3+ regulatory T cells. Further, 4-MU hastens trafficking of T cells through secondary lymphoid organs, impairs the infiltration of T cells into the CNS parenchyma, and limits astrogliosis. Together, these data suggest that HA synthesis is necessary for disease progression in EAE and that treatment with 4-MU may be a potential therapeutic strategy in CNS autoimmunity. Considering that 4-MU is already a therapeutic, called hymecromone, that is approved to treat biliary spasm in humans, we propose that it could be repurposed to treat MS.
Multiple sclerosis (MS) is an autoimmune disease of the central nervous system (CNS). In MS and its mouse model, experimental autoimmune encephalomyelitis (EAE), lymphocyte infiltration is associated with destruction of myelin, often leading to profound neurologic impairments (1, 2). Although much is known about the cellular factors that contribute to disease progression in CNS autoimmunity, the contributions of the extracellular matrix (ECM) remain relatively poorly understood.
One ECM component that is abundant at sites of autoimmune inflammation is hyaluronan (HA), a glycosaminoglycan that contributes to tissue structure as well as cellular migration, signaling, and development (3). HA is synthesized by a class of integral membrane proteins called HA synthases (HAS1–3) and extruded through the cell membrane into the extracellular space (4). HA is highly abundant within chronically inflamed tissues, including wounds, liver cirrhosis, type 2 diabetes, and atherosclerotic plaques (3). Typically, HA at these sites has proinflammatory effects, driving dendritic cell maturation and promoting phagocytosis, antigen presentation, and T-cell activation (3–8). HA is also known to accumulate at sites of autoimmune inflammation, including pancreatic islets in type 1 diabetes (9), joints in rheumatoid arthritis (10), and other autoimmune diseases. In particular, HA fragments are known to promote inflammatory responses via interactions with Toll-like receptors (TLRs), including TLR2 and TLR4 (11, 12), and to function as a damage-associated molecular pattern molecule (13).
In MS, HA deposits are present in areas of demyelination (14). In the healthy CNS, astrocytes produce low levels of HA, depositing it as ECM complexes in the spaces between myelinated axons and between myelin sheaths and astrocyte processes (15). Upon injury, however, reactive astrocytes are the main producers of abundant amounts of HA, which accumulate in the damaged areas (14, 16, 17). As such, HA is highly abundant within demyelinated lesions in MS and in EAE, where it has been implicated in the extravasation of activated T cells into the CNS (14, 18).
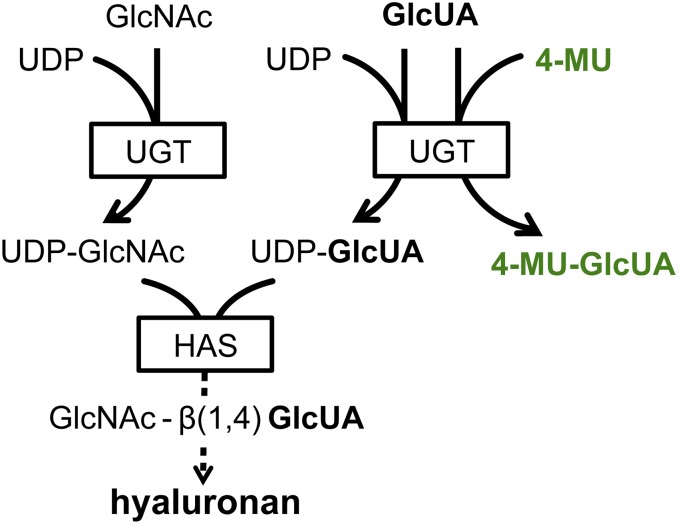
Given these associations with inflammation and autoimmunity, the suppression of HA production has been explored as a therapeutic strategy. The coumarin derivative 4-methylumbelliferone (4-MU, Hymecromone) in particular has been shown to inhibit HA production in vitro and in vivo (reviewed in ref. 19). 4-MU functions as a competitive substrate for UDP-glucuronyltransferase, an enzyme involved in HA synthesis (Fig. S1) (20, 21). In addition, it has been shown that 4-MU treatment lowers HAS expression, thus reducing the production of HA (21). A recent report has demonstrated that 4-MU decreases the incidence of autoimmunity in EAE (22). However, the impact of 4-MU on astrogliosis, and lymphocyte polarization and trafficking has not been fully delineated.
Fig. S1.
Postulated 4-MU mechanism of HA synthesis inhibition. HA is produced by HAS from the precursors UDP-glucuronic acid (UDP-GlcUA) and UDP-N-acetyl-glucosamine (UDP-GlcNAc). These are generated by the transfer of a UDP-residue to N-acetylglucosamine and glucuronic acid, respectively, via UDP-glucuronyltransferase. The availability of UDP-GlcUA and UDP-GlcNAc thereby controls HA synthesis. By enzymatic conjugation to GlcUA, 4-MU depletes cytosolic levels of UDP-GlcUA, thus inhibiting the synthesis of HA, dependent on this precursor. In addition to this mechanism, it has been shown that 4-MU treatment lowers HAS expression.
Here, we have treated EAE mice with 4-MU and assessed the effect of this treatment on the development and progression of EAE. In particular, we have tested the hypothesis that 4-MU treatment prevents the development of a pathogenic T-cell response and inhibits the trafficking of autoreactive T cells through lymphoid organs and into CNS tissue.
Results
4-MU Treatment Prevents and Ameliorates EAE.
We first assessed the impact of oral 4-MU treatment on clinical symptoms of myelin oligodendrocyte glycoprotein (35–55) (MOG35–55)–induced EAE in C57BL/6 mice. Treatment with 4-MU, started before induction of disease (pretreatment protocol) or after induction of the disease but before the onset of symptoms (treatment protocol), significantly reduced the incidence, delayed the onset, and decreased the severity of EAE (Fig. 1 A and B and Table S1). The incidence of EAE was 28% and 40% after pretreatment and treatment, respectively, compared with 90% in untreated animals. In addition, disease onset was delayed by 8.9 and 11.1 d. Severity was reduced to an average score of 0.03 ± 0.03 (peak score 1.0 ± 0.0) and 0.15 ± 0.11 (peak score 2.0 ± 0.6), after 4-MU pretreatment or treatment, compared with an average disease severity of 2.2 ± 0.2 (peak score 3.7 ± 0.2) in untreated animals. Moreover, an intervention protocol where 4-MU treatment was started after onset of symptoms (when animals reached a score of 1) significantly reduced disease severity to an average score of 1.4 ± 0.2 (peak score 2.6 ± 0.2) (Fig. 1C and Table S1), indicating that 4-MU ameliorates established disease.
Fig. 1.
Oral 4-MU treatment prevents and reverses autoimmune demyelination. (A–C) EAE scores of mice treated with 4-MU (5% wt/wt in the chow) started before induction of disease (A, pretreatment protocol), after induction of disease, before onset of symptoms (B, treatment protocol), or after onset of disease (when mice reached a score of 1; C, intervention protocol) induced by immunization with MOG35–55. (D) EAE scores of mice treated with 4-MU started 14 d before immunization continuously or until day 21 after immunization. Shown are mean scores ± SEM; *P < 0.05, **P < 0.01, ***P < 0.001, Mann–Whitney comparing treated mice with untreated mice (n = 10). Arrows indicate timing of disease induction (black arrows depicting immunization at day 0 and gray arrows the second PTX injection at day 2), and gray shaded boxes indicate the duration of 4-MU treatment.
Table S1.
Summary of treatment effect of 4-MU in EAE (mean values ± SEM)
| Experimental group | Incidence, % | Disease onset, day | Peak severity, score | Average severity d 12–22, score |
| Control | 90% (9/10) | 14.1 ± 0.6 | 3.7 ± 0.2 | 2.2 ± 0.2 |
| Pretreatment, start d 4 | 28% (2/7)** | 23.0 ± 2.0*** | 1.0 ± 0.0* | 0.03 ± 0.03* |
| Treatment, start d 2 | 40% (4/10) | 25.2 ± 3.9** | 2.0 ± 0.6* | 0.15 ± 0.11** |
| Intervention | n/a | 15.2 ± 1.1 | 2.6 ± 0.2** | 1.4 ± 0.2** |
P < 0.05, **P < 0.01, ***P < 0.001, Mann–Whitney comparing treated mice with untreated mice (n = 10).
To determine whether ongoing 4-MU treatment is required for extended disease prevention, we stopped treatment at day 21 after induction of disease. At this time point, treated animals showed no signs of disease, whereas untreated animals were at peak of disease. Cessation of treatment led to an immediate manifestation of disease, displaying the same kinetics as untreated disease at first onset (Fig. 1D). This indicates that the therapeutic effect of 4-MU requires continuous treatment.
4-MU Treatment Skews Th Cell Profiles Away from Th1.
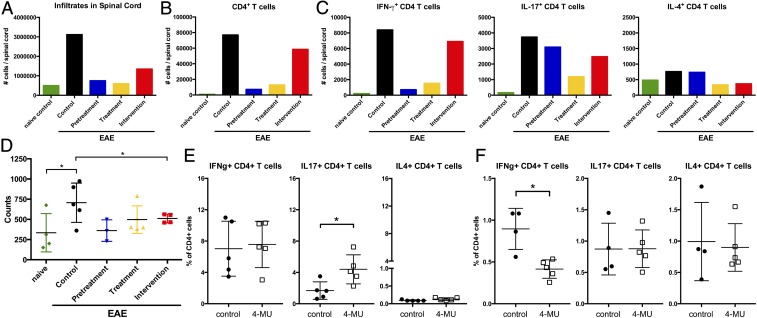
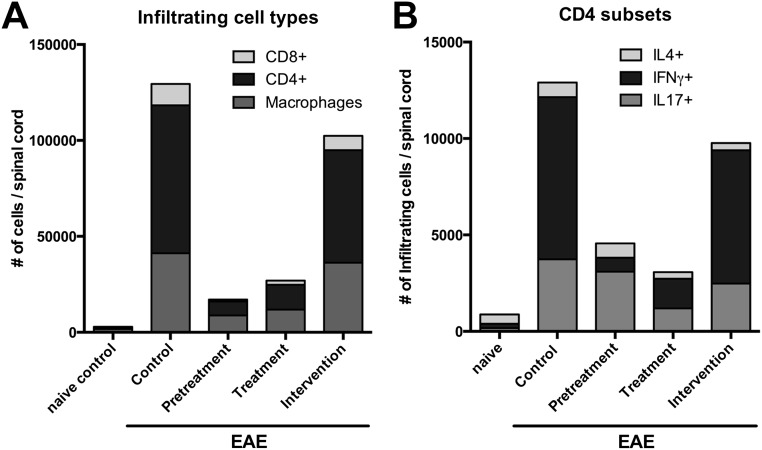
To determine how 4-MU treatment affected the inflammatory process in EAE, we analyzed the profile of infiltrating inflammatory cells in the spinal cord of 4-MU–treated and untreated animals using flow cytometry. Correlating with disease severity, total numbers of infiltrating inflammatory cells at peak of disease (day 22 after immunization) were significantly reduced by all 4-MU treatment protocols (Fig. 2A and Fig. S2). This reduction was mostly due to a reduction in the number of infiltrating CD4+ T cells (Fig. 2B and Fig. S3A). We therefore further assessed infiltrating Th1, Th17, and Th2 subsets in the spinal cord, using intracellular staining for IFN-g, IL-17, and IL-4, respectively. 4-MU treatment mostly reduced the number of infiltrating Th1 cells, whereas it only mildly reduced Th17 cell numbers and did not affect Th2 cell numbers (Fig. 2C and Fig. S3B).
Fig. 2.
4-MU treatment alters Th cell profiles. (A) Total number of cells, (B) total number of CD4+ cells, and (C) number of IFN-g–, IL-17–, and IL-4–producing cells detected in spinal cord tissue of naïve mice and EAE mice left untreated or after treatment with 4-MU using the treatment protocols described in Fig. 1. Cells were isolated from pooled spinal cords of five animals reflecting the average score per treatment group at peak of disease (day 22 after induction of disease) and analyzed by flow cytometry after intracellular cytokine staining. (D) Proliferation of splenocytes isolated from naïve mice and EAE mice left untreated, or after the various 4-MU treatment protocols at peak of disease, as measured by thymidine incorporation. Shown are individual values and mean ± SEM; *P < 0.05, unpaired t test, n = 4–5. (E) Number of IFNg–, IL-17–, and IL-4–producing cells in spleens at peak of disease (day 20) and (F) early in disease (day 3 after induction of disease). Splenocytes were isolated from five separate animals reflecting the average score per treatment group and analyzed by flow cytometry after intracellular cytokine staining. Shown are individual values and mean ± SEM; *P < 0.05, Mann–Whitney.
Fig. S2.
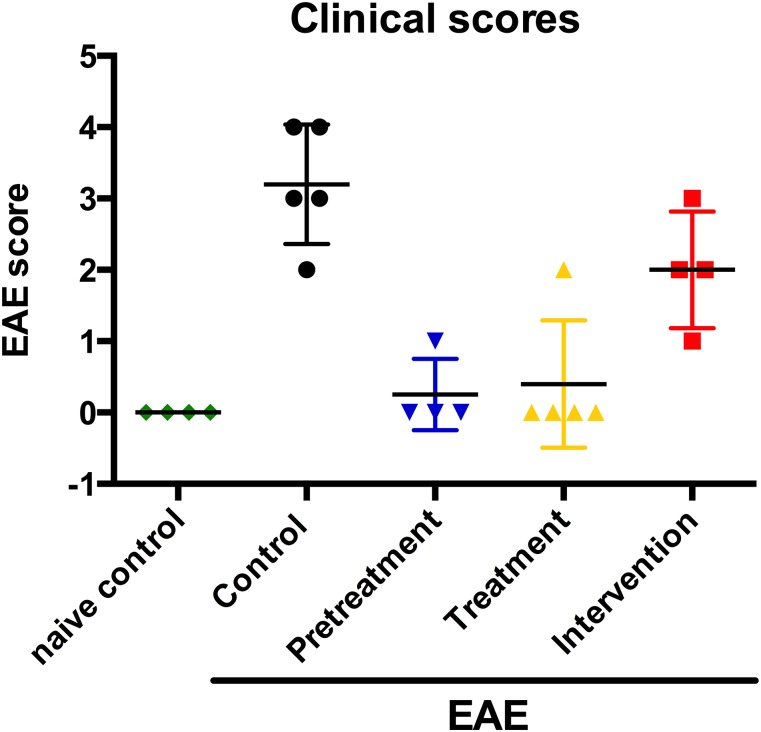
Clinical scores of animals used in flow cytometry analysis of T-cell populations in the spinal cord, spleen, and lymph nodes. Shown are disease scores of individual animals and the mean ± SEM at the time of harvest (peak of disease, day 22 after immunization).
Fig. S3.
Breakdown of cell populations infiltrated into the spinal cord. (A) Overview of CD4+, CD8+, and macrophage cells detected in spinal cord tissue of naïve mice and EAE mice left untreated or after treatment with 4-MU using the treatment protocols described in Fig. 1. (B) Overview of the number of IFN-g–, IL-17–, and IL-4–producing cells within the CD4+ cell population depicted in A. Cells were isolated from pooled spinal cords of five animals reflecting the average score per treatment group at peak of disease (day 22 after induction of disease) and analyzed by flow cytometry after cell surface and intracellular cytokine staining.
We further examined the effects of 4-MU on immunity within secondary lymphoid organs. Splenocyte proliferation after in vitro restimulation was reduced by all treatment protocols at peak of disease (Fig. 2D). We did not observe skewing of the Th response away from Th1 in secondary lymphoid organs at peak of disease (Fig. 2E). However, it did manifest at these sites early in the disease, before inflammatory cells had migrated to the CNS (on day 3 after immunization; Fig. 2F).
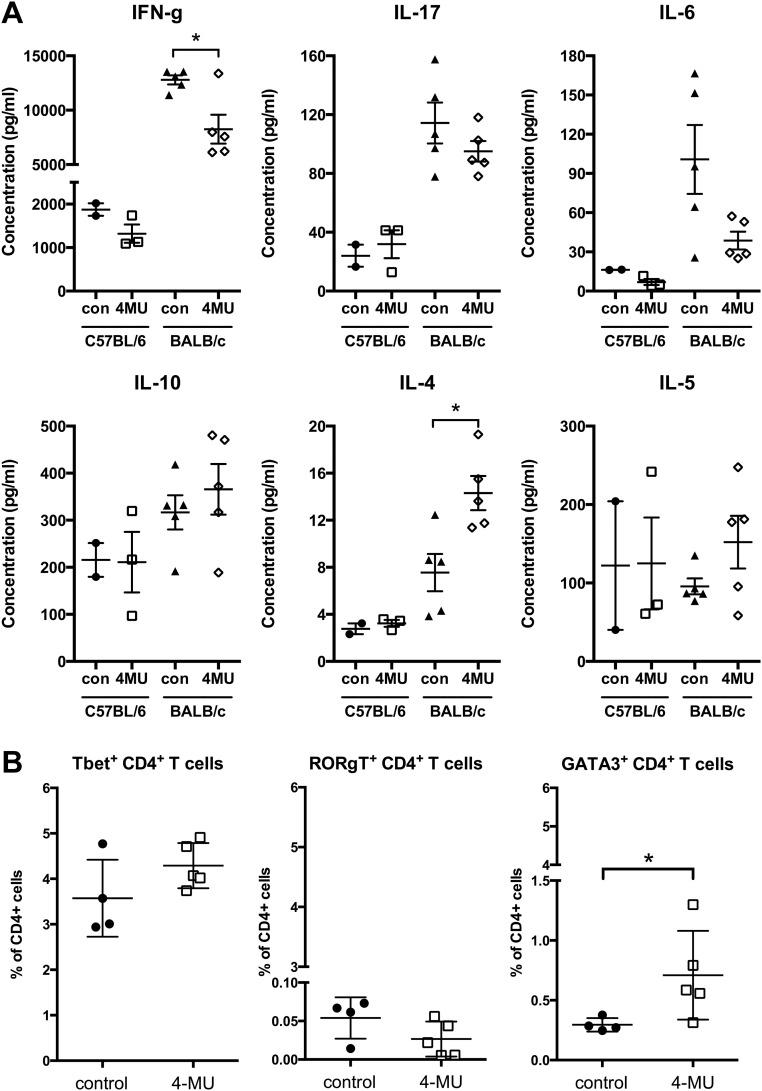
Consistent with these effects on peripheral Th subset polarization in the EAE model, we observed similar skewing away from IFN-g, IL-17, and IL-6 production and toward production of IL-4 and IL-5 in nonimmunized mice treated with 4-MU. In addition, treatment of these animals induced an increase in cells expressing GATA3, the master transcription factor of Th2 polarization (Fig. S4).
Fig. S4.
4-MU treatment alters Th cell polarization toward an anti-inflammatory profile in naïve mice. (A) Production of IFN-g, IL-17, IL-6, IL-10, IL-4, and IL-5, measured by ELISA, by splenocytes from naïve C57BL/6 or BALB/c mice either untreated or after 4-MU treatment (a minimum of 2 wk), stimulated in vitro with Con A (2 μg/mL). *P < 0.05, unpaired t test, n = 5. (B) Number of Th1, Th2, and Th17 cells, as assessed by expression of Tbet, RORgT, and GATA3, respectively, in the spleen of naïve C57BL/6 mice either untreated or after 4-MU treatment (a minimum of 2 wk). Splenocytes were isolated from five separate animals per treatment group and analyzed by flow cytometry after intracellular staining for transcription factors. Shown are individual values and mean ± SEM; *P < 0.05, Mann–Whitney.
Together, these data indicate that 4-MU limits Th1 polarization in both CNS autoimmunity as well as in peripheral, noninflamed tissues. However, the pace of these effects differs depending on the tissue in question.
4-MU Treatment Alters Treg Profiles.
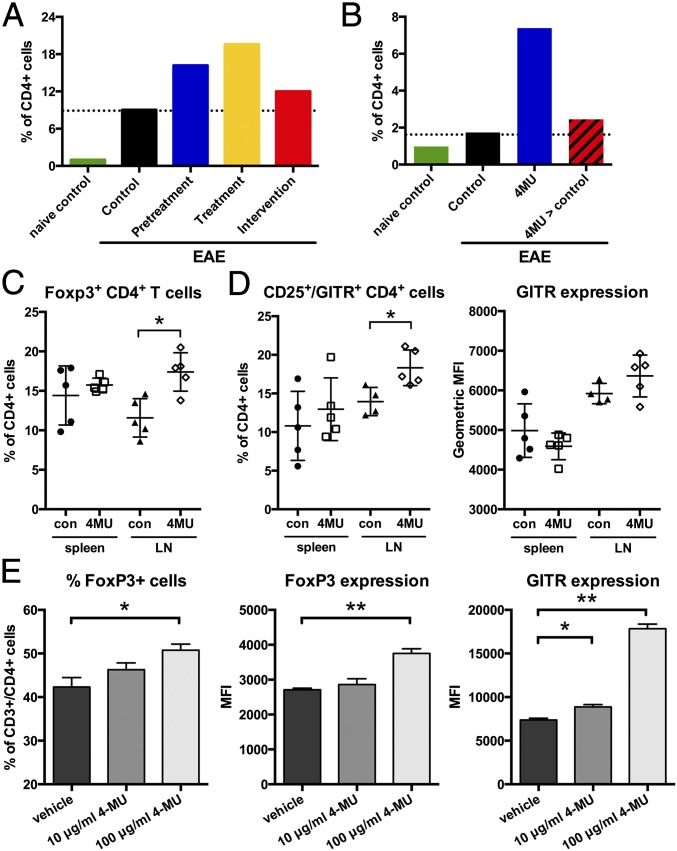
Given the reduced inflammation and improvements in disease outcomes, we asked whether 4-MU treatment enhanced immune regulation. We indeed observed that 4-MU treatment increased the infiltration of Treg into the spinal cord at peak of disease (Fig. 3A). Treg numbers returned to untreated levels when treatment was withdrawn (Fig. 3B), showing that continued inhibition of HA synthesis is necessary for the effect of 4-MU on Treg.
Fig. 3.
4-MU treatment supports the activation and persistence of Treg and their infiltration into the spinal cord. (A) Numbers of Foxp3+ Treg in spinal cord tissue at peak of disease (day 22) after the various 4-MU treatment protocols and (B) at day 34, 14 d after cessation of treatment (at day 21 postimmunization, 4-MU > control) compared with continuous treatment until day 34 (4-MU). (C) Percentage of Foxp3+ Treg in the spleen and lymph nodes (LNs) at peak of disease. (D) Percentage and expression levels of GITR (geometric MFI) of CD25high/GITR-expressing CD4+ cells in the spleen and LNs at peak of disease. Shown are individual values and mean ± SEM; *P < 0.05, Mann–Whitney. (E) Percentage of Foxp3+ cells and expression of Foxp3 and GITR in in vitro-induced Treg. 4-MU treatment was started 24 h after induction of Treg from CD4+ T cells using CD3/CD28 stimulation in the presence of IL-2 (100 IU/mL) and TGF-β (50 ng/mL), and cells were analyzed 48 h later. Shown are mean values + SEM; *P < 0.05, **P < 0.01, Mann–Whitney.
Concomitant with higher numbers of Treg in the spinal cord, we observed higher numbers of Foxp3+ Treg in lymphoid tissue in 4-MU–treated animals at peak of disease and in naïve animals treated with 4-MU (Fig. 3C and Fig. S5 A and B). In addition, lymphoid tissue contained a higher proportion of CD4+CD25+ T cells that also expressed the Treg costimulatory receptor glucocorticoid-induced tumor necrosis factor receptor-related protein (GITR), a regulator of Treg function (23, 24), both at peak of disease and in naïve-treated animals (Fig. 3D and Fig. S5B).
Fig. S5.
4-MU treatment increases Treg numbers in lymphoid tissue in EAE and in naïve animals. (A) Numbers of CD25+ CD4+ Treg in spinal cord tissue at peak of disease (day 22) after the various 4-MU treatment protocols. (B) Percentage of Foxp3+ Treg and percentage and expression levels of GITR (geometric MFI) of CD25high/GITR-expressing CD4+ cells in the spleen and lymph nodes (LNs) of naïve C57BL/6 mice either untreated or after 4-MU treatment (a minimum of 2 wk). Shown are individual values and mean ± SEM; *P < 0.05, Mann–Whitney.
To further explore the effect of 4-MU on the phenotype of Treg, we assessed the impact of 4-MU on Treg induction in vitro. 4-MU treatment initiated 24 h after stimulation of GFP–Foxp3-negative CD4+ T cells with anti-CD3/CD28 in the presence of IL2 and TGF-β increased the fraction of induced Treg and their expression of Foxp3 as well as GITR (Fig. 3E).
Together these data support the conclusion that 4-MU treatment promotes the differentiation of Foxp3+ Treg.
4-MU Treatment Impairs T-Cell Trafficking.
Given the observation that T-cell infiltration into the spinal cord was reduced, we investigated how 4-MU treatment impacts trafficking of T cells. To test this, we performed adoptive transfer of autoreactive, MOG-specific CD4+ T cells harvested from immunized, luciferase-expressing donor mice into albino C57BL/6 mice.
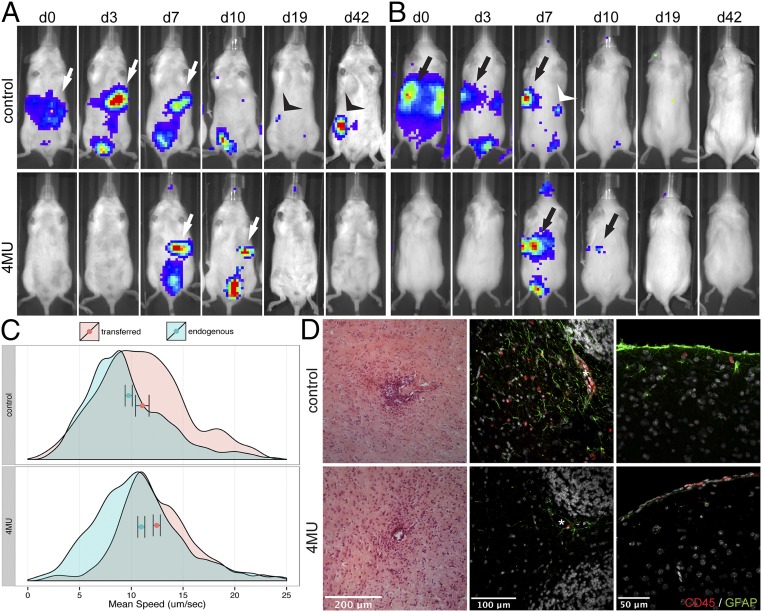
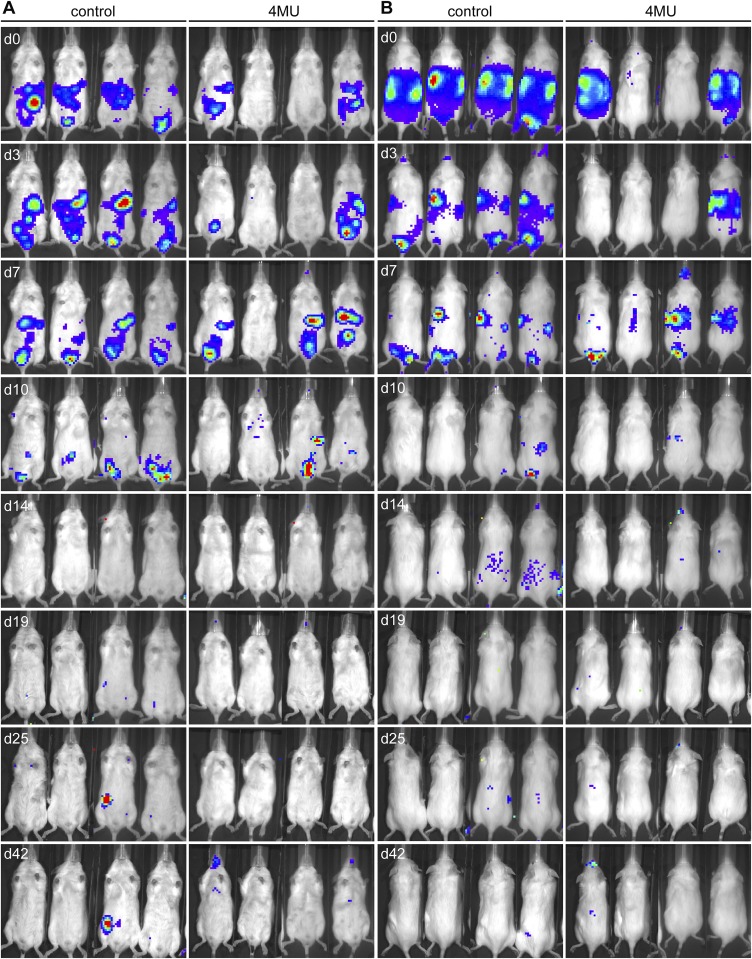
Trafficking of cells to the spleen occurred early in untreated mice and was visible in all mice 3 d after transfer, whereas this was delayed and more transient in 4-MU–treated mice. In these animals, cells were only visible in the spleen in three out of four mice and mostly after 7 d (Fig. 4 A and B, arrows, and Fig. S6). Moreover, cells did not persist in the spleens of 4-MU–treated mice as long as in untreated mice. Cells were visible in the spleen at three time points (with 3–4-d intervals) in untreated mice, whereas they were visible at two time points in 4-MU–treated animals (Fig. 4 A and B, arrows, and Fig. S6). Trafficking to lymph nodes was likewise observed in some of the untreated mice after 3–7 d but not in the 4-MU–treated mice (Fig. 4 A and B, arrow heads, and Fig. S6). Signal of transferred cells was lost by day 14 and reappeared in lymph nodes of some untreated mice by day 19, persisting until day 42, but did not reappear in 4-MU–treated mice (Fig. S6).
Fig. 4.
4-MU treatment results in more transient trafficking of T cells through secondary lymphoid organs and reduced infiltration into the CNS. (A) Ventral and (B) dorsal view of adoptively transferred luciferase-expressing, MOG-specific lymphocytes. Imaging was started 30 min after injection of the cells into the peritoneal cavity (d0), and luciferase-expressing cells were tracked for up to 42 d. Arrows and arrowheads indicate detectable luciferase signal in the spleen and lymph nodes, respectively. Shown is one representative per group of two independent experiments (n = 4 each). (C) Quantification of the speed of transferred naïve CD4+ T-cell (red histograms) and endogenous Foxp3+ Treg (green histograms) populations in untreated or 4-MU–treated mice (2 wk treatment). Cells were imaged by 2-photon microscopy in the popliteal lymph nodes 16 h after transfer and tracked for 15 min. Shown are representatives of three independent experiments. Bars indicate mean ± confidence interval. (D) H&E staining of cerebral white matter (Left panels) and immunofluorescence for CD45 (red) and GFAP (green) in the cerebellar peduncle (Middle panels) and the cortex of the cerebrum (Right panels) of untreated and 4-MU–treated mice at peak of disease (22 d after immunization).
Fig. S6.
4-MU treatment results in more transient trafficking of T cells through secondary lymphoid organs. (A) Ventral and (B) dorsal view in individual mice of adoptively transferred MOG-specific lymphocytes harvested from luciferase-expressing donor mice 10 d after immunization with MOG35–55 peptide. Imaging was started 30 min after injection of the cells (d0) into the i.p. cavity, and luciferase-expressing cells were tracked for up to 42 d. Shown is one representative of two independent experiments (n = 4 each).
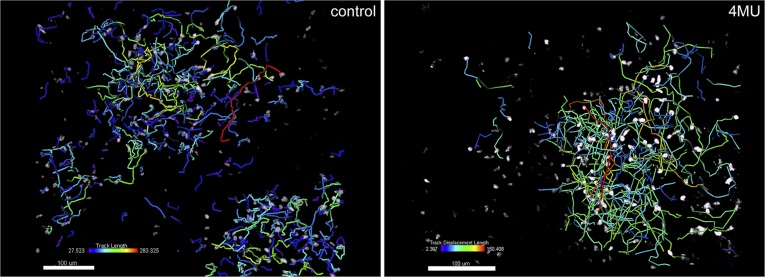
In addition to tracking CD4+ T cells throughout the whole body, we used 2-photon microscopy to assess the movement of transferred CD4+ cells and endogenous Foxp3+ Treg in lymph nodes. Analyzing the trafficking of these subsets of cells revealed that 4-MU treatment led to an increase in the speed of both transferred CD4+ T cells and endogenous Treg (Fig. 4C, Fig. S7, and Movie S1). This suggests that the interaction of T cells with resident lymph node tissue and cells is more transient after 4-MU treatment.
Fig. S7.
4-MU treatment results in more transient trafficking of T cells through secondary lymphoid organs. Shown is 2-photon microscopy analysis of tracks traveled by individual transferred naïve CD4+ T cells in untreated or 4-MU–treated mice (2 wk treatment). Cells were imaged in the popliteal lymph nodes 16 h after transfer and tracked for 15 min. Heat bars depict mean track velocity of each cell. Shown are representatives of three independent experiments.
Consistent with impaired trafficking to inflamed tissues, we saw less neuroinflammation in mice treated with 4-MU. In control mice, histology of brain tissue harvested at peak of disease showed widespread infiltration of CD45+ inflammatory cells into the brain parenchyma, associated with the presence of activated, glial fibrillary acidic protein (GFAP)-expressing astrocytes (Fig. 4D). CD45+ cells were present in brain tissue of 4-MU–treated animals as well, but their localization was restricted to the perivascular spaces and the meninges and extended less into the parenchyma.
Together, these data indicate that 4-MU treatment leads to a reduction in interactions between T cells with tissue parenchyma, a reduced transit time of these cells within secondary lymphoid tissue, and diminished infiltration into the CNS parenchyma.
4-MU Treatment Inhibits Astrogliosis Associated with EAE.
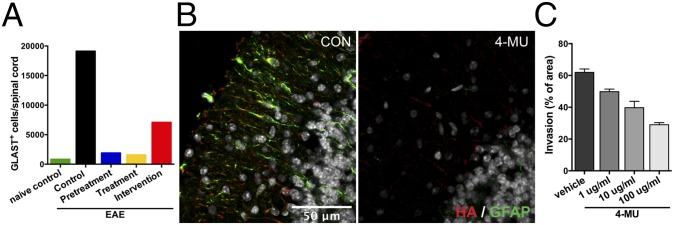
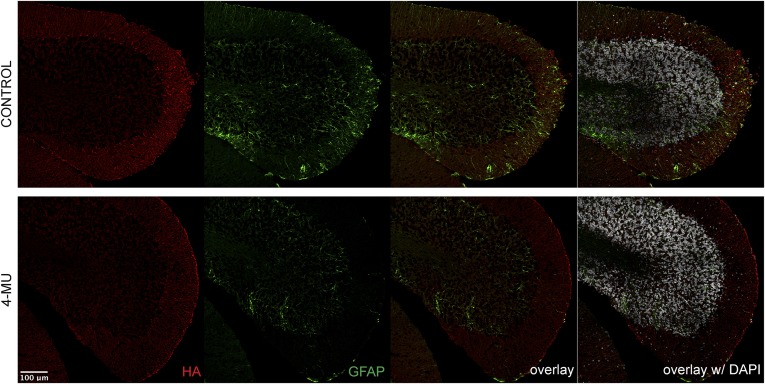
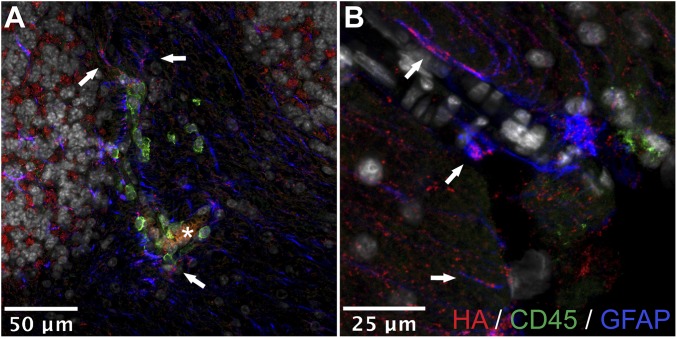
Astrocytes are known to be high producers of HA in neuroinflammation (14–17). We therefore evaluated the effect of 4-MU on astrogliosis in vivo and in vitro. Assessing the number of astrocytes in the spinal cord at peak of disease by flow cytometry, we found that 4-MU treatment decreased the number of astrocytes in the CNS (Fig. 5A). This finding was supported by a marked reduction in immunoreactivity for GFAP in the brain parenchyma of treated animals (Fig. 5B and Fig. S8). Conversely, untreated animals showed widespread astrogliosis and colocalization of HA with reactive astrocytes (Fig. 5B, Figs. S8 and S9, and Movie S2). These areas were also associated with infiltration of CD45+ cells (Fig. S9).
Fig. 5.
4-MU treatment reduces astrogliosis and colocalization of HA with astrocytes in EAE. (A) Numbers of GLAST+ astrocytes in the spinal cord at peak of disease after the various 4-MU treatment protocols, analyzed by flow cytometry. (B) Immunofluorescence for HA (red) and GFAP (green) in cerebellar cortex of untreated and 4-MU–treated mice at peak of disease. (C) In vitro astrogliosis depicted as percentage of scratched area that was invaded by astrocytes after 48 h. Shown are averages of three replicates + SEM.
Fig. S8.
4-MU treatment reduces HA deposits and astrogliosis in EAE. Shown is the immunofluorescence for HA (red) and GFAP (green) in the cerebellum of untreated and 4-MU–treated mice at peak of disease (22 d after immunization).
Fig. S9.
HA is associated with reactive astrocytes in EAE in vivo. Shown is the immunofluorescence for HA (red), CD45 (green), and GFAP (blue) in (A) cerebellar white matter and (B) cortex. Arrows indicate colocalization of HA on astrocyte processes; asterisk indicates the lumen of a blood vessel.
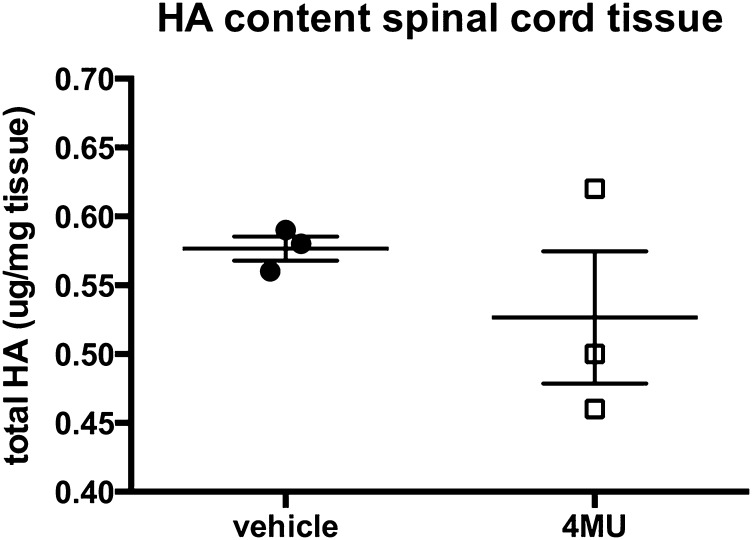
Consistent with these data, 4-MU dose-dependently inhibited astrogliosis in primary mouse astrocytes in vitro, as measured in a scratch assay (Fig. 5C). In addition, we observed a mild decrease in HA content in spinal cord sections upon in vitro 4-MU treatment (Fig. S10).
Fig. S10.
4-MU reduces HA content in spinal cord tissue in vitro. Quantification of HA content in spinal cord tissue that was cultured in the presence of 4-MU (100 μg/mL) or vehicle for 24 h. Spinal cord tissue was removed from the culture and snap-frozen before extraction of HA and quantification by ELISA. Shown are individual values and mean ± SEM.
Together, these findings suggest that 4-MU reduces astrogliosis, which is associated with HA depositions and T-cell infiltration.
Discussion
In the present study, we have examined the impact of 4-MU, an inhibitor of HA synthesis, on disease progression in the murine EAE model of MS. We demonstrate that 4-MU can both prevent EAE and ameliorate established disease, corroborating earlier findings (22). Moreover, we show that 4-MU treatment alters the phenotypic polarization of T cells and their trafficking to inflamed CNS tissue that underlies disease progression in this model.
Our results indicate that 4-MU treatment fundamentally alters the polarization of T cells. In particular, we found that 4-MU treatment skewed responses toward Th2 and away from the Th1 and Th17 subsets that typically predominate in EAE. Consistent with this result, we observed increased numbers of cells expressing GATA3, a key transcription factor involved in generating Th2 responses, upon 4-MU treatment. CD44, the primary HA receptor, is known to interact with some of the same Src/JAK/STAT signaling pathways that are involved in Th polarization (6), and it may be that absence of HA-mediated CD44 signaling impacts T-cell polarization in ways that favor GATA3 and Th2 differentiation. In support of this theory, CD44-deficient mice are likewise known to exhibit increased GATA3 expression and a bias toward Th2, accompanied by reduced Th1/Th17 differentiation (25, 26).
We also found that 4-MU treatment increased Foxp3+ Treg numbers in both the spinal cord and secondary lymphoid tissue. This is consistent with our recent report of 4-MU–mediated enhancement of Treg in mouse models of autoimmune diabetes (27) and with past work on the impact of 4-MU on EAE (22). Our data indicate that 4-MU also promotes increased expression of GITR, a key effector molecule for Treg (23, 24). Together, these effects on Th subsets and Treg may create an immunologic milieu that limits CNS autoimmunity.
Our results further reveal that 4-MU treatment inhibits leukocyte trafficking to inflamed CNS tissue. In particular, we find that 4-MU reduces transit time of lymphocytes through lymph nodes and reduces their retention within inflamed tissues. This is consistent with previous reports that HA can act as an anchor molecule for CD44+ lymphocytes, facilitating their adherence to endothelial cells and ECM structures (3, 28, 29). There are also indications that CD44 contributes to lymphocyte adhesion and diapedesis through the blood–brain barrier (30, 31) as well as specific trafficking to inflamed sites (32). Although reports on the implications of CD44 deficiency for neuroinflammation in EAE are conflicting (18, 26, 33), it has been shown that blocking CD44 using a monoclonal antibody prevents EAE by reducing T-cell infiltration into the CNS (31).
Similar to HA, we have shown earlier that another known ligand for CD44, osteopontin (OPN), is abundantly present in MS lesions and lack of the gene results in ameliorated EAE (34). This effect is associated with skewing of the autoreactive T-cell response away from Th1, whereas administration of OPN promotes the survival and infiltration of T cells into the CNS (35). Of note, a connection between HA and OPN has been described in various contexts. Overexpression of OPN induces HAS2 expression and ECM production, and enhances cell binding to HA in cancer cells (36–38). Conversely, it has been shown that OPN is a transcriptional target of HA-induced signaling and that the expression of both is correlated with migration of glioma cells (39, 40). Although the precise nature of the interaction between OPN and HA in T-cell activation and neuroinflammation remains to be further elucidated, our data indicate that the production of HA is a key element in these processes.
Furthermore, we show here that 4-MU treatment reduces astrogliosis in vitro and in vivo. Historically, the role of astrocytes in neuroinflammation has been thought to be limited to a secondary response to injury, creating an inert astroglial scar that prevents further damage. However, more recent findings suggest that, depending on the context, (aberrant) astrogliosis could play a pathological role in a variety of neurological diseases, including MS (41, 42). It has been shown that astrogliosis is a major component contributing to HA deposition in EAE lesions (14, 22). Reactive astrocytes produce high levels of HA, and this HA might in turn provide a feed-forward loop by signaling through CD44 on reactive astrocytes, thereby sustaining astrogliosis (43, 44). We hypothesize that through this production of HA, reactive astrocytes play a role in the infiltration of pathogenic T cells into the CNS. This is in line with recent studies that illustrate a role for astrocyte activation in mediating MS and EAE progression and the recruitment of T cells to the CNS in EAE (45, 46). Considering that there are currently few therapies targeting astrocyte activation in neurological disease, our finding that 4-MU treatment reduces astrogliosis in vivo is therefore particularly pertinent to its therapeutic potential.
Together, our findings suggest that inhibition of HA synthesis may be a novel therapeutic strategy in CNS autoimmunity. Considering that 4-MU is currently an approved therapeutic throughout Europe and Asia, we therefore propose that 4-MU treatment has great promise for the treatment of MS as well as other autoimmune diseases where HA has been implicated in disease progression (10, 27). Multiple issues must be addressed, however, before 4-MU can be evaluated for treatment of autoimmunity in humans, including questions of dosing. In the present study, we incorporated 5% 4-MU into standard mouse chow, a formulation that we previously established delivers 250 mg per mouse per day, yielding a plasma drug concentration of 640.3 ± 17.2 nmol/L (47). This regimen has been shown to suppress HA levels in several tissue types, including serum and pancreatic tissues (27). However, this dose is substantially more than the dose of 4-MU typically given to humans (19). Assessments of the minimal effective dose and optimal dosing interval of 4-MU in these models would be important to know. Furthermore, the clearance kinetics of the drug would be valuable, given the rapid recurrence of EAE upon cessation of 4-MU treatment. In addition, it would be important to demonstrate that the effects of 4-MU reported here are due exclusively to HA inhibition and not to other potential anti-inflammatory effects, such as antioxidative properties. Although hymecromone is typically well-tolerated in people and we have not observed any side effects of long-term (over 9 mo) treatment in mice, a comprehensive survey of potential side effects, such as effects on connective tissues and immunologic parameters, of 4-MU would also be warranted.
In summary, we report that the ECM, and HA in particular, may be an active contributor to autoimmune pathogenesis in EAE and, furthermore, that 4-MU is a promising potential treatment for CNS autoimmunity, pending further study.
Methods
Induction and 4-MU Treatment of EAE.
EAE was induced in female C57BL/6J mice (Jackson Laboratories) at 8–12 wk of age by s.c. immunization with an emulsion containing 200 μg of MOG35–55 in saline and an equal volume of complete Freund’s adjuvant containing 400 ng of Mycobacterium tuberculosis H37RA (Difco Laboratories). All mice were administered 400 ng of pertussis toxin (List Biological) intraperitoneally (i.p.) at 0 and 48 h postimmunization. Mice were monitored daily for clinical symptoms as follows: 0, no clinical disease; 1, tail weakness; 2, hindlimb weakness; 3, complete hindlimb paralysis; 4, hindlimb paralysis and some forelimb weakness; 5, moribund or dead.
4-MU (Alfa Aesar) was pressed into the mouse chow at 5% (wt/wt) by TestDiet and irradiated before shipment, as previously described (47). Specific 4-MU treatment regimens are described in the figure legends. All animal experiments were approved by and performed in compliance with the National Institutes of Health (NIH) guidelines and with the Institutional Animal Care and Use Committee at Stanford University.
Isolation of Cells and Flow Cytometry.
Cells were harvested from spleens, brachial and axillary lymph nodes, and spinal cord tissue. Spleens and lymph nodes were homogenized through a strainer, and red blood cells were lysed in the splenocyte suspensions. Pooled spinal cord tissue from four to five mice per group was homogenized using a dounce homogenizer. Cells were then isolated by density centrifugation using a 28% (vol/vol) Percoll solution, layered with PBS.
Cells were stained according to standard protocols using antibodies listed in Table S2 using staining reagents and protocols as per the manufacturer’s instructions. Flow cytometry was performed on an LSRII (Becton Dickinson) in the Stanford Shared FACS Facility, and data analysis was done using FlowJo (Treestar).
Table S2.
Antibodies used for flow cytometry
| Target antigen | Antibody clone | Source |
| CD3 | 17A2 | Biolegend |
| CD4 | GK1.5 | Biolegend |
| CD25 | PC61 | Biolegend |
| GITR | YGITR765 | Biolegend |
| IFN-g | XMG1.2 | Biolegend |
| IL-5 | TRFK5 | Biolegend |
| IL-4 | 11B11 | BD Pharmingen |
| IL-17 | 17B7 | eBioscience |
| Foxp3 | FJK.16a | eBioscience |
| Tbet | 4B10 | eBioscience |
| RORgT | B2D | eBioscience |
| GATA3 | TWAJ | eBioscience |
Histology.
Mice were deeply anesthetized with ketamine/xylazine (100 mg/kg and 7 mg/kg, respectively), transcardially perfused (saline followed by 4% (wt/vol) paraformaldehyde in PBS), and brains were collected. Tissue was postfixed overnight in 4% paraformaldehyde at 4 °C, then cryoprotected in 30% (wt/vol) sucrose and stored at 4 °C until they were embedded in Optimal Cutting Temperature compound (Tissue-Tek) and frozen at −80 °C.
Cryosections (20 μm) were stained using a free-floating immunohistochemistry protocol. Briefly, after blocking in 5% (vol/vol) normal donkey serum in Tris-buffered saline with 0.3% Triton X-100 (TBS-T), sections were incubated overnight at 4 °C in TBS-T with 1% normal donkey serum and the following primary antibodies: goat anti-GFAP (Abcam ab53554; 1:1,000) and rat anti-CD45 (clone 30-F11, Life Technologies MCD4500; 1:500). Species-specific fluorescent secondary antibodies from donkey conjugated with FITC, Cy3, or Cy5 (Jackson Laboratories) were all used at 1:500. HA was detected using biotinylated HA binding protein (HABP, 2.5 μg/mL) and secondary detection using fluorophore-conjugated streptavidin. Imaging was done with a confocal laser scanning microscope (Zeiss LSM 700), using multichannel configuration with a 40× objective and electronic zoom of 1. For hematoxilin and eosin staining, sections were mounted on superfrost plus slides. After drying overnight, sections were stained with hematoxylin and eosin. Images were processed using ImageJ (version 1.44, NIH).
In Vitro Astrogliosis.
Primary astrocyte cultures were derived from 7-d-old mouse pups and enriched using a modified immunopanning method. Briefly, brain tissue was dissected and enzymatically dissociated to a single-cell suspension. Microglia were first depleted by two panning steps on plates coated with BSL-1 (Vector Laboratories). Oligodendrocyte progenitors were then depleted on an anti-PDGFRα (BD Pharmingen 558774)–coated plate, and the remaining astrocyte-enriched cell suspension was plated in uncoated T75 flasks in DMEM (HyClone) containing 10% (vol/vol) FBS, 4.5 g/L glucose, 4 mM l-glutamine, 1 mM sodium pyruvate, 100 U/mL penicillin, and 0.1 mg/mL streptomycin.
Cells, grown in 24-well plates until 80–90% confluent, were scratched with a 20–200-μL pipet tip and left to proliferate for up to 48 h. Pictures were taken with light microscopy immediately and 48 h after the scratch insult. Sets of pictures were then analyzed using ImageJ.
Bioluminescence Tracking of Adoptively Transferred T Cells.
For adoptive transfer of luciferase-expressing autoreactive cells, 7–10-wk-old male B6.FVB-Ptprca Tg(CAG-luc,-GFP)L2G85Chco Thy1a/J mice, which express the CAT-luc-eGFP, L2G85 transgene (48), were immunized according to the active EAE induction protocol. At 10 d after immunization, the spleen and draining lymph nodes were isolated and restimulated in vitro for 3 d with 10 µg/mL MOG35–55 in the presence of 10 ng/mL IL-12. After this, 15 × 106 lymphocytes were injected per mouse i.p. into 8–9-wk-old male albino C57BL/6 [B6(Cg)-Tyrc-2J/J; Jackson Laboratories]. Imaging was initiated 30 min after injection of the cells and repeated every 3–4 d for up to 42 d.
Bioluminescence was detected with an IVIS Spectrum Imaging System (Xenogen). Mice were injected i.p. with 150 mg/kg d-luciferin (Xenogen) 10 min before imaging and anesthetized with isofluorane during imaging. Luciferase signal was quantitated as photons per seconds per cm2 per steridian using Living Image software 4.4 (Xenogen) and integrated over 5 min. Background bioluminescence signal measured in nontransferred mice of both treatment groups, injected with d-luciferin, was subtracted from all corresponding images.
2-Photon Microscopy.
CD4+ cells were isolated from spleens and lymph nodes from C57BL/6 mice and labeled with CellTracker Orange CMTMR dye (ThermoFisher) according to the manufacturer’s protocol. We transferred 5 × 10⁶ labeled cells into Foxp3-GFP–expressing 10BiT mice (49) 16 h before imaging. Mice were anesthetized by initial i.p injection of 100 mg/kg ketamine, 15 mg/kg xylazine, and 2.5 mg/kg acepromazine and then supplemented hourly with half this dose. Mice were placed on a warmed plate and kept at a core temperature of 37 °C. The popliteal lymph node was gently surgically exposed, preserving normal blood flow. The foot was placed on a silicone stage, and the lymph node was covered with a glass-bottom imaging chamber.
Imaging was performed using an Ultima IV 2-photon microscope (Prairie Technologies) incorporating a pulsed laser (Deep See Mai Tai, Newport Corp.) tuned to 880 nm to simultaneously excite all used fluorophores: GFP (Foxp3-GFP cells) and CMTMR (adoptively transferred CD4+ T cells). A water-immersion 20× (N.A. 0.95) objective (Olympus) was used.
To create a typical time-lapse sequence, a 50–80-μm-thick section of lymph node was scanned at 5 μm Z-steps every 40–50 s. Image analysis was performed with IMARIS software (Bitplane Inc.). 3D velocity of T cells was calculated from the coordinates of their centroids tracked for the full length of a movie (15–20 min).
Statistics.
Statistical analysis was performed using GraphPad Prism software, version 6.0. A Kolmogorov–Smirnov test was used to verify normality of samples. In samples with Gaussian distribution, an unpaired t test was used to determine significant differences between groups, or a two-way ANOVA was used to identify effects of multiple parameters. In samples without Gaussian distribution, a nonparametric Mann–Whitney test was used to determine significant differences. A P value less than 0.05 was considered statistically significant.
Supplementary Material
Acknowledgments
We appreciate the use of the Stanford Neuroscience Microscopy Service Center, supported by NIH Grant NS069375 and the Stanford Shared FACS Facility. This work was supported in part by Human Frontier Science Program Long Term Fellowship LT830 and California Institute for Regenerative Medicine Training Grant TG2-01159 (to H.F.K.); NIH Grants R01 DK096087-01, R01 HL113294-01A1, and U01 AI101984 and grants from the Stanford University Child Health Research Institute and SPARK Program (to P.L.B.); Juvenile Diabetes Research Foundation Grant 3-PDF-2014-224-A-N (to N.N.); a U01 AI101990 Pilot Project and Building Interdisciplinary Research Team Supplement AR037296 (to T.N.W.); and NIH Grant R01 GM110481 (to M.J.B.).
Footnotes
Conflict of interest statement: P.L.B., N.N., and H.F.K. have filed a patent on the use of 4-methylumbelliferone treatment for immune modulation (International Patent Application PCT/US14/50770).
This article contains supporting information online at www.pnas.org/lookup/suppl/doi:10.1073/pnas.1525086113/-/DCSupplemental.
References
- 1.Compston A, Coles A. Multiple sclerosis. Lancet. 2002;359(9313):1221–1231. doi: 10.1016/S0140-6736(02)08220-X. [DOI] [PubMed] [Google Scholar]
- 2.Steinman L. Immunology of relapse and remission in multiple sclerosis. Annu Rev Immunol. 2014;32:257–281. doi: 10.1146/annurev-immunol-032713-120227. [DOI] [PubMed] [Google Scholar]
- 3.Jiang D, Liang J, Noble PW. Hyaluronan as an immune regulator in human diseases. Physiol Rev. 2011;91(1):221–264. doi: 10.1152/physrev.00052.2009. [DOI] [PMC free article] [PubMed] [Google Scholar]
- 4.Laurent TC, Laurent UB, Fraser JR. The structure and function of hyaluronan: An overview. Immunol Cell Biol. 1996;74(2):A1–A7. doi: 10.1038/icb.1996.32. [DOI] [PubMed] [Google Scholar]
- 5.Termeer C, et al. Oligosaccharides of Hyaluronan activate dendritic cells via toll-like receptor 4. J Exp Med. 2002;195(1):99–111. doi: 10.1084/jem.20001858. [DOI] [PMC free article] [PubMed] [Google Scholar]
- 6.Jiang D, et al. Regulation of lung injury and repair by Toll-like receptors and hyaluronan. Nat Med. 2005;11(11):1173–1179. doi: 10.1038/nm1315. [DOI] [PubMed] [Google Scholar]
- 7.Bollyky PL, et al. Th1 cytokines promote T-cell binding to antigen-presenting cells via enhanced hyaluronan production and accumulation at the immune synapse. Cell Mol Immunol. 2010;7(3):211–220. doi: 10.1038/cmi.2010.9. [DOI] [PMC free article] [PubMed] [Google Scholar]
- 8.Bollyky PL, Bogdani M, Bollyky JB, Hull RL, Wight TN. The role of hyaluronan and the extracellular matrix in islet inflammation and immune regulation. Curr Diab Rep. 2012;12(5):471–480. doi: 10.1007/s11892-012-0297-0. [DOI] [PMC free article] [PubMed] [Google Scholar]
- 9.Bogdani M, et al. Hyaluronan and hyaluronan-binding proteins accumulate in both human type 1 diabetic islets and lymphoid tissues and associate with inflammatory cells in insulitis. Diabetes. 2014;63(8):2727–2743. doi: 10.2337/db13-1658. [DOI] [PMC free article] [PubMed] [Google Scholar]
- 10.Yoshioka Y, et al. Suppression of hyaluronan synthesis alleviates inflammatory responses in murine arthritis and in human rheumatoid synovial fibroblasts. Arthritis Rheum. 2013;65(5):1160–1170. doi: 10.1002/art.37861. [DOI] [PubMed] [Google Scholar]
- 11.McKee CM, et al. Hyaluronan (HA) fragments induce chemokine gene expression in alveolar macrophages. The role of HA size and CD44. J Clin Invest. 1996;98(10):2403–2413. doi: 10.1172/JCI119054. [DOI] [PMC free article] [PubMed] [Google Scholar]
- 12.Scheibner KA, et al. Hyaluronan fragments act as an endogenous danger signal by engaging TLR2. J Immunol. 2006;177(2):1272–1281. doi: 10.4049/jimmunol.177.2.1272. [DOI] [PubMed] [Google Scholar]
- 13.Jiang D, Liang J, Noble PW. Hyaluronan in tissue injury and repair. Annu Rev Cell Dev Biol. 2007;23:435–461. doi: 10.1146/annurev.cellbio.23.090506.123337. [DOI] [PubMed] [Google Scholar]
- 14.Back SA, et al. Hyaluronan accumulates in demyelinated lesions and inhibits oligodendrocyte progenitor maturation. Nat Med. 2005;11(9):966–972. doi: 10.1038/nm1279. [DOI] [PubMed] [Google Scholar]
- 15.Asher R, Perides G, Vanderhaeghen JJ, Bignami A. Extracellular matrix of central nervous system white matter: Demonstration of an hyaluronate-protein complex. J Neurosci Res. 1991;28(3):410–421. doi: 10.1002/jnr.490280314. [DOI] [PubMed] [Google Scholar]
- 16.Struve J, et al. Disruption of the hyaluronan-based extracellular matrix in spinal cord promotes astrocyte proliferation. Glia. 2005;52(1):16–24. doi: 10.1002/glia.20215. [DOI] [PubMed] [Google Scholar]
- 17.Cargill R, et al. Astrocytes in aged nonhuman primate brain gray matter synthesize excess hyaluronan. Neurobiol Aging. 2012;33(4):830.e13–830.e24. doi: 10.1016/j.neurobiolaging.2011.07.006. [DOI] [PMC free article] [PubMed] [Google Scholar]
- 18.Winkler CW, et al. Hyaluronan anchored to activated CD44 on central nervous system vascular endothelial cells promotes lymphocyte extravasation in experimental autoimmune encephalomyelitis. J Biol Chem. 2012;287(40):33237–33251. doi: 10.1074/jbc.M112.356287. [DOI] [PMC free article] [PubMed] [Google Scholar]
- 19.Nagy N, et al. 4-methylumbelliferone treatment and hyaluronan inhibition as a therapeutic strategy in inflammation, autoimmunity, and cancer. Front Immunol. 2015;6:123. doi: 10.3389/fimmu.2015.00123. [DOI] [PMC free article] [PubMed] [Google Scholar]
- 20.Kakizaki I, et al. A novel mechanism for the inhibition of hyaluronan biosynthesis by 4-methylumbelliferone. J Biol Chem. 2004;279(32):33281–33289. doi: 10.1074/jbc.M405918200. [DOI] [PubMed] [Google Scholar]
- 21.Kultti A, et al. 4-Methylumbelliferone inhibits hyaluronan synthesis by depletion of cellular UDP-glucuronic acid and downregulation of hyaluronan synthase 2 and 3. Exp Cell Res. 2009;315(11):1914–1923. doi: 10.1016/j.yexcr.2009.03.002. [DOI] [PubMed] [Google Scholar]
- 22.Mueller AM, Yoon BH, Sadiq SA. Inhibition of hyaluronan synthesis protects against central nervous system (CNS) autoimmunity and increases CXCL12 expression in the inflamed CNS. J Biol Chem. 2014;289(33):22888–22899. doi: 10.1074/jbc.M114.559583. [DOI] [PMC free article] [PubMed] [Google Scholar]
- 23.Lio C-WJ, Hsieh C-S. A two-step process for thymic regulatory T cell development. Immunity. 2008;28(1):100–111. doi: 10.1016/j.immuni.2007.11.021. [DOI] [PMC free article] [PubMed] [Google Scholar]
- 24.Burchill MA, et al. Linked T cell receptor and cytokine signaling govern the development of the regulatory T cell repertoire. Immunity. 2008;28(1):112–121. doi: 10.1016/j.immuni.2007.11.022. [DOI] [PMC free article] [PubMed] [Google Scholar]
- 25.Guan H, Nagarkatti PS, Nagarkatti M. Role of CD44 in the differentiation of Th1 and Th2 cells: CD44-deficiency enhances the development of Th2 effectors in response to sheep RBC and chicken ovalbumin. J Immunol. 2009;183(1):172–180. doi: 10.4049/jimmunol.0802325. [DOI] [PMC free article] [PubMed] [Google Scholar]
- 26.Guan H, Nagarkatti PS, Nagarkatti M. CD44 reciprocally regulates the differentiation of encephalitogenic Th1/Th17 and Th2/regulatory T cells through epigenetic modulation involving DNA methylation of cytokine gene promoters, thereby controlling the development of experimental autoimmune encephalomyelitis. J Immunol. 2011;186(12):6955–6964. doi: 10.4049/jimmunol.1004043. [DOI] [PMC free article] [PubMed] [Google Scholar]
- 27.Nagy N, et al. Inhibition of hyaluronan synthesis restores immune tolerance during autoimmune insulitis. J Clin Invest. 2015;125(10):3928–3940. doi: 10.1172/JCI79271. [DOI] [PMC free article] [PubMed] [Google Scholar]
- 28.Evanko SP, Potter-Perigo S, Bollyky PL, Nepom GT, Wight TN. Hyaluronan and versican in the control of human T-lymphocyte adhesion and migration. Matrix Biol. 2012;31(2):90–100. doi: 10.1016/j.matbio.2011.10.004. [DOI] [PMC free article] [PubMed] [Google Scholar]
- 29.DeGrendele HC. Requirement for CD44 in activated T cell extravasation into an inflammatory site. Science. 1997;278(5338):672–675. doi: 10.1126/science.278.5338.672. [DOI] [PubMed] [Google Scholar]
- 30.Brennan FR, et al. CD44 is involved in selective leucocyte extravasation during inflammatory central nervous system disease. Immunology. 1999;98(3):427–435. doi: 10.1046/j.1365-2567.1999.00894.x. [DOI] [PMC free article] [PubMed] [Google Scholar]
- 31.Brocke S, Piercy C, Steinman L, Weissman IL, Veromaa T. Antibodies to CD44 and integrin alpha4, but not L-selectin, prevent central nervous system inflammation and experimental encephalomyelitis by blocking secondary leukocyte recruitment. Proc Natl Acad Sci USA. 1999;96(12):6896–6901. doi: 10.1073/pnas.96.12.6896. [DOI] [PMC free article] [PubMed] [Google Scholar]
- 32.Nandi A, Estess P, Siegelman MH. Hyaluronan anchoring and regulation on the surface of vascular endothelial cells is mediated through the functionally active form of CD44. J Biol Chem. 2000;275(20):14939–14948. doi: 10.1074/jbc.275.20.14939. [DOI] [PubMed] [Google Scholar]
- 33.Flynn KM, Michaud M, Madri JA. CD44 deficiency contributes to enhanced experimental autoimmune encephalomyelitis: A role in immune cells and vascular cells of the blood-brain barrier. Am J Pathol. 2013;182(4):1322–1336. doi: 10.1016/j.ajpath.2013.01.003. [DOI] [PMC free article] [PubMed] [Google Scholar]
- 34.Chabas D, et al. The influence of the proinflammatory cytokine, osteopontin, on autoimmune demyelinating disease. Science. 2001;294(5547):1731–1735. doi: 10.1126/science.1062960. [DOI] [PubMed] [Google Scholar]
- 35.Hur EM, et al. Osteopontin-induced relapse and progression of autoimmune brain disease through enhanced survival of activated T cells. Nat Immunol. 2007;8(1):74–83. doi: 10.1038/ni1415. [DOI] [PubMed] [Google Scholar]
- 36.Cook AC, Chambers AF, Turley EA, Tuck AB. Osteopontin induction of hyaluronan synthase 2 expression promotes breast cancer malignancy. J Biol Chem. 2006;281(34):24381–24389. doi: 10.1074/jbc.M602694200. [DOI] [PubMed] [Google Scholar]
- 37.Tajima K, et al. Osteopontin-mediated enhanced hyaluronan binding induces multidrug resistance in mesothelioma cells. Oncogene. 2010;29(13):1941–1951. doi: 10.1038/onc.2009.478. [DOI] [PubMed] [Google Scholar]
- 38.Marroquin CE, Downey L, Guo H, Kuo PC. Osteopontin increases CD44 expression and cell adhesion in RAW 264.7 murine leukemia cells. Immunol Lett. 2004;95(1):109–112. doi: 10.1016/j.imlet.2004.06.001. [DOI] [PubMed] [Google Scholar]
- 39.Zhang F-J, et al. The effect of hyaluronic acid on osteopontin and CD44 mRNA of fibroblast-like synoviocytes in patients with osteoarthritis of the knee. Rheumatol Int. 2013;33(1):79–83. doi: 10.1007/s00296-011-2339-3. [DOI] [PubMed] [Google Scholar]
- 40.Park JB, Kwak H-J, Lee S-H. Role of hyaluronan in glioma invasion. Cell Adhes Migr. 2008;2(3):202–207. doi: 10.4161/cam.2.3.6320. [DOI] [PMC free article] [PubMed] [Google Scholar]
- 41.Hamby ME, Sofroniew MV. Reactive astrocytes as therapeutic targets for CNS disorders. Neurotherapeutics. 2010;7(4):494–506. doi: 10.1016/j.nurt.2010.07.003. [DOI] [PMC free article] [PubMed] [Google Scholar]
- 42.Miljković D, Timotijević G, Mostarica Stojković M. Astrocytes in the tempest of multiple sclerosis. FEBS Lett. 2011;585(23):3781–3788. doi: 10.1016/j.febslet.2011.03.047. [DOI] [PubMed] [Google Scholar]
- 43.Haegel H, Tölg C, Hofmann M, Ceredig R. Activated mouse astrocytes and T cells express similar CD44 variants. Role of CD44 in astrocyte/T cell binding. J Cell Biol. 1993;122(5):1067–1077. doi: 10.1083/jcb.122.5.1067. [DOI] [PMC free article] [PubMed] [Google Scholar]
- 44.Dzwonek J, Wilczynski GM. CD44: Molecular interactions, signaling and functions in the nervous system. Front Cell Neurosci. 2015;9:175. doi: 10.3389/fncel.2015.00175. [DOI] [PMC free article] [PubMed] [Google Scholar]
- 45.Mayo L, et al. Regulation of astrocyte activation by glycolipids drives chronic CNS inflammation. Nat Med. 2014;20(10):1147–1156. doi: 10.1038/nm.3681. [DOI] [PMC free article] [PubMed] [Google Scholar]
- 46.Toft-Hansen H, Füchtbauer L, Owens T. Inhibition of reactive astrocytosis in established experimental autoimmune encephalomyelitis favors infiltration by myeloid cells over T cells and enhances severity of disease. Glia. 2011;59(1):166–176. doi: 10.1002/glia.21088. [DOI] [PubMed] [Google Scholar]
- 47.Nagy N, et al. Inhibition of hyaluronan synthesis accelerates murine atherosclerosis: Novel insights into the role of hyaluronan synthesis. Circulation. 2010;122(22):2313–2322. doi: 10.1161/CIRCULATIONAHA.110.972653. [DOI] [PubMed] [Google Scholar]
- 48.Cao Y-A, et al. Shifting foci of hematopoiesis during reconstitution from single stem cells. Proc Natl Acad Sci USA. 2004;101(1):221–226. doi: 10.1073/pnas.2637010100. [DOI] [PMC free article] [PubMed] [Google Scholar]
- 49.Maynard CL, et al. Regulatory T cells expressing interleukin 10 develop from Foxp3+ and Foxp3- precursor cells in the absence of interleukin 10. Nat Immunol. 2007;8(9):931–941. doi: 10.1038/ni1504. [DOI] [PubMed] [Google Scholar]
Associated Data
This section collects any data citations, data availability statements, or supplementary materials included in this article.


