Significance
The visual system is often presented with degraded and partial visual information; thus, it must extensively fill in details not present in the physical input. Does the visual system fill in object-specific information as an object’s features change in motion? Here, we show that object-specific features (orientation) can be reconstructed from neural activity in early visual cortex (V1) while objects undergo dynamic transformations. Furthermore, our results suggest that this information is not generated by averaging the physically present stimuli or by mechanisms involved in visual imagery, which also requires internal reconstruction of information not physically present. Our study provides evidence that V1 plays a unique role in dynamic filling-in of integrated visual information during kinetic object transformations via feedback signals.
Keywords: apparent motion, filling-in, dynamic interpolation, feedback, V1
Abstract
As raw sensory data are partial, our visual system extensively fills in missing details, creating enriched percepts based on incomplete bottom-up information. Despite evidence for internally generated representations at early stages of cortical processing, it is not known whether these representations include missing information of dynamically transforming objects. Long-range apparent motion (AM) provides a unique test case because objects in AM can undergo changes both in position and in features. Using fMRI and encoding methods, we found that the “intermediate” orientation of an apparently rotating grating, never presented in the retinal input but interpolated during AM, is reconstructed in population-level, feature-selective tuning responses in the region of early visual cortex (V1) that corresponds to the retinotopic location of the AM path. This neural representation is absent when AM inducers are presented simultaneously and when AM is visually imagined. Our results demonstrate dynamic filling-in in V1 for object features that are interpolated during kinetic transformations.
Contrary to our seamless and unobstructed perception of visual objects, raw sensory data are often partial and impoverished. Thus, our visual system regularly fills in extensive details to create enriched representations of visual objects (1, 2). A growing body of evidence suggests that “filled-in” visual features of an object are represented at early stages of cortical processing where physical input is nonexistent. For example, increased activity in early visual cortex (V1) was found in retinotopic locations corresponding to nonstimulated regions of the visual field during the perception of illusory contours (3, 4) and color filling-in (5). Furthermore, recent functional magnetic resonance imaging (fMRI) studies using multivoxel pattern analysis (MVPA) methods show how regions of V1 lacking stimulus input can contain information regarding objects or scenes presented at other locations in the visual field (6, 7), held in visual working memory (8, 9), or used in mental imagery (10–13).
Although these studies have found evidence for internally generated representations of static stimuli in early cortical processing, the critical question remains of whether and how interpolated visual feature representations are reconstructed in early cortical processing while objects undergo kinetic transformations, a situation that is more prevalent in our day-to-day perception.
To address this question, we examined the phenomenon of long-range apparent motion (AM): when a static stimulus appears at two different locations in succession, a smooth transition of the stimulus across the two locations is perceived (14–16). Previous behavioral studies have shown that subjects perceive illusory representations along the AM trajectory (14, 17) and that these representations can interfere with the perception of physically presented stimuli on the AM path (18–21). In line with this behavioral evidence, it was found that the perception of AM leads to increased blood oxygen level-dependent (BOLD) response in the region of V1 retinotopically mapped to the AM path (22–25), suggesting the involvement of early cortical processing. This activation increase induced by the illusory motion trace was also confirmed in neurophysiological investigations on ferrets and mice using voltage-sensitive dye (VSD) imaging (26, 27). Despite these findings, however, a crucial question about the information content of the AM-induced signal remains unsolved: whether and how visual features of an object engaged in AM are reconstructed in early retinotopic cortex.
Using fMRI and a forward-encoding model (28–31), we examined whether content-specific representations of the intermediate state of a dynamic object engaged in apparent rotation could be reconstructed from the large-scale, population-level, feature-tuning responses in the nonstimulated region of early retinotopic cortex representing the AM path. To dissociate signals linked to high-level interpretations of the stimulus (illusory object features interpolated in motion) from those associated with the bottom-up stimulus input (no retinal input on the path) generating the perception of motion, we used rotational AM, which produces intermediate features that are different from the features of the physically present AM-inducing stimuli (transitional AM). We further probed the nature of such AM-induced feature representations by comparing feature-tuning profiles of the AM path in V1 with those evoked when visually imagining the AM stimuli. Our findings suggest intermediate visual features of dynamic objects, which are not present anywhere in the retinal input, are reconstructed in V1 during kinetic transformations via feedback processing. This result indicates, for the first time to our knowledge, that internally reconstructed representations of dynamic objects in motion are instantiated by retinotopically organized population-level, feature-tuning responses in V1.
Results
Reconstructing Dynamically Interpolated Visual Features During AM.
Does V1 hold interpolated visual information that is not present in the bottom-up input but is dynamically reconstructed as an object’s features change in motion? To address this question, we investigated whether neural activity in V1 can hold reconstructed interpolated feature information of an object engaged in AM. Specifically, using fMRI and a forward-encoding model of orientation (29, 31), we reconstructed population-level, orientation-selective tuning responses in the nonstimulated region of V1 corresponding to the AM path and investigated whether these responses were tuned to the presumed intermediate orientations when viewing apparent rotation.
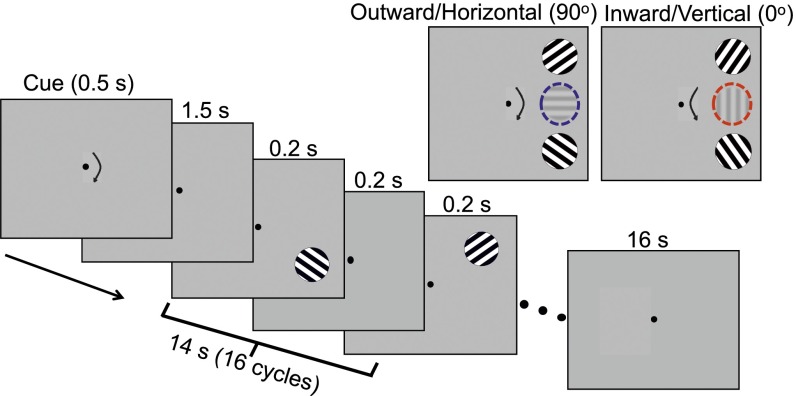
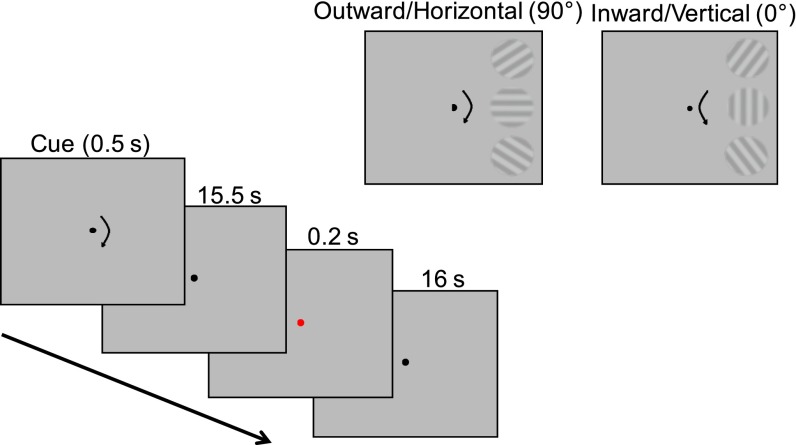
To examine feature-specific representations on the AM path, we induced apparent rotation in the right visual field by alternately presenting two vertically aligned gratings. By tilting the gratings from 45° and 135° by ±10°, we induced two directions of rotation, inward or outward, and subjects were cued to see either direction in a given block (Fig. 1). Critically, with this manipulation, there were two possible intermediate orientations depending on the direction of AM; horizontal (90°) for outward and vertical (0°) for inward rotation. If orientation-selective populations of neurons in V1 reconstruct the intermediate representation during the perception of AM, feature-selective population responses tuned to the presumed intermediate orientations (vertical or horizontal) would be found in the region of V1 corresponding to the AM path.
Fig. 1.
Stimulus procedure for AM. (Inset) Stimuli and presumed intermediate orientation for each AM direction (outward/horizontal, inward/vertical).
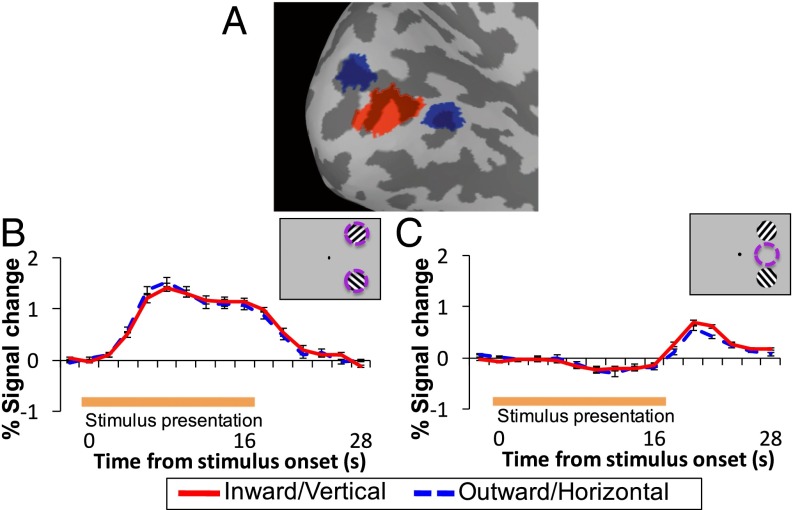
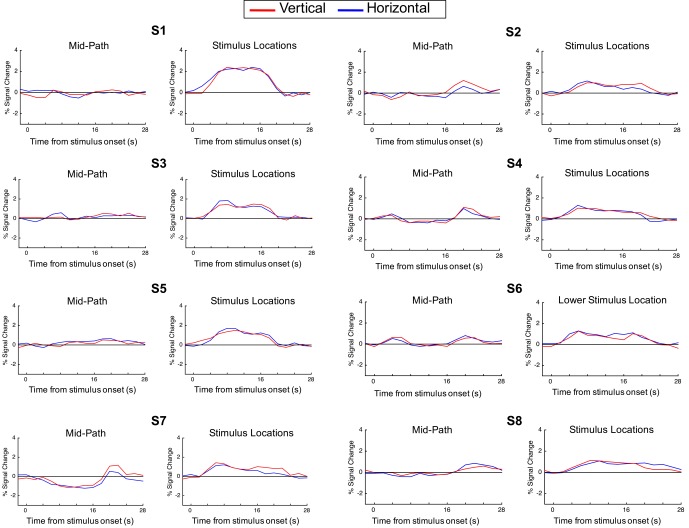
We first assessed the mean amplitude of the BOLD activation for each AM direction, separately for three regions of interest (ROIs) in V1, corresponding to the locations of the stimuli in the upper (Upper-Stim) or lower (Lower-Stim) visual quadrants or the midpoint between the stimuli on the AM path (Fig. 2A). All ROIs were defined based on independent functional localizers and standard retinotopic mapping procedures (32, 33) (SI Materials and Methods). Whereas there was substantial activation in the stimulus location ROIs (Upper-Stim and Lower-Stim) during AM-stimulus presentation (0–16 s) for both vertical and horizontal (Fig. 2B), because of presentation of the stimulus at these locations, activation remained near baseline in the AM-path ROI for both AM directions (Fig. 2C and Fig. S1), because no bottom-up stimulus was presented at this location. For the stimulus locations and AM-path ROI, a repeated-measures analysis of variance (ANOVA) comparing the mean activation during stimulus presentation between vertical and horizontal revealed no effect of AM direction [Upper-Stim: F(1, 6) = 0.021, P = 0.889; Lower-Stim: F(1, 7) = 0.035, P = 0.857; AM path: F(1, 7) = 1.305, P = 0.704]. This finding indicates that any differences found in estimated orientation-tuning responses between vertical and horizontal cannot be attributed to global differences in mean activation.
Fig. 2.
ROIs and mean signal intensity. (A) ROIs on brain surface for the left hemisphere of one subject, corresponding to the AM path (red) and stimulus locations (blue) in V1. (B and C) Mean time course of activation in the stimulus locations (B) and midpoint location (C) for inward/vertical and outward/horizontal AM. Error bars indicate ±SEM for all figures.
Fig. S1.
Mean signal intensity. Mean time course of activation in the AM-path ROI and stimulus location ROIs for inward/vertical and outward/horizontal. Each plot corresponds to an individual subject. Only the Lower-Stim ROI was included in the stimulus-location ROI of subject S6.
Next, we examined our main question of whether population-level, orientation-channel responses in the AM-path ROI are tuned to the interpolated orientations when AM is viewed. To build an encoding model of orientation (29, 31), each subject completed tuning runs in which the subject viewed whole-field gratings in eight different orientations (SI Materials and Methods). Using these data, we generated encoding models for hypothetical orientation channels based on the responses to each orientation for each voxel (validated with a leave-one-run-out procedure; Fig. S2). We then used these models to extract the estimated responses for each orientation channel and reconstruct the population-level, orientation-tuning responses during the experimental conditions, for each ROI separately (Materials and Methods).
Fig. S2.
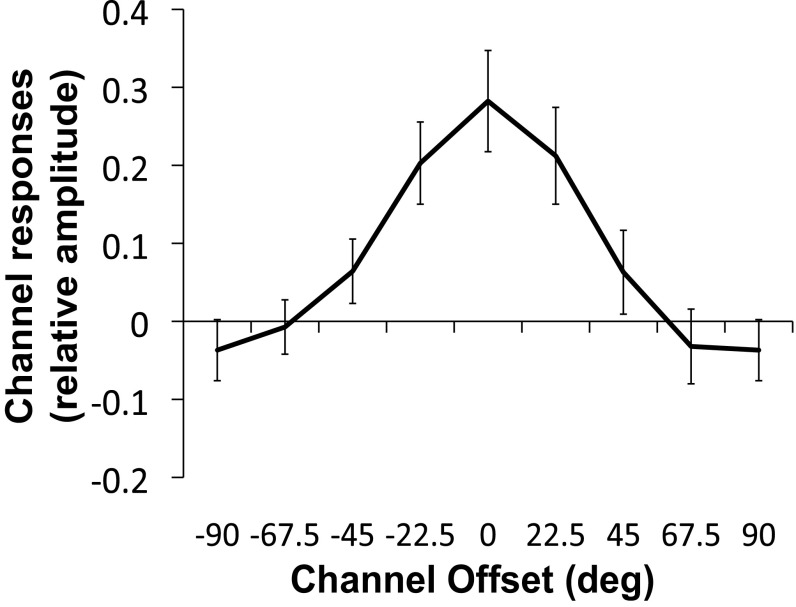
A leave-one-run-out procedure was used on the tuning runs to validate the eight half-cycle sinusoidal basis functions. The plot shows the shifted and averaged orientation-channel outputs, which peak at the presumed orientations.
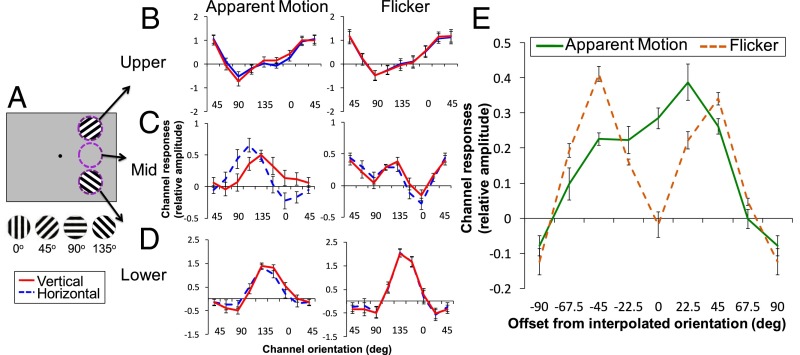
The orientation tuning of the AM-path ROI peaks at 112.5° for the horizontal condition and 135° for the vertical condition (Fig. 3C). An ANOVA comparing channel responses between vertical and horizontal revealed a significant interaction between orientation and AM direction (P = 0.008)* but no effect of AM direction (P = 0.08), indicating no global differences between vertical and horizontal but crucially a shift of tuning toward the presumed intermediate orientation. Paired t tests also confirmed higher responses at channels corresponding to the presupposed interpolated orientations for each AM direction (90° in vertical: P = 0.011; 0° in horizontal: P = 0.016). These tuning responses suggest that when viewing AM, intermediate orientations, not physically present, are interpolated and represented in regions of V1 retinotopic to the AM path. Tuning responses for the intermediate orientations were much degraded in an ROI corresponding to the AM path in V2 (Fig. S3). This finding is consistent with prior studies that found hypothetically weaker pattern of responses for other high-level representations in V2 (refs. 6 and 9 but see ref. 8). The result also suggests an intriguing possibility that V1 has a privileged role in cortical filling-in processes that are required for dynamic transitions of stimuli (Discussion).
Fig. 3.
Orientation-channel outputs in V1. (A) Illustration of the three ROI locations (Upper-Stim, AM path, Lower-Stim). (B–D) Estimated relative BOLD responses across the eight orientation channels in the Upper-Stim (B), AM-path (C), and Lower-Stim (D) ROIs in V1 for inward/vertical (red) and outward/horizontal (blue) during AM (left column) and Flicker (right column). (E) Channel responses of the AM-path ROI during AM and Flicker, shifted to presumed interpolated orientation and averaged across inward/vertical and outward/horizontal conditions.
Fig. S3.
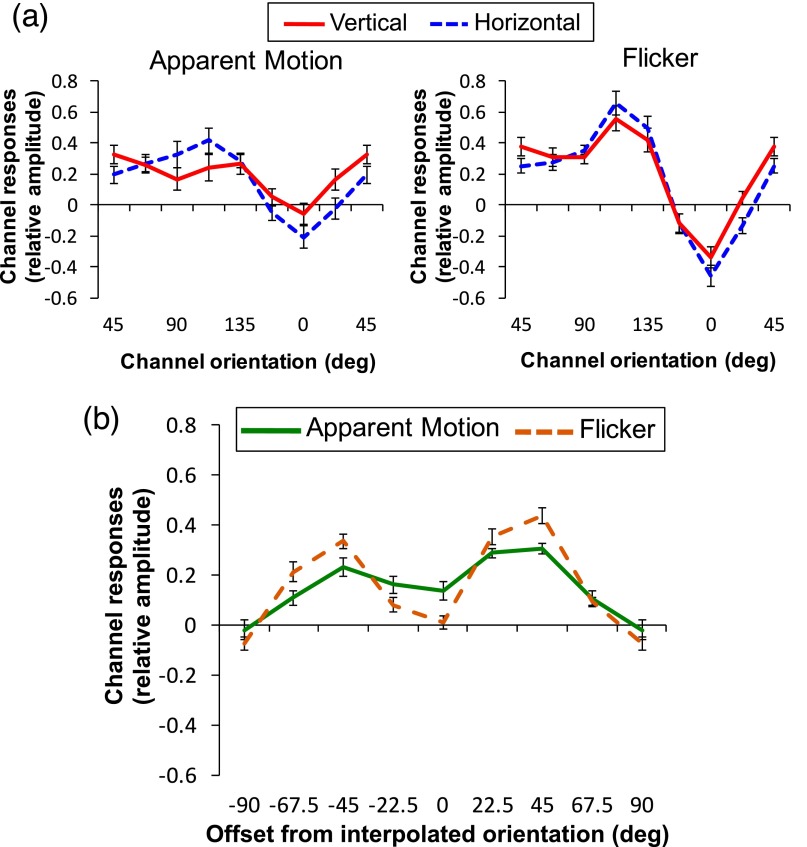
Orientation tuning on the AM path in V2. (A) Orientation-channel outputs of AM-path ROI in V2 during AM (Left) and Flicker (Right). (B) Channel responses, shifted and averaged, for the AM-path ROI in V2.
In the stimulus location ROIs (Upper-Stim and Lower-Stim), the channel responses peak at the orientations closest to the actual orientations of the stimulus gratings (45° for Upper-Stim, 135° for Lower-Stim; Fig. 3 B and D). The tuning curves at the stimulus ROIs are indiscriminable between the vertical and horizontal conditions, likely because of the small difference in the orientation of the presented gratings (20°). For the Upper-Stim ROI, comparison between vertical and horizontal revealed no significant effect of AM direction (P = 0.269), or interaction between AM direction and orientation (P = 0.212). For the Lower-Stim ROI, there was a significant effect of AM direction (P = 0.006), as well as marginally significant interaction between AM direction and orientation (P = 0.06). This effect may be because the extent of the perceived rotation differs slightly from trial to trial; at or near the terminal position, subjects may on occasion perceive incomplete rotation of the stimulus, leading to a representation of the intermediate orientation at the terminal position. Early behavioral studies on AM using stimuli appearing to transform also show inter- and intrasubject variability on the transition points of these illusory feature transformations (17). Note however that the tuning curve for the population response still peaks at 135° regardless of AM direction, suggesting that the terminal stimulus still dominates the response. A paired t test confirmed no significant difference between vertical and horizontal at the stimulus orientation (135°) (P = 0.705).
The pattern of tuning responses on the AM path was also absent in the corresponding location in the nonstimulated left visual field (LVF) (Fig. S4), indicating that the tuning responses found on the AM path is not likely to arise from inherent tuning biases of the AM-path ROI but from perceiving AM.
Fig. S4.
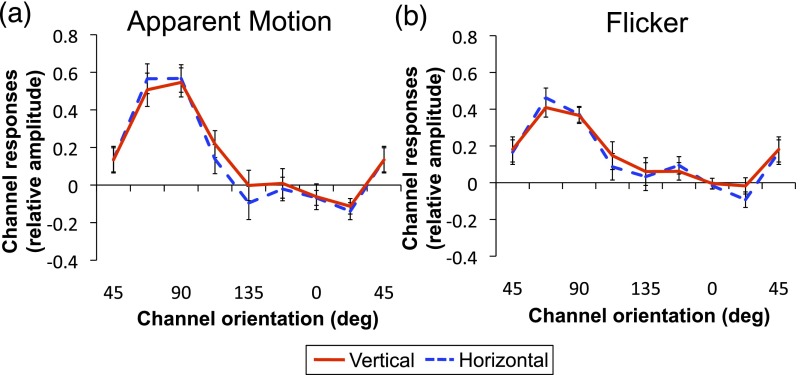
Orientation-channel outputs of LVF control ROI during AM (A) and Flicker (B).
Feature Interpolation Versus Spatial Averaging of Features.
An alternative account of the AM-path orientation responses found during AM is that these responses are not generated by dynamic interpolation of the intermediate features but by spatial averaging of the physically present AM inducers (34). To test this spatial pooling account, we tested whether a similar tuning profile is found when the same two gratings were flashed simultaneously, abolishing the percept of AM. When AM was not perceived between the gratings (Flicker), the tuning curve of the AM-path ROI no longer peaks at the intermediate orientation but instead peaks at the orientations of the stimulus gratings (45° and 135°) in both horizontal and vertical conditions (Fig. 3C). An ANOVA comparing channel responses of the AM-path ROI between stimulus pair condition revealed a marginally significant overall difference between the different pairs of AM inducers (P = 0.059). However, unlike AM, the interaction between condition and orientation did not reach significance (P = 0.118), indicating no significant shift in tuning attributable to stimulus pair. Similar to the AM condition, channel responses for the stimulus location ROIs peak at the orientations of those gratings (45° for Upper-Stim, 135° for Lower-Stim; Fig. 3 B and D). For both ROIs, there was no significant difference between vertical and horizontal at these orientations (Upper: P = 0.472; Lower: P = 0.945).
To assess the degree to which channel responses differed between AM and Flicker for the AM-path ROI, an ANOVA was conducted comparing channel responses between vertical and horizontal in AM and Flicker. This comparison revealed a significant three-way interaction between AM direction, condition, and orientation (P = 0.05), indicating that the shift in tuning depending on AM direction during AM is different from that during Flicker. Next, to further examine whether there is a shift in tuning toward the presumed intermediate orientation during AM compared with Flicker, we centered the tuning curves for each AM direction on the hypothesized peak orientation (90° for horizontal and 0° for vertical) and averaged the channel responses across vertical and horizontal separately for AM and Flicker (Fig. 3E). Whereas responses peak close to the hypothesized orientation for AM, the responses peak at offsets −45° and 45° for Flicker, because of increased channel responses corresponding to the orientations of the stimulus gratings. An ANOVA comparing the channel offset between AM and Flicker revealed a significant effect of orientation (P = 0.006) and a significant interaction between condition and orientation (P = 0.046) but no effect of condition (P = 0.908), indicating differential tuning in AM and Flicker. Subsequent paired t tests confirmed responses at the hypothesized peak (0° offset) were significantly larger in AM compared with Flicker (P = 0.008), and responses at offset −45° were higher for Flicker compared with AM (P = 0.007). These results suggest the same physical stimuli in the absence of AM (Flicker) elicit no feature interpolation but presumably the spreading activity from the stimulus gratings to the midpoint between them (35). This confirms that when perceiving apparent rotation, population activity in V1 corresponding to the AM path represent interpolated orientations not present in the retinal input, and these reconstructed representations are not likely to be generated by spatial averaging of the AM inducers.
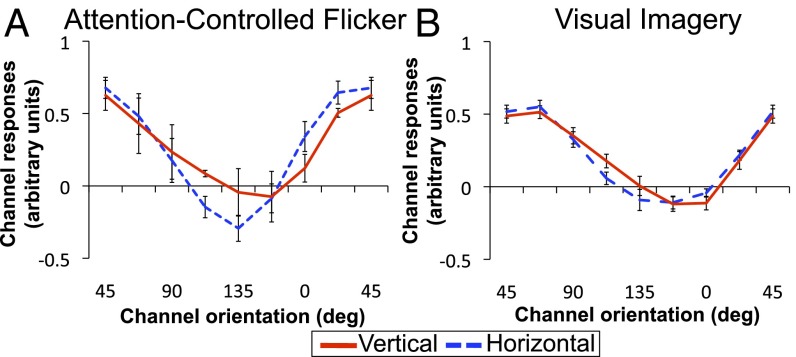
However, another possibility is that the difference between AM and Flicker may be attributable to increased attention on the AM path when viewing AM compared with Flicker, which could potentially facilitate spatial averaging between the gratings. To test this possibility, we examined channel responses for Attention-Controlled Flicker, where the stimuli and procedures were the same as Flicker except subjects monitored for a cross that was briefly presented between the inducers during stimulus presentation to ensure the subjects’ continuous attention to the spatial locations between the gratings (Materials and Methods). Orientation-channel responses for Attention-Controlled Flicker peak at 45° for the AM-path ROI for both horizontal and vertical, exhibiting no tuning for the hypothesized intermediate orientation (Fig. 4A). An ANOVA comparing original Flicker and Attention-Controlled Flicker showed no effect of condition (P = 0.082) or interaction between condition and orientation (P = 0.591). Paired t tests confirmed no significant differences between original and Attention-Controlled Flicker at any orientation channel [including −45° (P = 0.827) and 45° (P = 0.533)]. Thus, differences in tuning between AM and original Flicker cannot be accounted for by varying degrees of attention across tasks.
Fig. 4.
Orientation-channel outputs of the AM-path ROI during Attention-Controlled Flicker (A) and Visual Imagery (B).
Feature Tuning Induced by AM and Visual Imagery.
Earlier fMRI research on visual imagery suggests that early visual areas, including V1, are activated through imagery (11, 13, 36), and more recent studies using MVPA have found stimulus feature information in V1 in response to imagined orientation (10) or complex images (12). Although visual imagery is involved in generating representations from long-term memory and AM is involved in interpolating features from immediate perception, both imagery and AM involve internally generated representations in V1 via top-down processes. To address the relation of AM to visual imagery, we compared orientation tuning elicited by actual AM with tuning obtained when the same AM is imagined without any physical stimuli. In Visual Imagery runs, subjects did not view but instead only imagined the same stimuli used in AM relative to a cue at the beginning of each block (Fig. S5). If visually imagining AM without actually viewing it yields similar orientation tuning for the intermediate orientation, this finding would suggest a possibility that the processes involved in imagery may also contribute to the interpolation process in AM.
Fig. S5.
Stimulus procedure for Visual Imagery. (Inset) Hypothesized orientations for illustrative purpose only. (No stimuli were shown to subjects in Visual Imagery.)
Contrary to this prediction, tuning for the intermediate orientation was not found during imagery. Instead, channel responses for the AM-path ROI peaked at 67.5° for both horizontal and vertical (Fig. 4B), indicating that orientation tuning for the presumed intermediate orientation is substantially degraded when generated entirely by imagery. Unlike tuning responses induced by AM, neither a significant effect of AM direction (P = 0.922) nor an interaction between orientation and AM direction (P = 0.756) was found. Whereas feature interpolation during AM elicits population-scale tuning profiles, feature representations during visual imagery elicit only a seemingly uninformative signal in the same population of neurons. This result indicates that visual imagery alone may not be sufficient to elicit similar tuning responses to those evoked by AM for interpolated features.
SI Materials and Methods
Tuning Runs.
To construct a forward-encoding model of orientation (29, 31), subjects were scanned on 10 model estimation runs in which a whole-field, full-contrast gray-scale sinusoidal grating (0.5 cpd) was flickered at 2 Hz in one of eight possible orientations (covering 180° in steps of 22.5°) for 12 s. Each run contained three blocks per stimulus orientation. On each presentation, the spatial phase of the grating was randomly selected from four possible phases to attenuate the perception of AM (9). The grating had a diameter of 24°, with a small circular aperture removed around fixation (2.5° radius). The order of orientations was randomized on each scan with the constraint that the same orientation would not be presented on successive trials. Subjects responded to an occasional contrast reduction in the grating (21% of the trials).
Identifying ROIs.
In addition to the main experimental runs, all subjects were scanned with retinotopic mapping and a visual field localizer to map the ROIs in retinotopic visual cortex. ROIs were defined for the stimulus locations and AM path in the right visual field, as well as the horizontal meridian in the LVF, where no stimuli were presented to allow for a controlled comparison region. First, ROIs were identified separately in each subject using visual-field localizer runs in which subjects monitored a central fixation dot for an occasional color change while square checkerboard patterns flickering at 8 Hz were presented either at the stimulus locations (4.5° × 4.5°), at the midpoint between the centers of the stimulus locations on the right and mirrored on the left (4.5° height, 9° width), or in an aperture around fixation (1° radius), for 16 s, followed by a 16-s blank fixation. Each ROI was defined by the conjunction of direct comparisons of the response to one condition versus each of the others (false-discovery rate: q < 0.001). There were three blocks per condition per run, and two runs were acquired per subject. The retinotopic ROIs were separated into V1 and V2 using retinotopic maps derived from standard phase-mapping procedures (32) (five subjects) or meridian mapping with counterphase flashing horizontal and vertical bowtie-shaped checkerboards (33) (three subjects). One subject’s V1 Upper-Stim ROI was excluded from analysis because of its small number of voxels. The average ROI sizes in V1 were 39 voxels (SEM: 4.8) for the Upper-Stim location, 63 voxels (SEM: 12.6) for the Lower-Stim location, 131 voxels (SEM: 8.7) for the AM path, and 169 voxels (SEM: 18.2) for the LVF control. The average size of the AM-path ROI in V2 was 134 voxels (SEM: 25.5).
Statistical Significance Using Permutation Procedure.
Because our eight basis (half-cycle sinusoid) functions were not independent, the assumption of independence when comparing the channel responses across conditions was violated. To evaluate the significance of the reported effects, we first obtained a P value from a standard t test or ANOVA. Next, we randomly permuted orientation labels of the tuning data and the forward model was built using this data. Then, we randomly permuted the condition labels in the main experimental data and conducted the same statistical analysis on this relabeled dataset. We repeated this 10,000 times to generate a distribution of P values and found the probability of obtaining the original P value given this distribution (31). The P values reported reflect this probability.
Discussion
Here, we demonstrate that representations of features, which are absent in the retinal input but are interpolated during dynamic object transitions, can be reconstructed in population-scale feature responses in V1. Tuning profiles in areas of V1 retinotopically mapped to the AM path revealed selectivity for the internally reconstructed orientation during apparent rotation. Furthermore, no such tuning was found when the same gratings were presented simultaneously (Flicker), ruling out the alternative account that the orientation tuning observed during AM is generated by spatial averaging of the AM inducers. The same Flicker stimuli with subjects’ attention directed between the two gratings similarly did not yield the same tuning responses as AM. These results confirm that the population tuning for interpolated orientations found during AM is specific to perceiving AM.
V1 has traditionally been viewed as a site for processing rudimentary, local visual features. However, there is increasing evidence that a wide variety of high-level information is also represented in V1, suggesting that neural activity in V1 reflects feedback or top-down influence from high-level cortical areas (4–7). Consistently, our study showed that visual features that are absent but inferred from the physical stimulus can be represented in V1. However, although our study is in line with this earlier work, our study is also distinct in several key respects.
First, our study involves the visual inference of stimulus features that are not actually present anywhere in the retinal input. This may be distinguished from the filling-in of information that was presented at other locations in the visual field (5–7) or maintaining representations of stimuli that were presented but are no longer in view (8–10). These representations may also differ from other types of AM attributed to lateral V1 connectivity (37), which do not involve integration and interpolation of changes in form and motion over large spatial distances. Unlike such studies, our experimental manipulation allows us to exclude the possibility of local neuronal activity underlying the formation of content-specific representations in early cortical processing. Whereas lateral interactions within V1, mediated by horizontal connections, can contribute to previously reported cortical filling-in (6, 38–41), such local interactions in V1 are unlikely to explain the intermediate orientation representations reconstructed during the translational and rotational AM in our study. First, the distance between two stimulus gratings (6.5°) exceeds the spatial range suggested for monosynaptic horizontal connections (38). More importantly, the interpolated orientations on the AM path are different from the orientation of either AM-inducing grating that is physically presented. Hence, tuning for this interpolated representation is unlikely to be a direct result of lateral input from remote neurons activated by the AM inducers. In the case of working memory representations in V1, one possible mechanism is a continuation of activity in the neural populations that originally responded to the stimulus perceptually (8, 9). This explanation is also unlikely to account for our results because the interpolated orientations in our study were never presented in the bottom-up input.
Our finding is more consistent with long-range feedback from higher-order visual areas. Higher-order cortical regions specialize in different aspects of the sensory input, and V1 is reciprocally connected to these expert visual modules either directly or indirectly (42, 43). The predictive-coding theory of vision suggests that V1 does not just produce the results of local visual feature analysis but instead can serve as a high-resolution buffer that integrates bottom-up sensory input and top-down predictive signals (44–46). Under this framework, higher-level visual areas project predictions about sensory input to V1, and these internally generated predictions are compared with the externally generated signal. We found feature information that was perceived by observers but was not explicitly present in the sensory signal, confirming the presence of predictive signals that carry representations of expected as opposed to actual input.
Another key distinction of our study is that, unlike former work using static stimuli, we examined dynamic visual representations that require the integration of both form and motion information. Previous demonstrations of cortical filling-in in V1, such as translational AM (23) or representations of working memory and image context (6, 8, 9) focus on either spatiotemporal motion information or object featural information only. However, objects in motion are often accompanied by changes in form (e.g., rotation), requiring the visual system to integrate spatiotemporal motion and object-specific feature information, and our study asks whether this class of dynamic percepts can be reconstructed based on sparse sensory input using the phenomenon of transitional AM where objects appear to change both in their position and in their features (orientation).
Prior fMRI research using translational AM found that AM leads to increased BOLD response in the region of V1 corresponding to the AM path (22, 23, 25). Receptive field (RF) sizes in early visual areas, particularly V1, are too small to account for interactions between the AM inducers in long-range AM (37, 39). Thus, later studies using electroencephalography (EEG), dynamic causal modeling with fMRI, and optical imaging on ferrets proposed this AM-induced BOLD signal in V1 is driven by feedback from higher-order visual areas with larger RF sizes, such as motion-processing area human middle temporal complex (hMT+)/V5 (24, 26, 47). Furthermore, disruption of these signals in V5 via transcranial magnetic stimulation was recently shown to affect the AM percept (48).
Despite these findings, the representational content of the AM-induced signal in V1 and the cortical feedback mechanisms required for the reconstruction of feature information in dynamic transitions remained largely unknown. Specifically, it was not clear in this earlier work whether the AM-induced activation reflected spatiotemporal motion signals alone or contained information about features of the objects engaged in AM. The latter possibility is suggested by behavioral evidence showing feature-specific impairment of target detection on the AM path (18, 19). The results of the present study provide the first neuroimaging evidence to our knowledge for the neural reconstruction of interpolated object features on the AM path in V1, which should involve information not only from dorsal (motion) but also from ventral (object feature) processing streams.
Because the perception of AM in the present study requires the integration of motion and shape information, the suggested role of feedback from hMT+/V5 outlined above does not provide a sufficient explanation of our findings. Given abundant feedback connections from the ventral visual stream to V1, including projections from V4 and the inferotemporal cortex (49, 50), we hypothesize that object-specific featural information fed back from these high-level ventral areas, such as V4 and the lateral occipital complex (LOC) to V1, may also play a critical role in reconstructing dynamic visual representation in V1 during transitional AM (51). Object form and motion information can be integrated through interactions between multiple regions of visual cortex, including recurrent reciprocal interactions between high-level visual areas processing form or motion. Considering the unique status of V1 as a high-resolution, integrating buffer and the need to process form relationships and motion trajectories to perceive transitional AM, our study suggests an alternative possibility that motion and feature information from dorsal and ventral streams are separately fed back to V1, where these sets of information are combined. Transitional AM provides an ideal stimulus to further investigate the mechanisms underlying the interpolation of integrated visual information in future research.
The interpolated AM percept might be generated by mental imagery processes, which have also been argued to involve predictive coding (10, 12). However, in our study, when AM was purely imagined without AM inducers, tuning responses appear to be largely absent. Although the precise mechanisms underlying visual imagery and its relation to other top-down processes remain to be examined (10, 12, 36), these results suggest that AM may either involve different underlying neural mechanisms from imagery or induce a different magnitude of responses from a common or partially shared mechanism.
It is worth noting that even though the level of mean activation in the AM-path ROI remains near baseline when perceiving AM, reliable population tuning responses for the interpolated orientation were still found. Recent VSD imaging studies demonstrate that subthreshold cortical activity in ferret area 17, cat area 18, and in mouse V1 could contribute to the perception of AM and other types of illusory motion (26, 27, 39). The signals measured with VSD imaging likely reflect synchronized, subthreshold synaptic activity that can lead to observable local field potentials (LFPs), which are known to correlate with fMRI signals (38, 52). If interpolated features during AM are reconstructed through this synaptic activity along retinotopically organized populations of orientation-selective neurons in V1 representing the AM path, fMRI reflecting LFPs is well suited for measuring such neural responses in V1.
In sum, these results provide novel evidence that object-specific representations can be interpolated and reconstructed in population-scale feature tuning in V1 when an object transforms in motion. This finding is consistent with the predictive coding theory that V1 can hold visual information that is not physically present but is spatiotemporally filled-in to sustain our perceptual interpretations of dynamic visual objects via predictive signals from higher cortical areas. By examining how visual features of an object that are interpolated during dynamic transitions, are represented in large-scale, feature-selective responses in V1, this study provides clues on the role of V1 in generating dynamic object representations based on both motion and shape information via feedback processes.
Materials and Methods
Subjects.
Nine subjects were recruited from Dartmouth College, and one was excluded because of incompletion of the experiment. All subjects gave informed consent (approved by Dartmouth Committee for the Protection of Human Subjects) and were financially compensated for their time.
AM and Flicker.
All stimuli were created and presented with MATLAB using Psychophysics Toolbox (53, 54). Each subject completed two sessions: one for the AM condition and one for the control condition (Flicker). In the AM session, subjects viewed alternating presentations of a full-contrast sinusoidal grating at the upper and lower right corners in the right visual field [2.5° radius, 9° eccentricity, 0.9 cycles per degree (cpd)]. To bias the subject to view one of two directions of rotation (outward or inward), we used slightly different orientation pairs (55° and 125° for outward, 35° and 145° for inward). The different perceived directions of rotation led to different intermediate orientations on the AM path: horizontal (90°) for outward and vertical (0°) for inward rotation (Fig. 1, Inset). Each subject received practice trials before the start of the session until the subject could view either direction at will. Subjects fixated at the center of the screen throughout the experiment. At the beginning of each block, one of two arrow cues was briefly presented (0.5 s) to indicate the intended direction of AM. The cue was followed by 1.5 s of fixation and then 14 s of AM in which the two gratings were successively presented for 0.2 s with a 0.2-s interstimulus interval (ISI). Each block was followed by a 16-s blank fixation period. Subjects reported the perceived direction of rotation throughout blocks, and blocks in which subjects’ perceived direction of AM was unstable or different from the cued direction were excluded from analysis (average: 4% per subject).
The same stimuli were used in the second session (Flicker), except that gratings were flashed simultaneously instead of sequentially, at the same rate as AM (ISI: 0.2 s). This abolished the percept of AM. The same arrow cues were used with the specific grating pairs corresponding to outward and inward rotation in AM. Subjects reported which cue was presented, and blocks with incorrect responses were excluded from analysis (average: 1% per subject). Both sessions consisted of eight runs, each including three blocks per condition (AM: inward vs. outward; Flicker: inward inducers vs. outward inducers) for a total of six blocks per run. The order of blocks was randomized for each subject. Each session additionally contained five tuning runs (see Forward Model), interleaved with the eight main experimental runs.
Attention-Controlled Flicker.
To examine possible influences of attention on the neural responses found in the Flicker condition, five of the subjects completed an additional session of six runs of Attention-Controlled Flicker. The design was identical to the original Flicker except that in 22% of the trials, a cross appeared at any location on the AM path. Subjects reported whether the vertical or horizontal arm was longer (average accuracy: 93%). Blocks in which a cross appeared were excluded from analysis.
Visual Imagery.
The Visual Imagery experiment was the same as the AM experiment, except that instead of viewing the AM-inducing gratings, subjects visually imagined the AM stimulus while centrally fixating. During 16-s blocks, subjects imagined outward or inward apparent rotation of the same gratings used in the AM session corresponding to the cue at the beginning of each block. The end of the block was marked by a brief change in the color of the fixation dot. To ensure attention to the spatial locations that correspond to the AM path, subjects performed the same cross-task as in Attention-Controlled Flicker (average accuracy: 72%). Blocks in which subjects did not imagine the intended direction of AM (average: 2%) or a cross appeared were excluded from analysis. Each subject completed six runs, each consisting of three blocks per AM direction (inward vs. outward). The order of AM directions was randomized per subject.
fMRI Scanning and Data Analysis.
fMRI scanning was conducted on a 3T scanner (Philips Achieva) at the Dartmouth Brain Imaging Center at Dartmouth College, using a 32-channel head coil. For each subject, anatomical scans were obtained using a high-resolution T1-weighted magnetization-prepared rapid gradient-echo sequence (1 × 1 × 1 mm). Functional runs were obtained with a gradient-echo echo-planar imaging (EPI) sequence (repetition time: 2 s; echo time: 30 ms; field of view: 250 × 250 mm; voxel size: 2 × 2 × 1.5 mm; 0.5-mm gap; flip angle: 70°; 25 transverse slices, approximately aligned to the calcarine sulcus). fMRI data analysis was conducted using AFNI (55) and in-house Python scripts. Data were preprocessed to correct for head motion. To account for different distances from the radio-frequency coil, each voxel’s time series was divided by its mean intensity. To remove low-frequency drift, the data were then high pass-filtered (cutoff frequency of 0.01 Hz) on a voxel-wise basis. Only the localizer data were smoothed with a 4-mm full-width at half-maximum Gaussian kernel. Forward-encoding analysis was conducted on unsmoothed data to retain the highest level of spatial resolution available. The cortical surface of each subject’s brain was reconstructed with FreeSurfer (56).
Forward Model.
To construct a forward model, we used data from the tuning runs (SI Materials and Methods) to model each voxel’s orientation selectivity as a weighted sum of eight hypothetical orientation channels, each with an idealized orientation tuning curve (a sinusoid raised to the fifth power and centered around one of the eight orientations). Following Brouwer and Heeger (29), let m be the number of voxels, n be the number of runs × conditions, and k be the number of orientation channels. Ten tuning runs comprised the dataset for model estimation (m × n matrix B1). To maximize the signal-to-noise ratio of channel responses, we selected the top 50% of voxels within each ROI that could best discriminate the different orientations in the tuning runs (the top 50% of voxels with highest F statistic in ANOVA of response amplitudes in tuning runs) (31).
After preprocessing, β coefficients of each voxel in the ROIs were estimated using a generalized linear model (GLM) analysis that included a linear baseline fit and motion parameters as covariates of no interest; β coefficients for stimulus blocks, extracted per condition, per run, were used as voxel responses. β coefficients were mapped onto the full rank matrix of channel outputs (C1, k × n), by the weight matrix W (m × k), estimated using a GLM:
| [1] |
The ordinary least-squares estimate of W is computed as follows:
| [2] |
Finally, the channel responses (C2) associated with AM and the control experiments were estimated using the weights obtained from Eq. 2:
| [3] |
To validate the model in accounting for orientation tuning, a leave-one-run-out procedure was performed on the tuning runs.
SI Results
Orientation-Channel Responses on the AM Path in V2.
Inspecting the channel outputs for an ROI corresponding to the AM path in V2, we found that whereas tuning for both vertical and horizontal conditions peak at 112.5° for Flicker, channel responses are tuned to 112.5° for horizontal and to 45° for vertical during AM (Fig. S3A). After averaging across vertical and horizontal for AM and Flicker, responses for both Flicker and AM peak at offsets of −45° and 45° (Fig. S3B). An ANOVA comparing channel responses between AM and Flicker showed neither an effect of condition (P = 0.510) nor an interaction between condition and orientation (P = 0.406). Paired t tests also revealed no significant difference between AM and Flicker at the hypothesized intermediate channel (P = 0.335). There are several possible accounts for this lack of tuning in V2 for interpolated orientations in AM. This result is consistent with prior studies that found successful classification of activation patterns in nonstimulated regions in V1 but weaker results in V2. Serences et al. (9) classified the orientation of a grating held in working memory and found above-chance classification only in V1 (but see ref. 8). Also, activation patterns in V1 retinotopic to occluded regions of images were reported to better classify which image was shown in the other quadrants compared with those in V2 (6). Thus, it is possible that neither multivoxel pattern-decoding nor forward-encoding methods were able to discriminate the hypothetically weaker pattern of responses for such high-level representations in V2. On the other hand, a more intriguing possibility, not mutually exclusive with the above, is that V1 has a privileged role in cortical filling-in processes that are required for dynamic transitions of stimuli. Interaction between dorsal and ventral streams of visual processing, combining motion information from the former with object feature information from the latter, required for perceiving AM may occur in V1 via feedback from higher cortical areas to V1 (Discussion).
Orientation-Channel Responses in a Control ROI.
To allow for a retinotopically comparable control region, we looked at orientation-selective responses for an ROI corresponding to the AM path mirrored on the LVF, where no stimuli were presented (LVF control). During AM, channel responses for the LVF control ROI peak at the 90° channel regardless of AM direction (Fig. S4). The AM tuning curves are largely different in shape compared with those found in the right visual field AM-path ROI. Comparing the averaged AM tuning between left and right visual field ROIs revealed no effect of visual field (P = 0.870) but a significant interaction between visual field and orientation (P = 0.010), indicating differential tuning responses in LVF control and RVF AM-path ROI. The results for the LVF control ROI are likely attributable to radial bias of neurons along the horizontal meridian that preferably respond to the 90° orientation (57, 58). Hence, the pattern of responses found on the original AM-path ROI is not likely to arise from inherent tuning biases but from perceiving AM.
Acknowledgments
We thank George Wolford and John Serences for their helpful feedback on the statistical analyses as well as Patrick Cavanagh for his beneficial feedback on the manuscript.
Footnotes
The authors declare no conflict of interest.
This article is a PNAS Direct Submission.
See Commentary on page 1124.
*Our eight basis functions were not independent; thus, all reported P values reflect the probability of obtaining the original P value of a standard statistical test from the distribution of P values of 10,000 randomized datasets (SI Materials and Methods).
This article contains supporting information online at www.pnas.org/lookup/suppl/doi:10.1073/pnas.1512144113/-/DCSupplemental.
References
- 1.Komatsu H. The neural mechanisms of perceptual filling-in. Nat Rev Neurosci. 2006;7(3):220–231. doi: 10.1038/nrn1869. [DOI] [PubMed] [Google Scholar]
- 2.Pessoa L, De Weerd P. In: Filling-In: From Perceptual Completion to Cortical Reorganization. Pessoa L, De Weerd P, editors. Oxford University Press; New York: 2003. [Google Scholar]
- 3.Grosof DH, Shapley RM, Hawken MJ. Macaque V1 neurons can signal ‘illusory’ contours. Nature. 1993;365(6446):550–552. doi: 10.1038/365550a0. [DOI] [PubMed] [Google Scholar]
- 4.Lee TS, Nguyen M. Dynamics of subjective contour formation in the early visual cortex. Proc Natl Acad Sci USA. 2001;98(4):1907–1911. doi: 10.1073/pnas.031579998. [DOI] [PMC free article] [PubMed] [Google Scholar]
- 5.Sasaki Y, Watanabe T. The primary visual cortex fills in color. Proc Natl Acad Sci USA. 2004;101(52):18251–18256. doi: 10.1073/pnas.0406293102. [DOI] [PMC free article] [PubMed] [Google Scholar]
- 6.Smith FW, Muckli L. Nonstimulated early visual areas carry information about surrounding context. Proc Natl Acad Sci USA. 2010;107(46):20099–20103. doi: 10.1073/pnas.1000233107. [DOI] [PMC free article] [PubMed] [Google Scholar]
- 7.Williams MA, et al. Feedback of visual object information to foveal retinotopic cortex. Nat Neurosci. 2008;11(12):1439–1445. doi: 10.1038/nn.2218. [DOI] [PMC free article] [PubMed] [Google Scholar]
- 8.Harrison SA, Tong F. Decoding reveals the contents of visual working memory in early visual areas. Nature. 2009;458(7238):632–635. doi: 10.1038/nature07832. [DOI] [PMC free article] [PubMed] [Google Scholar]
- 9.Serences JT, Ester EF, Vogel EK, Awh E. Stimulus-specific delay activity in human primary visual cortex. Psychol Sci. 2009;20(2):207–214. doi: 10.1111/j.1467-9280.2009.02276.x. [DOI] [PMC free article] [PubMed] [Google Scholar]
- 10.Albers AM, Kok P, Toni I, Dijkerman HC, de Lange FP. Shared representations for working memory and mental imagery in early visual cortex. Curr Biol. 2013;23(15):1427–1431. doi: 10.1016/j.cub.2013.05.065. [DOI] [PubMed] [Google Scholar]
- 11.Cichy RM, Heinzle J, Haynes JD. Imagery and perception share cortical representations of content and location. Cereb Cortex. 2012;22(2):372–380. doi: 10.1093/cercor/bhr106. [DOI] [PubMed] [Google Scholar]
- 12.Naselaris T, Olman CA, Stansbury DE, Ugurbil K, Gallant JL. A voxel-wise encoding model for early visual areas decodes mental images of remembered scenes. Neuroimage. 2015;105:215–228. doi: 10.1016/j.neuroimage.2014.10.018. [DOI] [PMC free article] [PubMed] [Google Scholar]
- 13.Stokes M, Thompson R, Cusack R, Duncan J. Top-down activation of shape-specific population codes in visual cortex during mental imagery. J Neurosci. 2009;29(5):1565–1572. doi: 10.1523/JNEUROSCI.4657-08.2009. [DOI] [PMC free article] [PubMed] [Google Scholar]
- 14.Kolers PA. Aspects Of Motion Perception. Pergamon; Oxford: 1972. [Google Scholar]
- 15.Korte A. Kinematoskopische Untersuchungen. Z Psychol. 1915;72:194–296. [Google Scholar]
- 16.Werthemier M. Experimentelle Studien über das Sehen von Bewegung. Z Psychol Physiol d Sinnesorg. 1912;61:161–265. [Google Scholar]
- 17.Kolers PA, von Grünau M. Shape and color in apparent motion. Vision Res. 1976;16(4):329–335. doi: 10.1016/0042-6989(76)90192-9. [DOI] [PubMed] [Google Scholar]
- 18.Chong E, Hong SW, Shim WM. Color updating on the apparent motion path. J Vis. 2014;14(14):8. doi: 10.1167/14.14.8. [DOI] [PubMed] [Google Scholar]
- 19.Hidaka S, Nagai M, Sekuler AB, Bennett PJ, Gyoba J. Inhibition of target detection in apparent motion trajectory. J Vis. 2011;11(10):1–12. doi: 10.1167/11.10.2. [DOI] [PubMed] [Google Scholar]
- 20.Schwiedrzik CM, Alink A, Kohler A, Singer W, Muckli L. A spatio-temporal interaction on the apparent motion trace. Vision Res. 2007;47(28):3424–3433. doi: 10.1016/j.visres.2007.10.004. [DOI] [PubMed] [Google Scholar]
- 21.Yantis S, Nakama T. Visual interactions in the path of apparent motion. Nat Neurosci. 1998;1(6):508–512. doi: 10.1038/2226. [DOI] [PubMed] [Google Scholar]
- 22.Larsen A, Madsen KH, Lund TE, Bundesen C. Images of illusory motion in primary visual cortex. J Cogn Neurosci. 2006;18(7):1174–1180. doi: 10.1162/jocn.2006.18.7.1174. [DOI] [PubMed] [Google Scholar]
- 23.Muckli L, Kohler A, Kriegeskorte N, Singer W. Primary visual cortex activity along the apparent-motion trace reflects illusory perception. PLoS Biol. 2005;3(8):1501–1510. doi: 10.1371/journal.pbio.0030265. [DOI] [PMC free article] [PubMed] [Google Scholar]
- 24.Sterzer P, Haynes JD, Rees G. Primary visual cortex activation on the path of apparent motion is mediated by feedback from hMT+/V5. Neuroimage. 2006;32(3):1308–1316. doi: 10.1016/j.neuroimage.2006.05.029. [DOI] [PubMed] [Google Scholar]
- 25.Liu T, Slotnick SD, Yantis S. Human MT+ mediates perceptual filling-in during apparent motion. Neuroimage. 2004;21(4):1772–1780. doi: 10.1016/j.neuroimage.2003.12.025. [DOI] [PubMed] [Google Scholar]
- 26.Ahmed B, et al. Cortical dynamics subserving visual apparent motion. Cereb Cortex. 2008;18(12):2796–2810. doi: 10.1093/cercor/bhn038. [DOI] [PMC free article] [PubMed] [Google Scholar]
- 27.Zhang QF, et al. Priming with real motion biases visual cortical response to bistable apparent motion. Proc Natl Acad Sci USA. 2012;109(50):20691–20696. doi: 10.1073/pnas.1218654109. [DOI] [PMC free article] [PubMed] [Google Scholar]
- 28.Brouwer GJ, Heeger DJ. Decoding and reconstructing color from responses in human visual cortex. J Neurosci. 2009;29(44):13992–14003. doi: 10.1523/JNEUROSCI.3577-09.2009. [DOI] [PMC free article] [PubMed] [Google Scholar]
- 29.Brouwer GJ, Heeger DJ. Cross-orientation suppression in human visual cortex. J Neurophysiol. 2011;106(5):2108–2119. doi: 10.1152/jn.00540.2011. [DOI] [PMC free article] [PubMed] [Google Scholar]
- 30.Naselaris T, Prenger RJ, Kay KN, Oliver M, Gallant JL. Bayesian reconstruction of natural images from human brain activity. Neuron. 2009;63(6):902–915. doi: 10.1016/j.neuron.2009.09.006. [DOI] [PMC free article] [PubMed] [Google Scholar]
- 31.Scolari M, Byers A, Serences JT. Optimal deployment of attentional gain during fine discriminations. J Neurosci. 2012;32(22):7723–7733. doi: 10.1523/JNEUROSCI.5558-11.2012. [DOI] [PMC free article] [PubMed] [Google Scholar]
- 32.Sereno MI, et al. Borders of multiple visual areas in humans revealed by functional magnetic resonance imaging. Science. 1995;268(5212):889–893. doi: 10.1126/science.7754376. [DOI] [PubMed] [Google Scholar]
- 33.Shim WM, Alvarez GA, Vickery TJ, Jiang YV. The number of attentional foci and their precision are dissociated in the posterior parietal cortex. Cereb Cortex. 2010;20(6):1341–1349. doi: 10.1093/cercor/bhp197. [DOI] [PMC free article] [PubMed] [Google Scholar]
- 34.Dakin SC, Watt RJ. The computation of orientation statistics from visual texture. Vision Res. 1997;37(22):3181–3192. doi: 10.1016/s0042-6989(97)00133-8. [DOI] [PubMed] [Google Scholar]
- 35.Chavane F, et al. Lateral spread of orientation selectivity in V1 is controlled by intracortical cooperativity. Front Syst Neurosci. 2011;5(4):4. doi: 10.3389/fnsys.2011.00004. [DOI] [PMC free article] [PubMed] [Google Scholar]
- 36.Kosslyn SM, Ganis G, Thompson WL. Neural foundations of imagery. Nat Rev Neurosci. 2001;2(9):635–642. doi: 10.1038/35090055. [DOI] [PubMed] [Google Scholar]
- 37.Georges S, Seriès P, Frégnac Y, Lorenceau J. Orientation dependent modulation of apparent speed: Psychophysical evidence. Vision Res. 2002;42(25):2757–2772. doi: 10.1016/s0042-6989(02)00303-6. [DOI] [PubMed] [Google Scholar]
- 38.Angelucci A, et al. Circuits for local and global signal integration in primary visual cortex. J Neurosci. 2002;22(19):8633–8646. doi: 10.1523/JNEUROSCI.22-19-08633.2002. [DOI] [PMC free article] [PubMed] [Google Scholar]
- 39.Gilbert CD, Li W. Top-down influences on visual processing. Nat Rev Neurosci. 2013;14(5):350–363. doi: 10.1038/nrn3476. [DOI] [PMC free article] [PubMed] [Google Scholar]
- 40.Jancke D, Chavane F, Naaman S, Grinvald A. Imaging cortical correlates of illusion in early visual cortex. Nature. 2004;428(6981):423–426. doi: 10.1038/nature02396. [DOI] [PubMed] [Google Scholar]
- 41.Stettler DD, Das A, Bennett J, Gilbert CD. Lateral connectivity and contextual interactions in macaque primary visual cortex. Neuron. 2002;36(4):739–750. doi: 10.1016/s0896-6273(02)01029-2. [DOI] [PubMed] [Google Scholar]
- 42.Bullier J. What is Fed Back? 23 Problems. In: van Hemmen JL, Sejnowski T, editors. Systems Neuroscience. Oxford Univ Press; New York: 2006. pp. 103–134. [Google Scholar]
- 43.Ungerleider LG, Desimone R. Cortical connections of visual area MT in the macaque. J Comp Neurol. 1986;248(2):190–222. doi: 10.1002/cne.902480204. [DOI] [PubMed] [Google Scholar]
- 44.Lee TS, Mumford D. Hierarchical Bayesian inference in the visual cortex. J Opt Soc Am A Opt Image Sci Vis. 2003;20(7):1434–1448. doi: 10.1364/josaa.20.001434. [DOI] [PubMed] [Google Scholar]
- 45.Mumford D. On the computational architecture of the neocortex. II. The role of cortico-cortical loops. Biol Cybern. 1992;66(3):241–251. doi: 10.1007/BF00198477. [DOI] [PubMed] [Google Scholar]
- 46.Rao RPN, Ballard DH. Predictive coding in the visual cortex: A functional interpretation of some extra-classical receptive-field effects. Nat Neurosci. 1999;2(1):79–87. doi: 10.1038/4580. [DOI] [PubMed] [Google Scholar]
- 47.Wibral M, Bledowski C, Kohler A, Singer W, Muckli L. The timing of feedback to early visual cortex in the perception of long-range apparent motion. Cereb Cortex. 2009;19(7):1567–1582. doi: 10.1093/cercor/bhn192. [DOI] [PMC free article] [PubMed] [Google Scholar]
- 48.Vetter P, Grosbras MH, Muckli L. TMS over V5 disrupts motion prediction. Cereb Cortex. 2015;25(4):1052–1059. doi: 10.1093/cercor/bht297. [DOI] [PMC free article] [PubMed] [Google Scholar]
- 49.Rockland KS, Van Hoesen GW. Direct temporal-occipital feedback connections to striate cortex (V1) in the macaque monkey. Cereb Cortex. 1994;4(3):300–313. doi: 10.1093/cercor/4.3.300. [DOI] [PubMed] [Google Scholar]
- 50.Salin PA, Bullier J. Corticocortical connections in the visual system: Structure and function. Physiol Rev. 1995;75(1):107–154. doi: 10.1152/physrev.1995.75.1.107. [DOI] [PubMed] [Google Scholar]
- 51.Zhuo Y, et al. Contributions of the visual ventral pathway to long-range apparent motion. Science. 2003;299(5605):417–420. doi: 10.1126/science.1077091. [DOI] [PubMed] [Google Scholar]
- 52.Logothetis NK, Pauls J, Augath M, Trinath T, Oeltermann A. Neurophysiological investigation of the basis of the fMRI signal. Nature. 2001;412(6843):150–157. doi: 10.1038/35084005. [DOI] [PubMed] [Google Scholar]
- 53.Brainard DH. The psychophysics toolbox. Spat Vis. 1997;10(4):433–436. [PubMed] [Google Scholar]
- 54.Pelli DG. The VideoToolbox software for visual psychophysics: Transforming numbers into movies. Spat Vis. 1997;10(4):437–442. [PubMed] [Google Scholar]
- 55.Cox RW. AFNI: Software for analysis and visualization of functional magnetic resonance neuroimages. Comput Biomed Res. 1996;29(3):162–173. doi: 10.1006/cbmr.1996.0014. [DOI] [PubMed] [Google Scholar]
- 56.Fischl B, Sereno MI, Dale AM. Cortical surface-based analysis. II: Inflation, flattening, and a surface-based coordinate system. Neuroimage. 1999;9(2):195–207. doi: 10.1006/nimg.1998.0396. [DOI] [PubMed] [Google Scholar]
- 57.Sasaki Y, et al. The radial bias: A different slant on visual orientation sensitivity in human and nonhuman primates. Neuron. 2006;51(5):661–670. doi: 10.1016/j.neuron.2006.07.021. [DOI] [PubMed] [Google Scholar]
- 58.Freeman J, Brouwer GJ, Heeger DJ, Merriam EP. Orientation decoding depends on maps, not columns. J Neurosci. 2011;31(13):4792–4804. doi: 10.1523/JNEUROSCI.5160-10.2011. [DOI] [PMC free article] [PubMed] [Google Scholar]


