Significance
SIRT6 (sirtuin 6) is a member of the highly conserved sirtuin family of NAD+-dependent deacetylases. SIRT6 regulates diverse cellular processes including tumorigenesis. However, the role of SIRT6 deacetylase activity in its tumor-suppressor functions is not well understood. Here we report that SIRT6 deacetylates nuclear PKM2 (pyruvate kinase M2). PKM2 is a glycolytic enzyme with nonmetabolic nuclear oncogenic functions. SIRT6-mediated deacetylation results in PKM2 nuclear export in an exportin 4-dependent manner. As a result of SIRT6-mediated deacetylation, PKM2 nuclear protein kinase and transcriptional coactivator functions are abolished. Thus SIRT6 suppresses PKM2-dependent cell proliferation and tumorigenesis. Taken together, our findings demonstrate the pivotal role of deacetylase activity in SIRT6 tumor-suppressor functions and delineate a mechanism of PKM2 nuclear export.
Keywords: SIRT6, PKM2, deacetylation, tumor suppressor
Abstract
SIRT6 (sirtuin 6) is a member of sirtuin family of deacetylases involved in diverse processes including genome stability, metabolic homeostasis, and tumorigenesis. However, the role of SIRT6 deacetylase activity in its tumor-suppressor functions is not well understood. Here we report that SIRT6 binds to and deacetylates nuclear PKM2 (pyruvate kinase M2) at the lysine 433 residue. PKM2 is a glycolytic enzyme with nonmetabolic nuclear oncogenic functions. SIRT6-mediated deacetylation results in PKM2 nuclear export. We further have identified exportin 4 as the specific transporter mediating PKM2 nuclear export. As a result of SIRT6-mediated deacetylation, PKM2 nuclear protein kinase and transcriptional coactivator functions are abolished. Thus, SIRT6 suppresses PKM2 oncogenic functions, resulting in reduced cell proliferation, migration potential, and invasiveness. Furthermore, studies in mouse tumor models demonstrate that PKM2 deacetylation is integral to SIRT6-mediated tumor suppression and inhibition of metastasis. Additionally, reduced SIRT6 levels correlate with elevated nuclear acetylated PKM2 levels in increasing grades of hepatocellular carcinoma. These findings provide key insights into the pivotal role of deacetylase activity in SIRT6 tumor-suppressor functions.
SIRT6 (sirtuin 6) is a member of the highly conserved sirtuin family of NAD+-dependent enzymes and plays a key role in DNA repair, telomere maintenance, and cellular metabolic processes. It exhibits diverse enzymatic activities including NAD+-dependent deacetylation and mono-ADP ribosylation. SIRT6 deacetylates telomeric histone H3 at lysine 9 (H3K9) and lysine 56 residues (H3K56) (1, 2). SIRT6-mediated deacetylation of telomeric H3K9 is required for the stable association of the Werner syndrome protein with telomeric chromatin for proper telomere function. SIRT6 also interacts with the NF-κB RELA subunit, deacetylates H3K9 at NF-κB target gene promoters, and attenuates NF-κB–mediated apoptosis and senescence (3). Likewise, SIRT6 also binds to hypoxia-inducible factor 1-alpha (HIF1α), deacetylates H3K9 at HIF1α target gene promoters, and regulates glucose homeostasis (4). SIRT6 also interacts with and deacetylates CtIP [C-terminal binding protein (CtBP) interacting protein] to promote the repair of DNA double-strand breaks by homologous recombination (5). SIRT6 mono-ADP ribosylates PARP1 to stimulate the repair of DNA double-strand breaks in response to oxidative stress (6).
Several recent studies report that SIRT6 functions as a tumor suppressor. It was observed that loss of SIRT6 promotes tumor formation even without the activation of known oncogenes (7). Furthermore, SIRT6 was found to be down-regulated in pancreatic and colorectal cancers. Down-regulation of SIRT6 also has been reported in hepatocellular carcinoma (8, 9). Elevated c-JUN levels in hepatocellular carcinoma down-regulate SIRT6 expression in a c-FOS–dependent manner (8). Recently, naturally occurring cancer-associated point mutations were identified in SIRT6 that result in its loss of tumor-suppressor functions (10). However, the role of SIRT6 enzymatic activities in its tumor-suppressor functions is not well understood.
Pyruvate kinase catalyzes the final rate-limiting step of glycolysis. Most cancer cells express high levels of PKM2 (pyruvate kinase M2) because it promotes aerobic glycolysis and provides a selective advantage for tumor formation (11). Thus PKM2 is reported to be up-regulated in wide range of cancers, including hepatocellular carcinoma (12, 13). In addition to its well-characterized cytosolic functions as a glycolytic enzyme, several studies have reported nuclear localization of PKM2 in response to different signals (14, 15). In the nucleus PKM2 functions as a transcriptional coactivator and protein kinase to trigger the expression of various genes, thereby bestowing cancer cells with survival and growth advantages (16–18). However, the molecular mechanisms underlying the dynamic regulation of PKM2 nuclear localization are not well understood. A recent study reports that PKM2 is acetylated by p300 acetyltransferase at the highly conserved lysine 433 residue, promoting the nuclear localization of PKM2 (19). K433 acetylation is down-regulated under starvation conditions.
To examine the role of SIRT6 enzymatic activities in its tumor-suppressor functions, we performed a proteomics screen to identify SIRT6-interacting proteins. Among the various proteins identified in the screen, PKM2 was of particular interest because acetylation plays a key role in determining its nuclear localization and oncogenic functions. We observed that SIRT6 binds to and deacetylates PKM2 at the K433 site, resulting in PKM2 nuclear export. Consequently PKM2 nuclear protein kinase and transcriptional coactivator functions are abrogated. Thus, SIRT6 suppresses PKM2 oncogenic functions.
Results
SIRT6 Interacts with Nuclear PKM2.
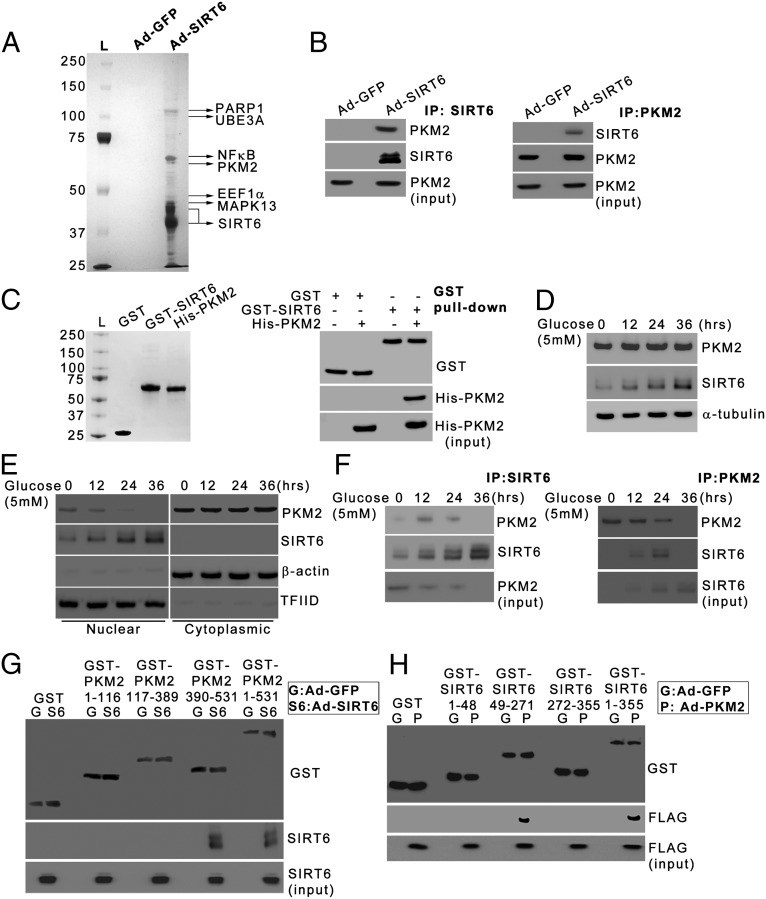
To gain mechanistic insights into the tumor-suppressor functions of SIRT6, we used a biochemical approach to identify SIRT6-interacting proteins (Fig. 1A). Because SIRT6 exhibits deacetylase activity, and acetylation is critical for PKM2 nuclear localization and oncogenic functions, it is possible that the regulation of PKM2 could be integral to SIRT6 tumor-suppressor functions. Thus, among the previously unidentified interactors, PKM2 was of particular interest. We performed coimmunoprecipitation experiments to confirm whether PKM2 interacts with SIRT6. We observed that PKM2 coimmunoprecipitated with SIRT6 (Fig. 1B, Left). Similar results were obtained in the reverse coimmunoprecipitation experiment (Fig. 1B, Right). To confirm that SIRT6 interacts directly with PKM2, GST pull down was performed using bacterially expressed and purified proteins (Fig. 1C, Left). Our results indicated that SIRT6 interacts directly with PKM2 (Fig. 1C, Right). To investigate the SIRT6–PKM2 interaction under physiological conditions, we first examined whether metabolic stress had any effect on PKM2. PKM2 protein levels did not change upon glucose starvation (Fig. 1D). Because PKM2 is known to undergo nuclear–cytoplasmic shuttling, we examined its localization upon glucose starvation. A small fraction of PKM2 is nuclear during the early phase of starvation (0, 12, and 24 h), but PKM2 becomes exclusively cytoplasmic upon prolonged starvation (36 h) (Fig. 1E). SIRT6 levels were induced upon starvation; SIRT6 remained nuclear throughout the course of starvation, as reported previously (20, 21). We next examined the interaction between endogenous SIRT6 and PKM2 under starvation conditions. We observed that during the early phase of metabolic stress, when both SIRT6 and PKM2 were nuclear, PKM2 coimmunoprecipitated with SIRT6 (Fig. 1F, Left). However, this interaction was lost upon prolonged starvation, when PKM2 underwent nuclear export. Similar observations were made in the reverse coimmunoprecipitation experiment (Fig. 1F, Right).
Fig. 1.
SIRT6 interacts with PKM2. (A) HepG2 cells were infected with adenovirus expressing GFP (Ad-GFP) or SIRT6 tagged with FLAG and HA epitopes (Ad-SIRT6). Cells were harvested, and nuclear extracts were sequentially immunoprecipitated with FLAG and HA antibody affinity resins. The SIRT6-associated proteins were detected by SDS/PAGE and silver staining. (B) HepG2 cells were transfected with the PKM2 construct. Six hours posttransfection, the cells were infected with Ad-GFP or Ad-SIRT6. Twenty-four hours postinfection cell were harvested and subjected to immunoprecipitation using anti-SIRT6 antibody (Left) or anti-PKM2 antibody (Right). Western blots then were performed for the indicated proteins. (C, Left) GST, GST-SIRT6, and His-PKM2 were bacterially expressed and purified. (Right) The GST pull-down assay was performed followed by Western blotting for the indicated proteins. (D) HepG2 cells were subjected to glucose starvation for the indicated periods. The cells then were harvested, and Western blotting was performed for the indicated proteins. (E) HepG2 cells were subjected to glucose starvation for the indicated periods. The cells then were harvested, and Western blotting was performed for the indicated proteins from nuclear and cytoplasmic fractions. (F) HepG2 cells were subjected to glucose starvation for the indicated periods. Nuclear extracts were subjected to immunoprecipitation using anti-SIRT6 antibody (Left) or anti-PKM2 antibody (Right), and Western blotting was performed for the indicated proteins. (G) HepG2 cells were transfected with constructs expressing full-length or different domains of PKM2 as the GST fusion protein. Six hours posttransfection, the cells were infected with Ad-GFP or Ad-SIRT6. Twenty-four hours postinfection, cell lysates were subjected to GST pull down followed by immunoblotting for the indicated proteins. (H) HepG2 cells were transfected with constructs expressing full-length or different domains of SIRT6 as the GST fusion protein. Six hours posttransfection, the cells were infected with adenovirus expressing GFP (Ad-GFP) or PKM2 tagged with FLAG epitope (Ad-PKM2). Twenty-four hours postinfection, cell lysates were subjected to GST pull down followed by immunoblotting for the indicated proteins.
To map the domain of PKM2 to which SIRT6 binds, we performed GST pull-down experiments. The GST-PKM2 segment containing amino acids 390–531, which harbors the FBP (fructose 1,6-biophosphate)-binding pocket of PKM2, bound specifically to the SIRT6 protein (Fig. 1G). Using GST pull-down experiments, we also mapped the domain of SIRT6 that binds PKM2. The GST-SIRT6 segment containing amino acids 49–271, which harbors the deacetylase domain of SIRT6, bound specifically to the PKM2 protein (Fig. 1H). Taken together, these results indicate that the deacetylase domain of SIRT6 binds to the PKM2 domain containing the FBP-binding pocket.
SIRT6 Deacetylates PKM2 at K433 and Abrogates Its Nuclear Localization.
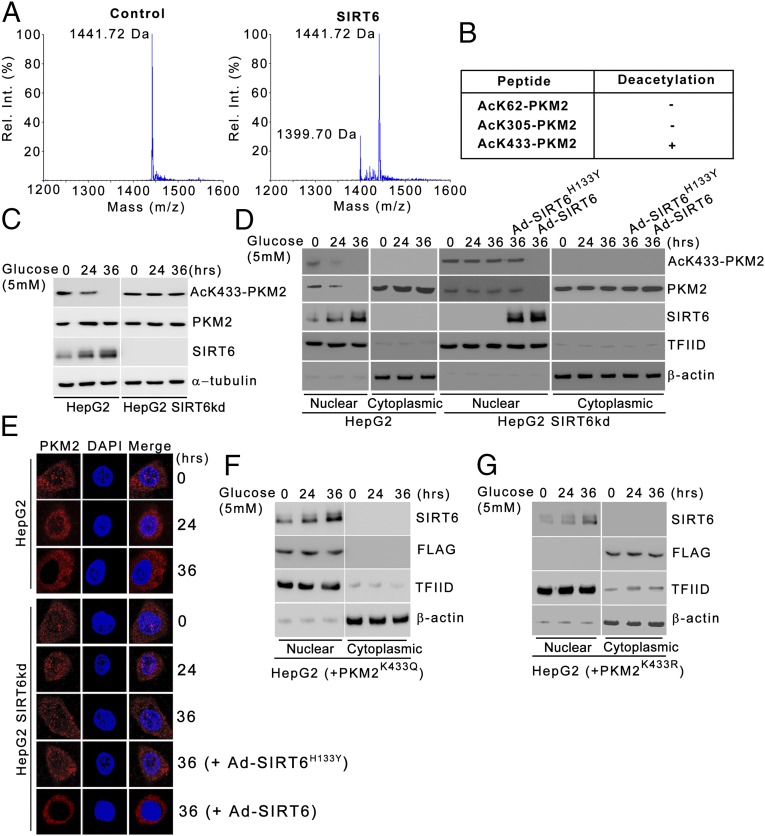
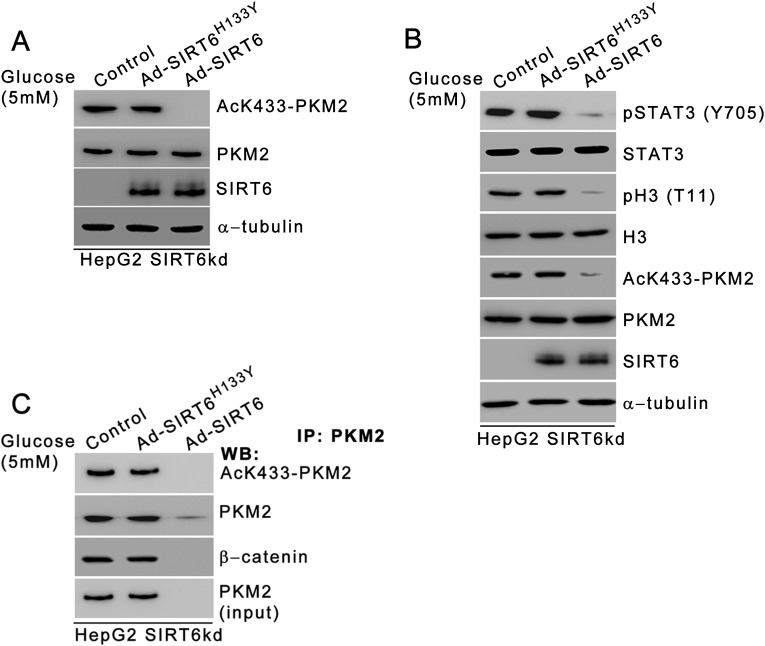
Previous reports suggest that PKM2 is acetylated at three sites: K62, K305, and K433 (19, 22). Because SIRT6 exhibits deacetylase activity, we examined the effect of SIRT6 on the PKM2 acetylation status. To map the residue, we performed an in vitro deacetylation assay using PKM2 peptides containing different acetylated lysine residues as substrates. MS analysis revealed that SIRT6 exhibits specific deacetylase activity toward the PKM2 peptide containing acetylated K433 (Fig. 2 A and B). We next examined the effect of SIRT6 on the PKM2 K433 acetylation status under physiological conditions. In HepG2 control cells, AcK433-PKM2 levels decreased over the time course of metabolic stress concomitant with the increase in SIRT6 levels (Fig. 2C and Fig. S1A). On the other hand, in the absence of SIRT6, PKM2 acetylation at K433 residue was sustained over the time course of stress. Similar results were observed in other cell types (Fig. S2 A and G). Furthermore, during an extended period of stress, PKM2 K433 acetylation was abolished in HepG2 SIRT6-knockdown (SIRT6kd) cells when wild-type SIRT6 was ectopically expressed, but PKM2 K433 acetylation remained unaltered when the deacetylase-dead SIRT6 mutant (SIRT6H133Y) was ectopically expressed (Fig. S3A). Taken together, these results indicate that SIRT6 is a deacetylase with specificity for the K433 site of PKM2.
Fig. 2.
SIRT6 deacetylates PKM2 at the Lys433 residue. (A) AcK433-PKM2 peptide was incubated either alone (control) or in presence of recombinant SIRT6, and the peptide molecular mass was determined by MS. The relative positions of acetylated (1,441.72 Da) and deacetylated (1,399.70 Da) PKM2 peptides are shown. (B) Results of SIRT6 deacetylation reactions using acetylated PKM2 peptides. The peptide molecular mass was determined by MS as in A. (C) HepG2 cells were stably transfected (pooled zeocin-resistant population) with control (scrambled) or SIRT6 shRNA. HepG2 control (HepG2) and SIRT6kd (HepG2 SIRT6kd) cells were subjected to glucose starvation for the indicated periods. Cells then were harvested, and Western blotting was performed for the indicated proteins. (D) HepG2 control (HepG2) and SIRT6kd (HepG2 SIRT6kd) cells were subjected to glucose starvation for the indicated periods. HepG2 SIRT6kd cells were infected with Ad-SIRT6 or with adenovirus expressing the deacetylase-dead SIRT6 mutant (Ad-SIRT6H133Y) during the last 24 h of the 36-h period as indicated. The cells then were harvested, and Western blotting was performed for the indicated proteins from nuclear and cytoplasmic fractions. (E) HepG2 control (HepG2) and SIRT6kd (HepG2 SIRT6kd) cells were subjected to glucose starvation for the indicated periods. HepG2 SIRT6kd cells were infected with Ad-SIRT6 or Ad-SIRT6H133Y during the last 24 h of the 36-h period as indicated. Immunofluorescence staining was performed for the indicated proteins. DAPI was used to counterstain the nucleus. (F) HepG2 cells were transfected with the FLAG-tagged PKM2K433Q construct and were subjected to glucose starvation for the indicated periods posttransfection. The cells then were harvested, and Western blotting was performed for the indicated proteins from nuclear and cytoplasmic fractions. (G) HepG2 cells were transfected with the FLAG-tagged PKM2K433R construct and were subjected to glucose starvation for the indicated periods posttransfection. The cells then were harvested, and Western blotting was performed for the indicated proteins from nuclear and cytoplasmic fractions.
Fig. S1.
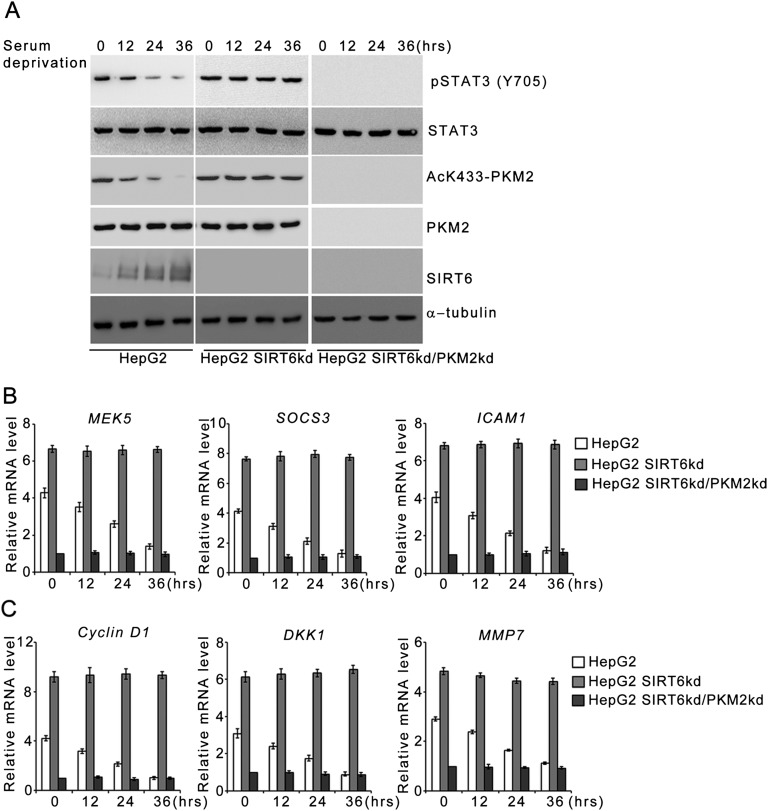
SIRT6 modulates PKM2 protein kinase activity and coactivator functions upon serum starvation. (A) HepG2 control (HepG2), SIRT6kd (HepG2 SIRT6kd), and SIRT6/PKM2 double-knockdown (HepG2 SIRT6kd/PKM2kd) cells were subjected to serum starvation for the indicated periods. Cells then were harvested, and Western blotting was performed for the indicated proteins. (B) HepG2 control (HepG2), SIRT6kd (HepG2 SIRT6kd), and SIRT6/PKM2 double-knockdown (HepG2 SIRT6kd/PKM2kd) cells were subjected to serum starvation for the indicated periods. Total RNA was isolated, and relative mRNA levels were analyzed by RT-qPCR for the indicated genes. Error bars represent means ± SD of three independent experiments with triplicate samples. (C) HepG2 control (HepG2), SIRT6kd (HepG2 SIRT6kd), and SIRT6/PKM2 double-knockdown (HepG2 SIRT6kd/PKM2kd) cells were subjected to serum starvation for the indicated periods. Total RNA was isolated, and relative mRNA levels were analyzed by RT-qPCR for the indicated genes. Error bars represent means ± SD of three independent experiments with triplicate samples.
Fig. S2.
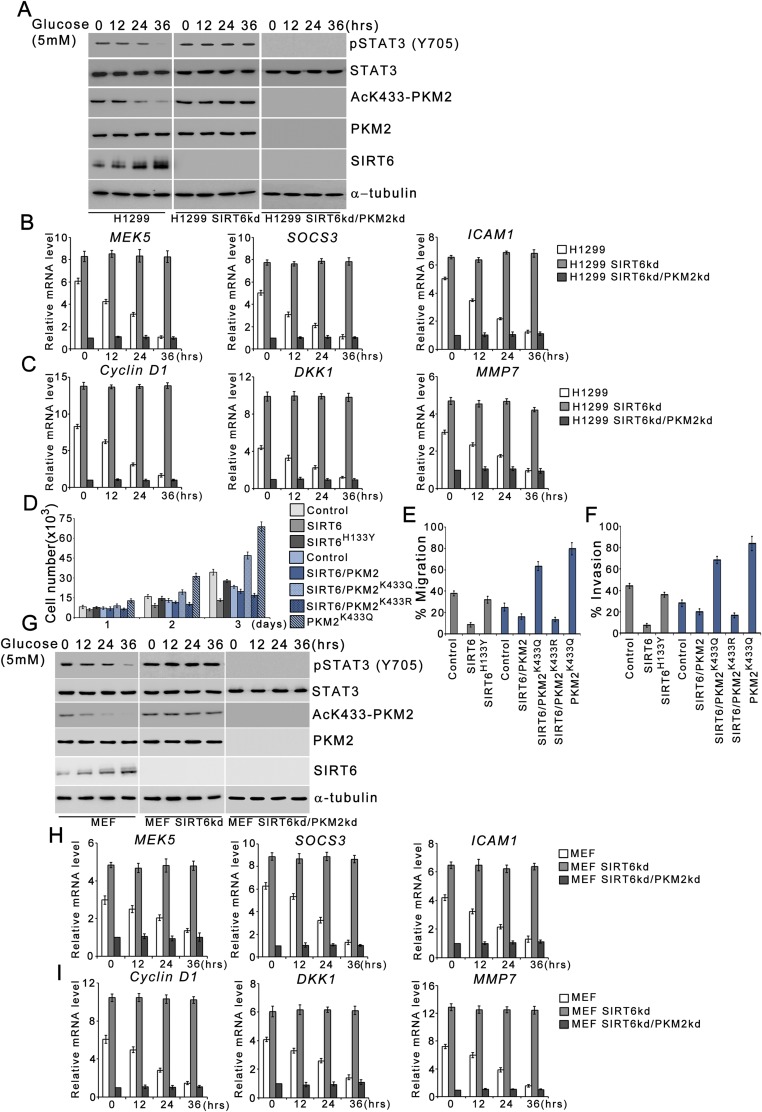
SIRT6 suppresses PKM2 oncogenic functions in other cell types. (A) H1299 cells were stably transfected (pooled zeocin-resistant population) with control (scrambled) shRNA, SIRT6 shRNA, or SIRT6 shRNA along with PKM2 shRNA. H1299 control (H1299), SIRT6kd (H1299 SIRT6kd), and SIRT6/PKM2 double-knockdown (H1299 SIRT6kd/PKM2kd) cells were subjected to glucose starvation for the indicated periods. Cells then were harvested, and Western blotting was performed for the indicated proteins. (B) H1299 control (H1299), SIRT6kd (H1299 SIRT6kd), and SIRT6/PKM2 double-knockdown (H1299 SIRT6kd/PKM2kd) cells were subjected to glucose starvation for the indicated periods. Total RNA was isolated, and relative mRNA levels were analyzed by RT-qPCR for the indicated genes. Error bars represent means ± SD of three independent experiments with triplicate samples. (C) H1299 control (H1299), SIRT6kd (H1299 SIRT6kd), and SIRT6/PKM2 double-knockdown (H1299 SIRT6kd/PKM2kd) cells were subjected to glucose starvation for the indicated periods. Total RNA was isolated, and relative mRNA levels were analyzed by RT-qPCR for the indicated genes. Error bars represent means ± SD of three independent experiments with triplicate samples. (D) H1299 SIRT6kd cells (gray bars) or SIRT6/PKM2 double-knockdown cells (blue bars) were stably transfected (pooled hygromycin-resistant population) with a dual expression plasmid encoding FLAG-tagged wild-type SIRT6, FLAG-tagged SIRT6H133Y, PKM2K433Q, and FLAG-tagged wild-type SIRT6 along with PKM2K433Q or PKM2K433R as indicated. H1299 SIRT6kd or SIRT6/PKM2 double-knockdown cells stably transfected with empty vector served as control. The cells were harvested and counted at the indicated time points. Error bars represent means ± SD of three independent experiments with duplicate samples. (E) The migration potential of the cells in D was measured as the percentage of cells migrating to the lower chamber. Error bars represent means ± SD of three independent experiments with triplicate samples. (F) The in vitro invasion of the cells in D was measured as the percentage of cells migrating to the lower chamber. Error bars represent means ± SD of three independent experiments with duplicate samples. (G) Primary MEFs were transduced with control (scrambled) shRNA, SIRT6 shRNA, or SIRT6 shRNA along with PKM2 shRNA. MEF control (MEF), SIRT6kd (MEF SIRT6kd), and SIRT6/PKM2 double-knockdown (MEF SIRT6kd/PKM2kd) cells were subjected to glucose starvation for the indicated periods. Cells then were harvested, and Western blotting was performed for the indicated proteins. (H) MEF control (MEF), SIRT6kd (MEF SIRT6kd), and SIRT6/PKM2 double-knockdown (MEF SIRT6kd/PKM2kd) cells were subjected to glucose starvation for the indicated periods. Total RNA was isolated, and relative mRNA levels for the indicated genes were analyzed by RT-qPCR. Error bars represent means ± SD of three independent experiments with triplicate samples. (I) MEF control (MEF), SIRT6kd (MEF SIRT6kd), and SIRT6/PKM2 double-knockdown (MEF SIRT6kd/PKM2kd) cells were subjected to glucose starvation for the indicated periods. Total RNA was isolated, and relative mRNA levels were analyzed by RT-qPCR for the indicated genes. Error bars represent means ± SD of three independent experiments with triplicate samples.
Fig. S3.
The deacetylase-dead SIRT6 mutant (SIRT6H133Y) cannot repress PKM2 functions. (A) HepG2 SIRT6kd (HepG2 SIRT6kd) cells were subjected to glucose starvation for 36 h and were infected with adenovirus expressing SIRT6 (Ad-SIRT6) or adenovirus expressing the deacetylase-dead SIRT6 mutant (Ad-SIRT6H133Y) during the last 24 h of the 36-h period, as indicated. The cells then were harvested, and Western blotting was performed for the indicated proteins. (B) HepG2 SIRT6kd (HepG2 SIRT6kd) cells were subjected to glucose starvation for 36 h and were infected with Ad-SIRT6 or Ad-SIRT6H133Y during the last 24 h of the 36-h period, as indicated. The cells then were harvested, and Western blotting was performed for the indicated proteins. (C) HepG2 SIRT6kd (HepG2 SIRT6kd) cells were subjected to glucose starvation for 36 h and were infected with Ad-SIRT6 or Ad-SIRT6H133Y during the last 24 h of the 36-h period as indicated. The cells then were harvested, and nuclear extracts were subjected to immunoprecipitation using anti-PKM2 antibody. Western blotting was performed for the indicated proteins.
Because a previous report suggested that K433 acetylation determines PKM2 nuclear localization (19), we next examined the effect of SIRT6 on PKM2 subcellular localization by biochemical fractionation and by immunostaining. We observed that with an increasing duration of starvation, concomitant with SIRT6-mediated PKM2 deacetylation, PKM2 nuclear localization diminished and became predominantly cytoplasmic, but in the absence of SIRT6, PKM2 K433 acetylation and its nuclear localization were unaltered (Fig. 2 D and E). Furthermore, during extended periods of stress (36 h), PKM2 nuclear localization was abolished in HepG2 SIRT6kd cells when wild-type SIRT6 was ectopically expressed, but PKM2 nuclear localization was unaltered when the deacetylase-dead SIRT6 mutant (SIRT6H133Y) was ectopically expressed. Moreover, the acetyl-lysine mimic PKM2 mutant (PKM2K433Q) was constitutively nuclear in the presence of induced levels of SIRT6 over the course of glucose starvation, whereas the nonacetylable PKM2 mutant (PKM2K433R) was constitutively cytoplasmic (Fig. 2 F and G). Taken together, these results indicate that SIRT6-mediated deacetylation plays a key role in modulating PKM2 nuclear localization under conditions of metabolic stress.
Exportin-4 Mediates Deacetylated PKM2 Nuclear Export.
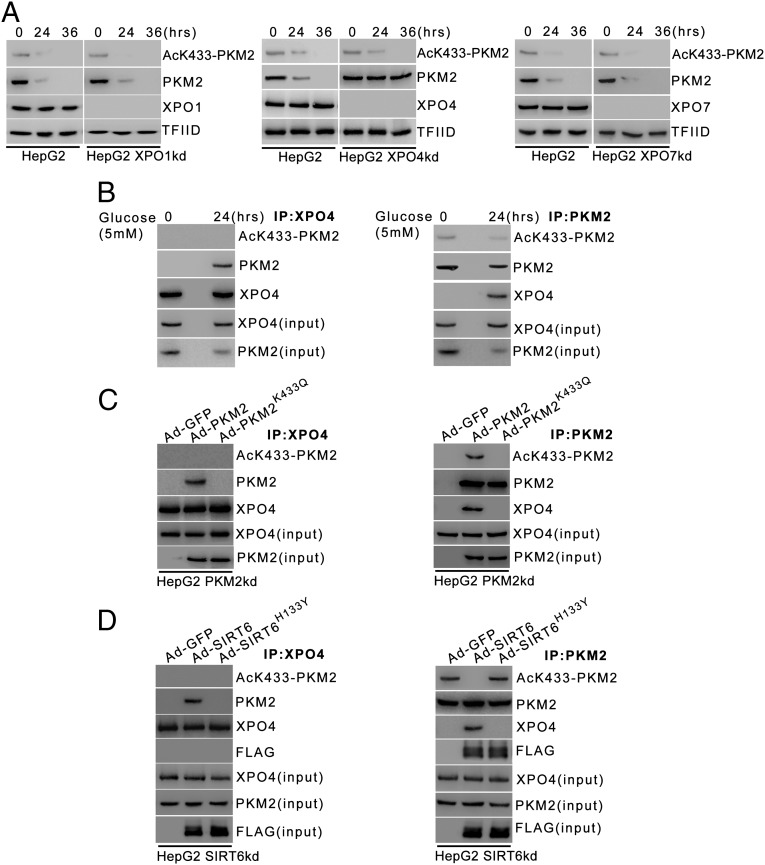
To identify the specific transporter mediating PKM2 nuclear export, we abrogated the expression of importin β superfamily members involved in protein export, i.e., exportin-1 (XPO1), exportin-4 (XPO4), and exportin-7 (XPO7) (23), and examined the effect on PKM2 nuclear localization. We observed that the disruption of XPO1 or XPO7 expression had no effect on PKM2 nuclear localization over the time course of starvation (Fig. 3A, Left and Right). However, the abrogation of XPO4 expression resulted in nuclear accumulation of deacetylated PKM2 even at extended periods of starvation (36 h) (Fig. 3A, Center). To investigate further, we examined the PKM2–XPO4 interaction under starvation conditions. We observed that deacetylated PKM2 coimmunoprecipitated specifically with XPO4, but acetylated PKM2 did not (Fig. 3B). We further observed that XPO4 interacts with deacetylated PKM2 but not with the acetyl-lysine mimic PKM2 mutant (PKM2K433Q) (Fig. 3C). This finding explains the constitutive nuclear localization of PKM2K433Q under starvation conditions, as observed above (Fig. 2F). Moreover, in the absence of SIRT6, when nuclear PKM2 is in an acetylated form, XPO4 does not interact with PKM2 (Fig. 3D), but in the presence of ectopic SIRT6, when nuclear PKM2 is in a deacetylated form, XPO4 does interact with PKM2. However, in the presence of the deacetylase-dead SIRT6 mutant (SIRT6H133Y), XPO4 does not interact with PKM2 as nuclear PKM2 is in an acetylated form. These results suggest that acetylation status of PKM2 is a key determinant of the XPO4–PKM2 interaction. XPO4 binds specifically to deacetylated PKM2 and mediates its nuclear export.
Fig. 3.
Deacetylated nuclear PKM2 interacts with XPO4, leading to its nuclear export. (A) HepG2 cells were stably transfected (pooled zeocin-resistant population) with shRNA targeting XPO1, XPO4, XPO7, or their respective control (scrambled) shRNA. HepG2 XPO1kd (Left), XPO4kd (HepG2 XPO4kd) (Center), XPO7kd (HepG2 XPO7kd) (Right), and their respective control (HepG2) cells were subjected to glucose starvation for the indicated periods. Cells then were harvested, and Western blotting was performed for the indicated proteins from nuclear extracts. (B) HepG2 cells were subjected to glucose starvation for 24 h. Nuclear extracts were subjected to immunoprecipitation using anti-XPO4 antibody (Left) or anti-PKM2 antibody (Right), and Western blotting was performed for the indicated proteins. (C) HepG2 PKM2kd cells were subjected to glucose starvation for 24 h and were infected with control adenovirus (Ad-GFP), adenovirus expressing PKM2 (Ad-PKM2), or adenovirus expressing the PKM2K433Q mutant (Ad-PKM2K433Q) during the last 12 h of the 24-h period as indicated. Nuclear extracts were subjected to immunoprecipitation using anti-XPO4 antibody (Left) or anti-PKM2 antibody (Right), and Western blotting was performed for the indicated proteins. (D) HepG2 SIRT6kd cells were subjected to glucose starvation for 24 h and were infected with control adenovirus (Ad-GFP), adenovirus expressing FLAG-tagged SIRT6 (Ad-SIRT6), or adenovirus expressing FLAG-tagged SIRT6H133Y mutant (Ad-SIRT6H133Y) during the last 12 h of the 24-h period as indicated. Nuclear extracts were subjected to immunoprecipitation using anti-XPO4 antibody (Left) or anti-PKM2 antibody (Right), and Western blotting was performed for the indicated proteins.
SIRT6 Represses PKM2 Kinase Activity.
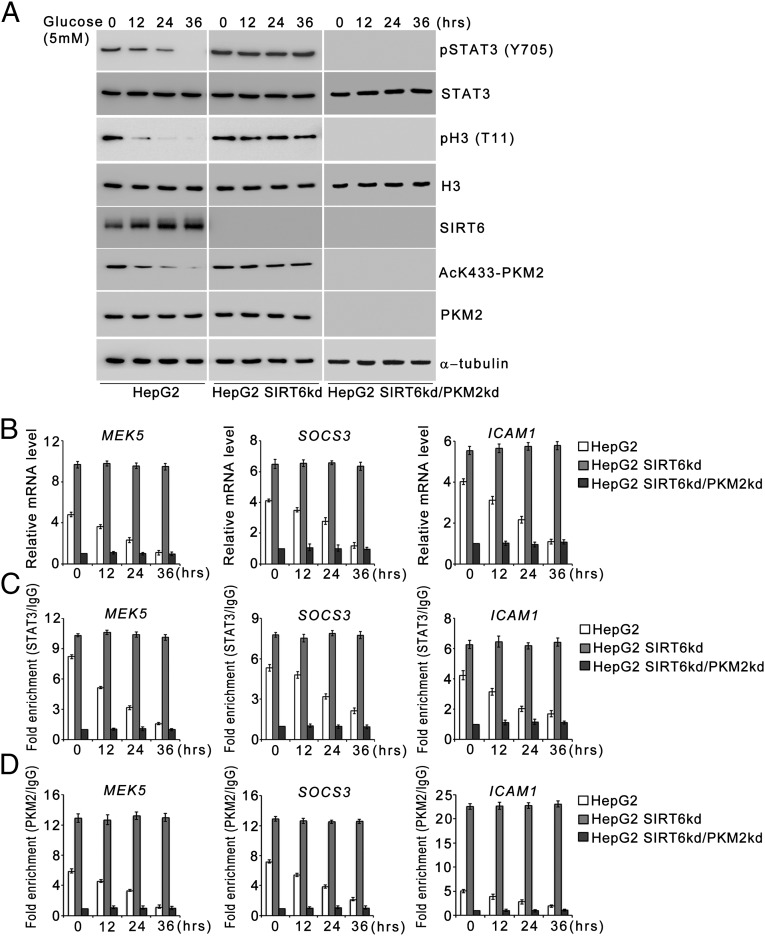
Because PKM2 has been reported to exhibit protein kinase activity in the nucleus, we next investigated the effect of SIRT6 on the phosphorylation of STAT3 and histone H3, the currently known substrates of PKM2 kinase (Fig. 4A and Fig. S1A). In HepG2 control cells the levels of phosphorylated STAT3 (Y705) and histone H3 (T11) decreased concomitant with the decrease in acetylated K433-PKM2 levels upon metabolic stress. In HepG2 SIRT6kd cells, however, sustained levels of phosphorylated STAT3 (Y705) and histone H3 (T11) were observed, similar to the levels of acetylated K433-PKM2 throughout the time course of metabolic stress. In HepG2 SIRT6/PKM2 double-knockdown cells the levels of phosphorylated STAT3 (Y705) and histone H3 (T11) were down-regulated upon metabolic stress. Similar results were obtained in other cell types (Fig. S2 A and G). Furthermore, when wild-type SIRT6 was ectopically expressed during an extended period of stress, the levels of both phosphorylated STAT3 (Y705) and histone H3 (T11) were reduced concomitant with the decrease in AcK433-PKM2 levels, but when the deacetylase-dead SIRT6 mutant (SIRT6H133Y) was ectopically expressed, the levels of both phosphorylated STAT3 (Y705) and histone H3 (T11) remained unaltered (Fig. S3B). Taken together these results indicate that SIRT6 plays a key role in determining the phosphorylation status of PKM2-dependent STAT3 and histone H3 under conditions of metabolic stress.
Fig. 4.
SIRT6 modulates PKM2 protein kinase activity. (A) HepG2 control (HepG2), SIRT6kd (HepG2 SIRT6kd), and SIRT6/PKM2 double-knockdown (HepG2 SIRT6kd/PKM2kd) cells were subjected to glucose starvation for the indicated periods. Cells then were harvested, and Western blotting was performed for the indicated proteins. (B) HepG2 control (HepG2), SIRT6kd (HepG2 SIRT6kd), and SIRT6/PKM2 double-knockdown (HepG2 SIRT6kd/PKM2kd) cells were subjected to glucose starvation for the indicated periods. Relative mRNA levels were analyzed by quantitative RT-PCR (RT-qPCR) for the indicated genes. Error bars represent means ± SD of three independent experiments with triplicate samples. (C) HepG2 control (HepG2), SIRT6kd (HepG2 SIRT6kd), and SIRT6/PKM2 double-knockdown (HepG2 SIRT6kd/PKM2kd) cells were subjected to glucose starvation for the indicated periods. A ChIP assay then was performed with control IgG or STAT3 antibody. Error bars represent means ± SD of three independent experiments with triplicate samples. (D) Part of the chromatin immunoprecipitated with STAT3 antibody in 4C was again subjected to ChIP using control IgG or PKM2 antibody. Error bars represent means ± SD of three independent experiments with triplicate samples.
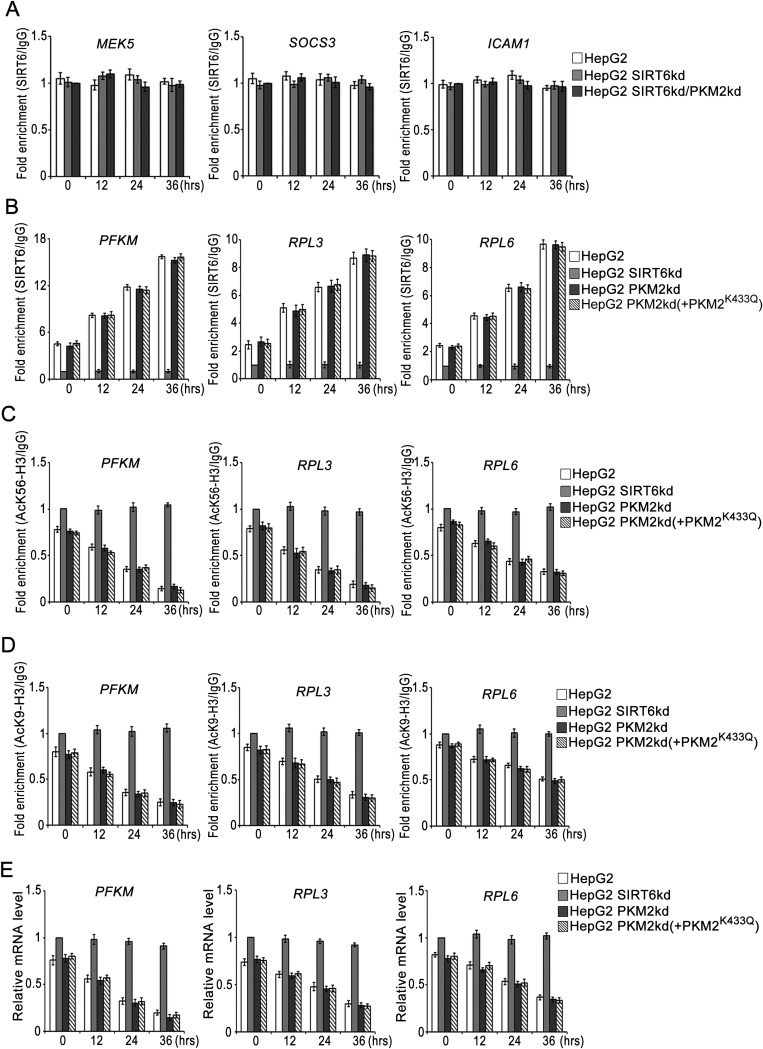
To examine the functional consequences of SIRT6-mediated regulation of STAT3 phosphorylation, we analyzed the transcript levels of STAT3 target genes (Fig. 4B and Fig. S1B). In HepG2 control cells the levels of STAT3 target genes decreased significantly over the time course of metabolic stress, but in HepG2 SIRT6kd cells the levels of STAT3 target genes were significantly elevated over the time course of metabolic stress. However, this induction of STAT3 target genes was abolished in HepG2 SIRT6/PKM2 double-knockdown cells. Similar results were obtained in other cell types (Fig. S2 B and H). We also examined the STAT3 transactivation function by performing a ChIP (chromatin immunoprecipitation) assay (Fig. 4C). In HepG2 control cells, the levels of STAT3 detected at the promoters of its target genes decreased significantly over the time course of metabolic stress. In the case of HepG2 SIRT6kd cells, STAT3 levels were elevated at the promoters of its target genes over the time course of metabolic stress. However, the recruitment of STAT3 to its target promoters was significantly down-regulated in HepG2 SIRT6/PKM2 double-knockdown cells. To ascertain the presence of PKM2 in the transcription complex, we performed re-ChIP (re-chromatin immunoprecipitation) experiments (Fig. 4D). In HepG2 control cells the PKM2 levels detected at the promoters of STAT3 target genes decreased over the time course of metabolic stress. In HepG2 SIRT6kd cells elevated PKM2 levels were detected at the promoters of STAT3 target genes over the time course of metabolic stress. In HepG2 SIRT6/PKM2 double-knockdown cells, no significant levels of PKM2 could be detected at the promoters of STAT3 target genes over the time course of metabolic stress. Because SIRT6 also is known to regulate transcription by deacetylation of histone H3K9 and H3K56, we performed a ChIP assay to examine the presence of SIRT6 at STAT3 targets (Fig. S4A). No significant levels of SIRT6 could be detected at the STAT3 target promoters over the time course of metabolic stress in HepG2 control, SIRT6kd, or SIRT6/PKM2 double-knockdown cells. We also examined the effect of PKM2 on SIRT6-mediated regulation of previously described SIRT6 target genes (4, 7, 10). We observed that wild-type PKM2 and the constitutively nuclear PKM2K433Q mutant had no effect on SIRT6 occupancy at the promoters of known SIRT6 target genes (Fig. S4B). Wild-type PKM2 and the PKM2K433Q mutant also had no effect on SIRT6-mediated H3K9 and H3K56 deacetylation at those promoters (Fig. S4 C and D). Thus, wild-type PKM2 and the PKM2K433Q mutant do not impinge on SIRT6-mediated regulation of known SIRT6 target genes (Fig. S4E). Taken together, these results indicate that SIRT6 plays a critical role in determining PKM2 nuclear kinase activity and hence impact its transcription program.
Fig. S4.
SIRT6 occupancy at STAT3 and SIRT6 target promoters. (A) HepG2 control (HepG2), SIRT6kd (HepG2 SIRT6kd), and SIRT6/PKM2 double-knockdown (HepG2 SIRT6kd/PKM2kd) cells were subjected to glucose starvation for the indicated periods. A ChIP assay then was performed with control IgG or SIRT6 antibody. The fold enrichment of coprecipitating DNA was determined by qPCR for the indicated promoters. Error bars represent means ± SD of three independent experiments with triplicate samples. (B) HepG2 control (HepG2), SIRT6kd (HepG2 SIRT6kd), PKM2kd (HepG2 PKM2kd), and PKM2kd along with PKM2K433Q-expressing [HepG2 PKM2kd (+PKM2K433Q)] cells were subjected to glucose starvation for the indicated periods. A ChIP assay then was performed with control IgG or SIRT6 antibody. The fold enrichment of coprecipitating DNA was determined by qPCR for the indicated promoters. Error bars represent means ± SD of three independent experiments with triplicate samples. (C) HepG2 control (HepG2), SIRT6kd (HepG2 SIRT6kd), PKM2kd (HepG2 PKM2kd), and PKM2kd along with PKM2K433Q-expressing [HepG2 PKM2kd (+PKM2K433Q)] cells were subjected to glucose starvation for the indicated periods. A ChIP assay then was performed with control IgG or AcK56-H3 antibody. The fold enrichment of coprecipitating DNA was determined by qPCR for the indicated promoters. Error bars represent means ± SD of three independent experiments with triplicate samples. (D) HepG2 control (HepG2), SIRT6kd (HepG2 SIRT6kd), PKM2kd (HepG2 PKM2kd), and PKM2kd along with PKM2K433Q-expressing [HepG2 PKM2kd (+PKM2K433Q)] cells were subjected to glucose starvation for the indicated periods. A ChIP assay then was performed with control IgG or AcK9-H3 antibody. The fold enrichment of coprecipitating DNA was determined by qPCR for the indicated promoters. Error bars represent means ± SD of three independent experiments with triplicate samples. (E) HepG2 control (HepG2), SIRT6kd (HepG2 SIRT6kd), PKM2kd (HepG2 PKM2kd), and PKM2kd along with PKM2K433Q-expressing [HepG2 PKM2kd (+PKM2K433Q)] cells were subjected to glucose starvation for the indicated periods. Total RNA was isolated, and relative mRNA levels were analyzed by RT-qPCR for the indicated genes. Error bars represent means ± SD of three independent experiments with triplicate samples.
SIRT6 Regulates PKM2 Coactivator Functions.
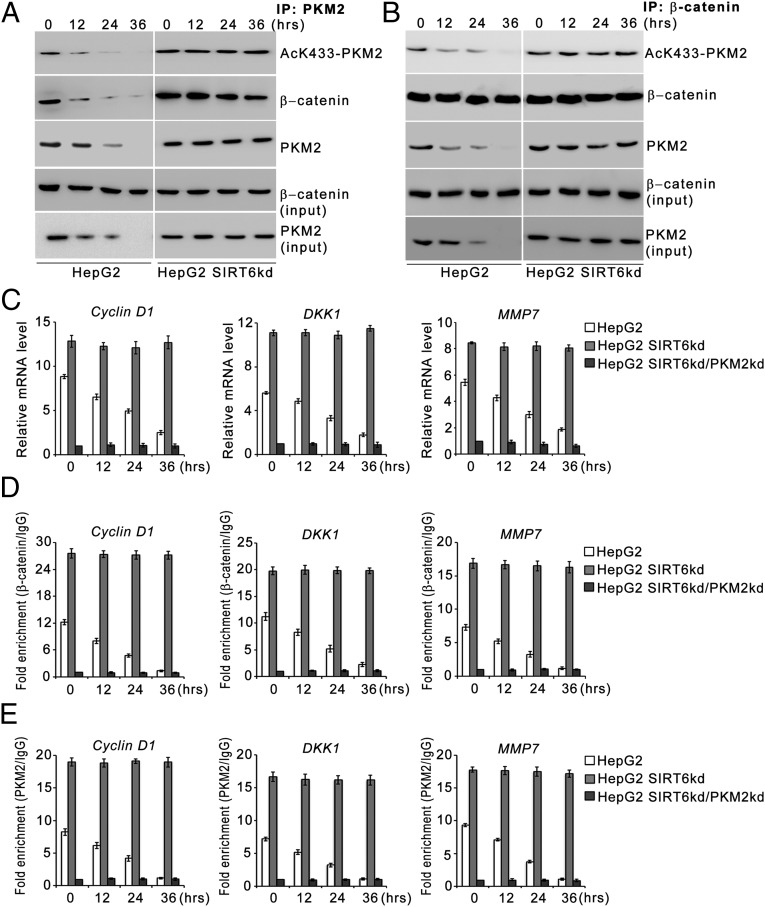
Because PKM2 functions as a β-catenin coactivator, we next investigated the effect of SIRT6 on the PKM2-dependent β-catenin transactivation function. Our results indicated that in HepG2 control cells the interaction between PKM2 and β-catenin was abrogated as the acetylated K433-PKM2 levels were down-regulated with increasing duration of starvation (Fig. 5 A and B). In HepG2 SIRT6kd cells the interaction between PKM2 and β-catenin was observed consistently over the time course of stress. Moreover, when wild-type SIRT6 was ectopically expressed during an extended period of stress (36 h), the interaction between PKM2 and β-catenin was lost, but when deacetylase-dead SIRT6 mutant (SIRT6H133Y) was ectopically expressed, the interaction between PKM2 and β-catenin was observed (Fig. S3C).
Fig. 5.
SIRT6 abrogates PKM2–β-catenin interaction. (A and B) HepG2 control (HepG2) and SIRT6kd (HepG2 SIRT6kd) cells were subjected to glucose starvation for the indicated periods. Nuclear extracts were subjected to immunoprecipitation using anti-PKM2 antibody (A) or anti–β-catenin antibody (B), and Western blotting was performed for the indicated proteins. (C) HepG2 control (HepG2), SIRT6kd knockdown (HepG2 SIRT6kd), and SIRT6/PKM2 double-knockdown (HepG2 SIRT6kd/PKM2kd) cells were subjected to glucose starvation for the indicated periods. Relative mRNA levels were analyzed by RT-qPCR for the indicated genes. Error bars represent means ± SD of three independent experiments with triplicate samples. (D) HepG2 control (HepG2), SIRT6kd (HepG2 SIRT6kd), and SIRT6/PKM2 double-knockdown (HepG2 SIRT6kd/PKM2kd) cells were subjected to glucose starvation for the indicated periods. A ChIP assay then was performed with control IgG or β-catenin antibody. Error bars represent means ± SD of three independent experiments with triplicate samples. (E) Part of the chromatin immunoprecipitated with β-catenin antibody in D was again subjected to ChIP using control IgG or PKM2 antibody. Error bars are means ± SD of three independent experiments with triplicate samples.
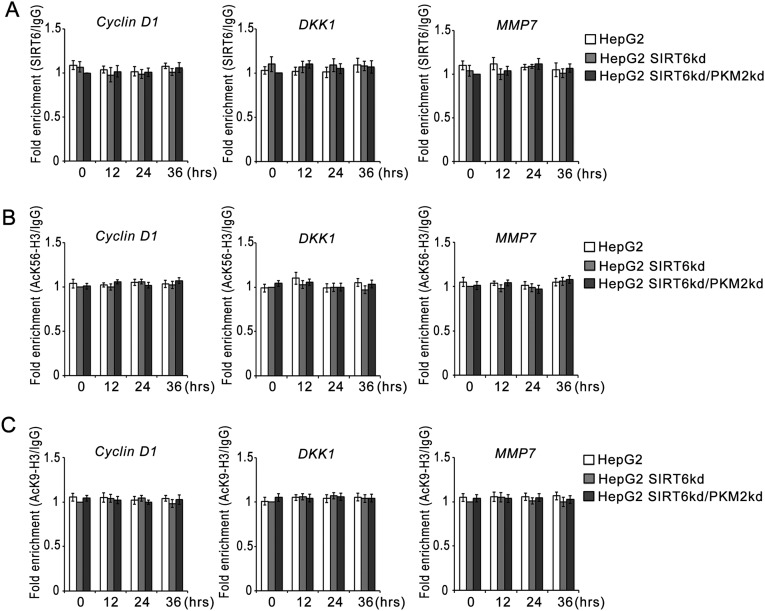
We next determined the effect of SIRT6 on PKM2-dependent transactivation of β-catenin target genes. In HepG2 control cells there was a significant decrease in the levels of β-catenin target genes over the time course of metabolic stress. On the other hand, in HepG2 SIRT6kd cells, significantly elevated levels of β-catenin target genes were observed over the time course of metabolic stress. However, this induction of β-catenin target genes was abolished in HepG2 SIRT6/PKM2 double-knockdown cells (Fig. 5C and Fig. S1C). Similar results were obtained in other cell types (Fig. S2 C and I). To corroborate our findings, we examined the recruitment of β-catenin to the promoters of its target genes (Fig. 5D). In HepG2 control cells the levels of β-catenin detected at the promoters of its target genes decreased significantly over the time course of metabolic stress. In HepG2 SIRT6kd cells elevated levels of β-catenin were detected at the promoters of its target genes over the time course of metabolic stress. However, no significant levels of β-catenin could be detected at those promoters in HepG2 SIRT6/PKM2 double-knockdown cells. To ascertain the presence of PKM2 in the transcription complex, we performed a re-ChIP assay. In HepG2 control cells the levels of PKM2 detected at the promoters of β-catenin target genes decreased significantly over the time course of metabolic stress. In HepG2 SIRT6kd cells elevated levels of PKM2 were detected at the promoters of β-catenin target genes over the time course of metabolic stress. In HepG2 SIRT6/PKM2 double-knockdown cells no significant levels of PKM2 could be detected at the promoters of β-catenin target genes over the time course of metabolic stress (Fig. 5E). To examine the potential role of SIRT6 in epigenetic regulation of β-catenin target genes, we performed a ChIP assay to determine the presence of SIRT6 at the β-catenin target promoters (Fig. S5A). No significant levels of SIRT6 could be detected at the β-catenin target promoters over the time course of metabolic stress. Because SIRT6 is not recruited to β-catenin target promoters, H3K9ac and H3K56ac levels at those promoters were not affected over the time course of metabolic stress (Fig. S5 B and C). Thus we concluded that SIRT6-mediated PKM2 deacetylation upon metabolic stress inhibits PKM2–β-catenin interaction, thereby suppressing PKM2 coactivator functions.
Fig. S5.
SIRT6 does not affect H3K9ac and H3K56ac levels at β-catenin target promoters. (A) HepG2 control (HepG2), SIRT6kd (HepG2 SIRT6kd), and SIRT6/PKM2 double-knockdown (HepG2 SIRT6kd/PKM2kd) cells were subjected to glucose starvation for the indicated periods. A ChIP assay then was performed with control IgG or SIRT6 antibody. The fold enrichment of coprecipitating DNA was determined by qPCR for the indicated promoters. Error bars represent means ± SD of three independent experiments with triplicate samples. (B) HepG2 control (HepG2), SIRT6kd (HepG2 SIRT6kd), and SIRT6/PKM2 double-knockdown (HepG2 SIRT6kd/PKM2kd) cells were subjected to glucose starvation for the indicated periods. A ChIP assay then was performed with control IgG or AcK56-H3 antibody. The fold enrichment of coprecipitating DNA was determined by qPCR for the indicated promoters. Error bars represent means ± SD of three independent experiments with triplicate samples. (C) HepG2 control (HepG2), SIRT6kd (HepG2 SIRT6kd), and SIRT6/PKM2 double-knockdown (HepG2 SIRT6kd/PKM2kd) cells were subjected to glucose starvation for the indicated periods. A ChIP assay then was performed with control IgG or AcK9-H3 antibody. The fold enrichment of coprecipitating DNA was determined by qPCR for the indicated promoters. Error bars represent means ± SD of three independent experiments with triplicate samples.
SIRT6 Suppresses PKM2 Oncogenic Functions.
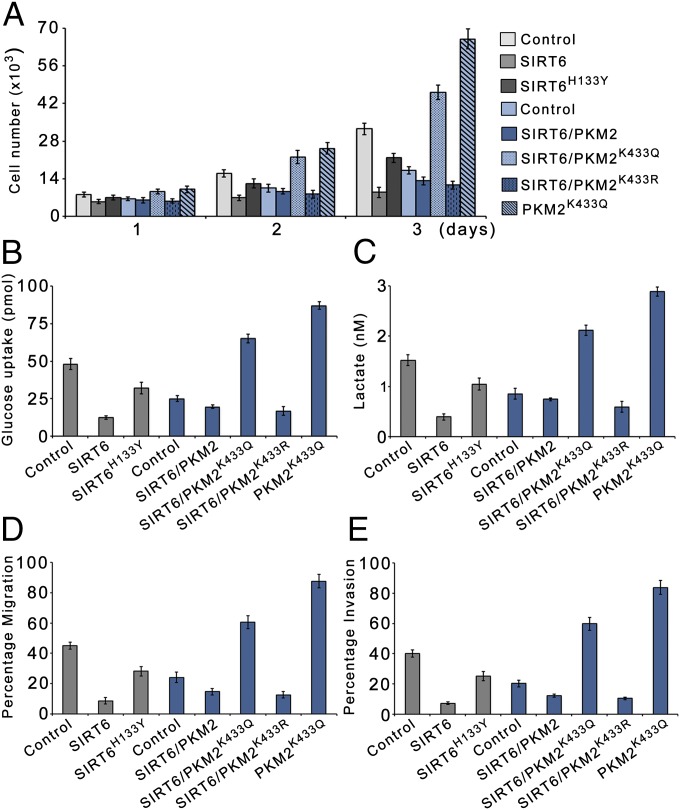
Because PKM2 nuclear localization is intricately linked to its oncogenic functions, we next determined the effect of SIRT6-mediated PKM2 deacetylation on cell proliferation and transformation. We observed that cell proliferation in the presence of wild-type SIRT6 was reduced significantly compared with proliferation in the presence of the SIRT6 mutant (SIRT6H133Y). However, the cell proliferation was markedly higher upon ectopic expression of SIRT6 along with constitutively nuclear PKM2 mutant (PKM2K433Q) than upon ectopic expression of SIRT6 along with the constitutively cytosolic PKM2 mutant (PKM2K433R). Furthermore, cell proliferation upon ectopic expression of PKM2K433Q was lower in the presence of SIRT6 than in the absence of SIRT6 (Fig. 6A and Fig. S6A). Similar results were obtained in H1299 cells (Fig. S2D). We also examined the metabolic changes in these cells. Glucose uptake and lactate production were greatly reduced in cells expressing SIRT6 compared with cells expressing SIRT6H133Y (Fig. 6 B and C). Furthermore glucose uptake and lactate production were much higher in cells expressing SIRT6 along with PKM2K433Q than in cells expressing SIRT6 along with PKM2K433R. Glucose uptake and lactate production in cells expressing PKM2K433Q were lower in the presence of SIRT6 than in the absence of SIRT6. Thus our results suggest that SIRT6-mediated PKM2 deacetylation and subsequent nuclear export suppress the proliferative advantage of cancer cells. To investigate further, we also examined the effect on the malignant phenotype of these cells. We observed that the migration potential and invasiveness of the cells was notably reduced upon ectopic expression of SIRT6, but there was no significant change when SIRT6H133Y was ectopically expressed (Fig. 6 D and E). Moreover, migration potential and invasiveness were much higher in cells expressing SIRT6 along with PKM2K433Q than in cells expressing SIRT6 along with PKM2K433R and were lower upon ectopic expression of PKM2K433Q in the presence of SIRT6 than in cells expressing PKM2K433Q in the absence of SIRT6. Similar results were obtained in H1299 cells (Fig. S2 E and F). These results suggest that SIRT6-mediated PKM2 deacetylation plays a key role in suppressing malignant transformation. Moreover, the lower oncogenic potential of the constitutively nuclear PKM2K433Q mutant in the presence of SIRT6 than in the absence of SIRT6 demonstrates PKM2-independent SIRT6 antiproliferative functions.
Fig. 6.
SIRT6 suppresses PKM2-dependent cell proliferation and malignant phenotype. (A) HepG2 SIRT6kd cells (gray bars) or SIRT6/PKM2 double-knockdown cells (blue bars) were stably transfected (pooled hygromycin-resistant population) with a dual expression plasmid encoding FLAG-tagged wild-type SIRT6, FLAG-tagged SIRT6H133Y, PKM2K433Q, and FLAG-tagged wild-type SIRT6 along with PKM2K433Q or PKM2K433R as indicated. HepG2 SIRT6kd or SIRT6/PKM2 double-knockdown cells stably transfected with empty vector served as control. The cells were harvested and counted at the indicated time points. Error bars represent means ± SD of three independent experiments with duplicate samples. (B) The glucose uptake of the cells in A was measured. Error bars represent means ± SD of three independent experiments with duplicate samples. (C) The lactate production of the cells in A was measured. Error bars represent means ± SD of three independent experiments with duplicate samples. (D) The migration potential of the cells in A was measured as the percentage of cells migrating to the bottom chamber. Error bars represent means ± SD of three independent experiments with triplicate samples. (E) In vitro invasion of the cells in A was measured as the percentage of cells migrating to the bottom chamber. Error bars represent means ± SD of three independent experiments with duplicate samples.
Fig. S6.
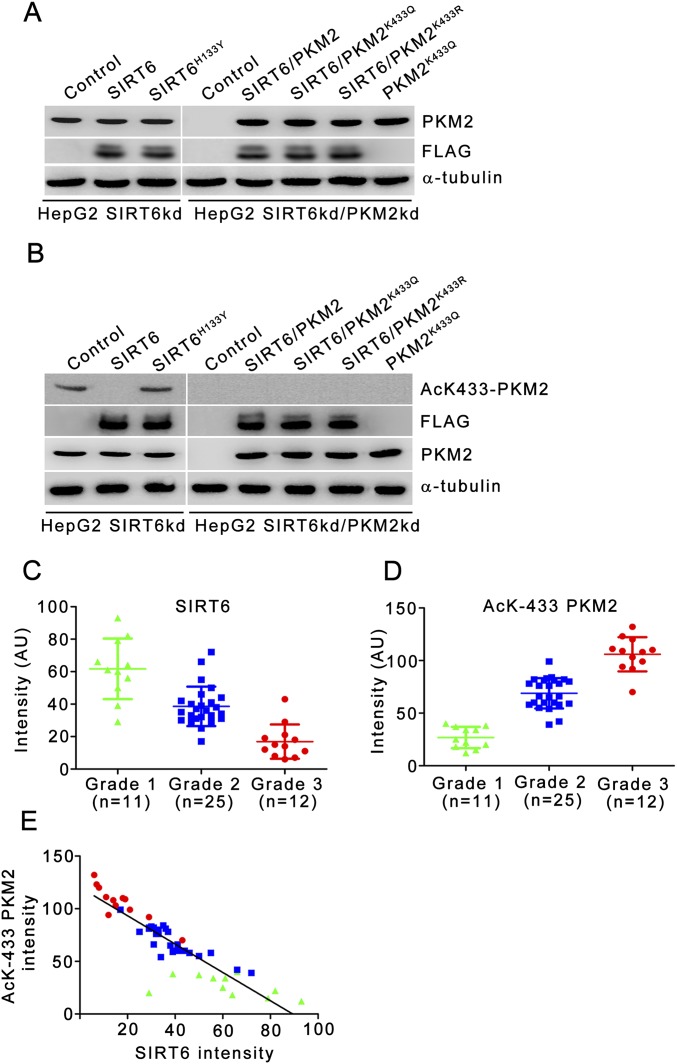
Expression levels of various SIRT6 and PKM2 constructs in stable cell lines and in xenograft tumors and quantitative analysis of SIRT6 and AcK433-PKM2 levels in human liver carcinoma. (A) HepG2 SIRT6kd or SIRT6/PKM2 double-knockdown cells (a pooled hygromycin-resistant population) were stably transfected with a dual expression plasmid encoding FLAG-tagged wild-type SIRT6, FLAG-tagged SIRT6H133Y, PKM2K433Q, FLAG-tagged wild-type SIRT6 along with wild-type PKM2 or PKM2K433Q or PKM2K433R as indicated. HepG2 SIRT6 knockdown or SIRT6/PKM2 double-knockdown cells stably transfected with empty vector served as control. The cells were harvested, and Western blotting was performed for the indicated proteins. (B) Tumor lysates (Fig. 7B) were prepared and analyzed by immunoblotting for the indicated proteins. The data shown are representative of three independent experiments. (C) Quantitation of SIRT6 levels in different grades of human liver carcinoma normalized with respect to matched normal adjacent tissue. The average signal intensity (in arbitrary units, AU) from four random fields was used for the analysis. The data shown are representative of three independent experiments. Error bars represent means ± SD. (D) Quantitation of AcK433-PKM2 levels in different grades of human liver carcinoma normalized with respect to matched normal adjacent tissue. The average signal intensity (in arbitrary units, AU) from four random fields was used for the analysis. The data shown are representative of three independent experiments. Error bars represent means ± SD. (E) Analysis of the correlation between SIRT6 (in C) and AcK433-PKM2 (in D) levels in human liver carcinoma (n = 48; Spearman's coefficient r = −0.8882, P < 0.0001).
Nuclear Export of PKM2 Is a Key Component of SIRT6 Tumor-Suppressor Functions.
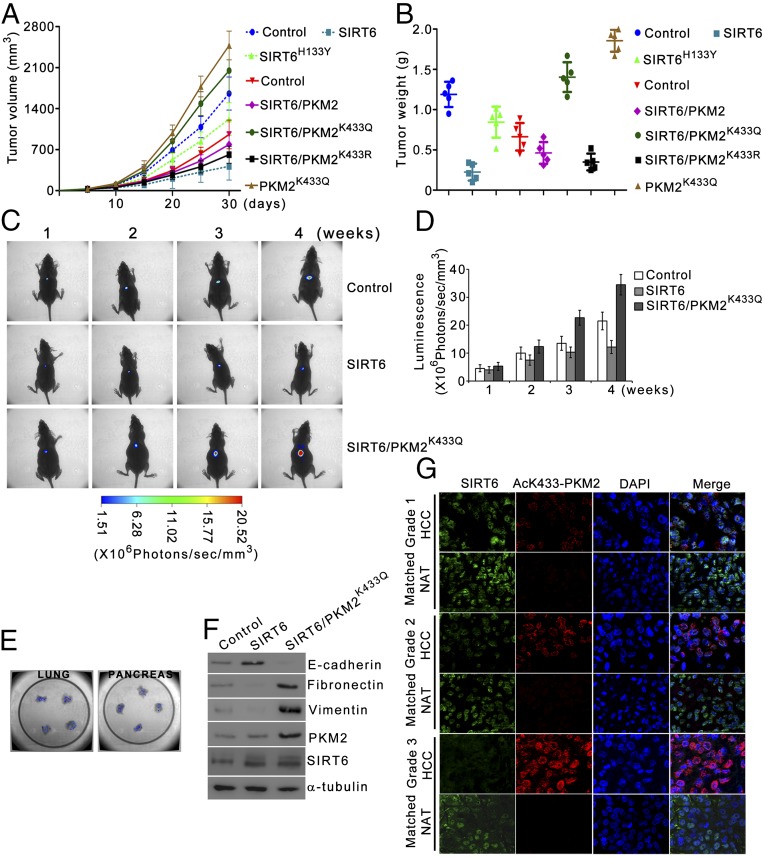
To examine the role of PKM2 in SIRT6-mediated tumor suppression, we examined the tumorigenicity of cells expressing wild-type SIRT6, SIRT6H133Y, PKM2K433Q, and SIRT6 along with PKM2K433Q or PKM2K433R. Cells expressing SIRT6H133Y formed significantly larger tumors than cells expressing SIRT6 (Fig. 7 A and B and Fig. S6B). Additionally, cells expressing SIRT6 along with PKM2K433Q formed much larger tumors than cells expressing SIRT6 along with PKM2K433R. Furthermore, cells expressing PKM2K433Q along with SIRT6 formed smaller tumors than cells expressing PKM2K433Q in the absence of SIRT6. These results suggest that SIRT6-mediated PKM2 deacetylation is critical for SIRT6 tumor-suppressor functions and also demonstrate PKM2-independent SIRT6 tumor-suppressor functions.
Fig. 7.
PKM2 deacetylation is integral to SIRT6 tumor-suppressor functions. (A and B) HepG2 SIRT6kd cells (dashed lines) or SIRT6/PKM2 double-knockdown cells (solid lines) were stably transfected (pooled hygromycin-resistant population) with a dual expression plasmid encoding FLAG-tagged wild-type SIRT6, FLAG-tagged SIRT6H133Y, PKM2K433Q, and FLAG-tagged wild-type SIRT6 along with PKM2K433Q or PKM2K433R as indicated. These cells were s.c. injected into the right flank of nude mice. HepG2 SIRT6kd or SIRT6/PKM2 double-knockdown cells stably transfected with empty vector were used as control. (A) Tumor volume was measured on the indicated days. The data shown are representative of three independent experiments (n = 5 mice per group). Error bars represent means ± SD from five individual mice. (B) At the end of 30 d, tumors were excised and weighed. The data shown are representative of three independent experiments (n = 5 mice per group). Error bars represent means ± SD from five individual mice. (C) HepG2Luc2 cells were stably transfected (pooled hygromycin-resistant population) with a dual expression plasmid encoding wild-type SIRT6 and wild-type SIRT6 along with PKM2K433Q. HepG2Luc2 cells stably transfected with empty vector were used as control. These cells were injected into the liver of nude mice. Bioluminescence imaging was performed weekly; representative images are shown. The data shown are representative of three independent experiments using five individual mice per group. (D) Bioluminescence quantification of the cells in C was performed at the indicated time points. The data shown are representative of three independent experiments (n = 5 mice per group). Error bars represent means ± SD from five individual mice. (E) At the end of 4 wk, lungs and pancreas were collected from the mice orthotopically implanted with cells expressing wild-type SIRT6 along with PKM2K433Q as shown in C, and ex vivo imaging was performed to examine spontaneous metastases in lungs (Left) and pancreas (Right). The data shown are representative of three independent experiments using five individual mice per group. (F) At the end of 4 wk, lysates of primary orthotopic tumors obtained in C were analyzed by immunoblotting for the indicated proteins. The data shown are representative of three independent experiments. (G) Representative images of immunostaining of SIRT6 and AcK433-PKM2 in different grades of human liver carcinoma (HCC) and matched normal adjacent tissue (NAT) sections. DAPI was used to counter stain nucleus.
To investigate further, we examined the metastatic potential of these cells in an orthotopic liver tumor model. Significantly larger orthotopic tumors were formed by cells expressing SIRT6 along with PKM2K433Q than by cells expressing SIRT6 alone (Fig. 7 C and D). Moreover, mice expressing SIRT6 along with PKM2K433Q also developed numerous metastatic nodules in lungs and pancreas (Fig. 7 C and E). Further corroborating this result, in the presence of PKM2K433Q the primary orthotopic tumors exhibited reduced levels of the epithelial marker E-cadherin and elevated levels of mesenchymal markers, including N-cadherin and fibronectin, indicating that these tumors have an increased propensity to metastasize (Fig. 7F). Taken together, these results indicate that SIRT6-mediated PKM2 deacetylation and its nuclear export play a critical role in SIRT6 tumor-suppressor functions.
Because previous studies report an association of SIRT6 with hepatocellular carcinoma (8, 9), we examined the levels of SIRT6 and acetylated K433-PKM2 in different grades of hepatocellular carcinoma. Reduced levels of SIRT6 were observed in hepatocellular carcinoma tissue sections compared with matched normal adjacent tissue sections. Conversely, high levels of AcK433-PKM2 were observed in hepatocellular carcinoma tissue sections compared with matched normal adjacent tissue sections (Fig. 7G). Further analysis revealed that SIRT6 levels decline (Fig. S6C) and AcK433-PKM2 levels increase (Fig. S6D) with increasing tumor grade. Correlation analysis revealed a significant inverse correlation between SIRT6 and AcK433-PKM2 (Fig. S6E). These results highlight the role of SIRT6 deacetylase activity in its tumor-suppressor functions in hepatocellular carcinoma.
Discussion
SIRT6 belongs to the sirtuin family of deacetylases. SIRT6 is known to deacetylate H3K9 and H3K56 to regulate the expression of diverse genes involved in metabolism, aging, and tumorigenesis (3, 4, 7). However, not much is known about the nonhistone substrate repertoire of SIRT6, because only two such substrates have been identified so far. The first nonhistone substrate to be identified was CtIP (5). SIRT6-mediated CtIP deacetylation promotes DNA end resection, a key step in the repair of DNA double-strand breaks by homologous recombination. SIRT6 also deacetylates GCN5, enhancing its acetyltransferase activity. Thus, GCN5 acetylates PGC-1α [peroxisome proliferator-activated receptor (PPARγ) coactivator 1] and attenuates the PGC-1α–mediated gluconeogenic transcriptional program (24). Here we report the characterization of PKM2 as an SIRT6 substrate. SIRT6-mediated PKM2 deacetylation triggers PKM2 nuclear export, and hence its oncogenic functions as a nuclear protein kinase and transcriptional coactivator are suppressed. Thus our findings highlight the key role of deacetylase activity in SIRT6 tumor-suppressor functions and add to its repertoire of nonhistone substrates.
Unlike other pyruvate kinase isoforms, which exist in cells as tetramers, PKM2 exists in cells as both a tetramer and a dimer (25). The tetrameric form has significantly higher affinity for the substrate phosphoenolpyruvate, and hence under physiological conditions the tetrameric form is highly active, whereas the dimeric form is almost inactive. However, the PKM2 dimeric form is beneficial for tumor cells via two different mechanisms. First, dimeric PKM2, being catalytically inactive, allows the cells to accumulate the glycolytic intermediates required for macromolecule biosynthesis to support increased cell proliferation (25). Second, dimeric PKM2 can undergo translocation to nucleus, where it functions as a protein kinase and transcriptional coactivator and promotes proliferation and tumorigenesis (26). Our findings suggest that localization of PKM2 to the nucleus is the dominant of the two mechanisms, because the constitutively nuclear PKM2 mutant (PKM2K433Q) was able to promote cell proliferation even in the presence of SIRT6, but the constitutively cytosolic PKM2 mutant (PKM2K433R) had no significant effect on cell proliferation. PKM2K433Q also promotes migration potential and invasiveness, but PKM2K433R had no such effect. Thus our results suggest that the nuclear functions of PKM2 in regulating transcription play a more significant role in promoting cell proliferation and tumorigenesis than its cytosolic functions in promoting anabolic metabolism.
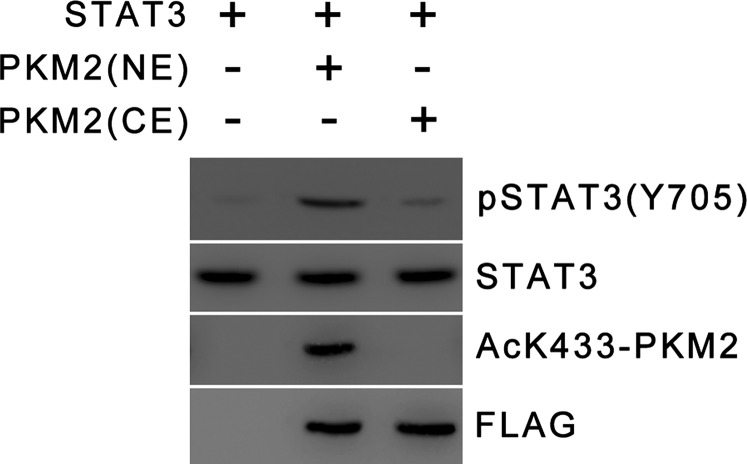
PKM2 undergoes diverse posttranslational modifications, some of which have been reported to regulate PKM2 nuclear localization. SUMO-E3 ligase PIAS3 has been shown to sumoylate PKM2, and both partially colocalize in the nucleus upon transient overexpression (27). However, the pertinence of this modification and its role in PKM2 nuclear localization under physiological conditions are yet to be established. ERK2 has been reported to phosphorylate PKM2 at the Ser37 residue in glioblastoma cells in response to mitogenic signals (28). This phosphorylation promotes PKM2 nuclear localization. Interestingly, ERK2 does not phosphorylate the same site in PKM1. Moreover, no role for this modification has been observed in the regulation of PKM2 nuclear localization under stress conditions. p300 has been reported to acetylate PKM2 at the Lys433 residue in response to oncogenic and mitogenic stimulation in diverse cell types (19). This site is unique to PKM2, and acetylation at this site promotes PKM2 nuclear localization and hence its oncogenic functions as a nuclear protein kinase. Furthermore, K433 acetylation is down-regulated under starvation conditions. Here we report that under starvation conditions SIRT6 deacetylates PKM2 at the K433 residue. K433 deacetylation triggers nuclear export of PKM2. A deacetylase-dead SIRT6 mutant had no effect on PKM2 nuclear localization. Previous studies further suggest that PKM2 exists predominantly in a tetrameric form, which is cytosolic, whereas the nuclear fraction is completely dimeric (17, 19). The tetramer-to-dimer conversion and PKM2 nuclear import are determined by p300-mediated K433 acetylation (19). The mechanistic details underlying p300-mediated PKM2 acetylation and the factors involved in acetylated PKM2 nuclear import are not well understood. Because PKM2 nuclear import is determined by p300-mediated acetylation, nuclear export is suppressed in the absence of SIRT6, but the import process is not augmented. Thus, there is an increase in the PKM2 nuclear fraction in absence of SIRT6, but PKM2 does not become completely nuclear. We further delineated the PKM2 nuclear export mechanism and identified XPO4 as the specific transporter involved in the process. XPO4 is a member of the importin β superfamily and has been reported previously to mediate nuclear export of the eukaryotic translation initiation factor 5A (eIF-5A) and Smad3 (29, 30). Thus our findings demonstrate a unique mechanism of deacetylation-dependent PKM2 nuclear export. Furthermore, our results indicate that acetylated PKM2 exhibits robust protein kinase activity, whereas the unacetylated form exhibits weak protein kinase activity (Fig. S7A). This observation is in accord with previous studies that have reported that unacetylated PKM2 exists as a tetramer, is cytosolic, and exhibits poor protein kinase activity, whereas acetylated PKM2 exists as a dimer, is completely nuclear, and is a robust protein kinase (17, 19). Thus, acetylation also is a key determinant of PKM2 protein kinase activity.
Fig. S7.
Protein kinase activity of PKM2 purified from nuclear and cytoplasmic fractions. Phosphorylation of purified STAT3 by PKM2 immunopurified from nuclear (NE) and cytoplasmic (CE) fractions of HepG2 cells was analyzed by Western blotting for the indicted proteins.
Several previous studies indicate that SIRT6 has tumor-suppressor functions, whereas PKM2 has been reported to promote cell proliferation and tumorigenesis. Based on our characterization of PKM2 as an SIRT6 deacetylase substrate, we examined the role of deacetylase activity in SIRT6 tumor-suppressor functions. Our studies in mouse tumor models revealed that deacetylase activity is critical for SIRT6 tumor-suppressor functions. We also observed that elevated nuclear PKM2 levels promote metastasis, which is abrogated by SIRT6-mediated deacetylation. This finding was corroborated further by our analysis of hepatocellular carcinoma samples, which revealed that SIRT6 levels decline with increasing grades of human liver carcinoma, but nuclear AcK433-PKM2 levels are elevated. In conclusion, our results establish PKM2 as a bona fide SIRT6 deacetylase substrate. SIRT6 deacetylates PKM2 at the K433 residue to trigger its nuclear export, thereby suppressing its oncogenic functions. Thus, our findings provide key mechanistic insights into the SIRT6 tumor-suppressor functions.
Experimental Procedures
GST Pull-Down Assay.
Cells were lysed in lysis buffer [20 mM Tris⋅HCl (pH 7.4), 5 mM EDTA, 10 mM Na4P2O7, 100 mM NaF, 2 mM Na3VO4, 1% (vol/vol) Nonidet P-40, 1 mM PMSF, 1× Protease inhibitor mixture (Roche)]. Cell extract (500 μg) pretreated with micrococcal nuclease (MNase) as described (31) was subjected to GST pull down using glutathione-agarose following the manufacturer’s protocol (Santa Cruz). Subsequent immunoblots were performed as described in SI Experimental Procedures. For the in vitro GST pull-down assay GST, GST-SIRT6, and His-PKM2 were expressed and purified from Escherichia coli BL21. GST pull down then was carried out as described above.
Immunofluorescence.
Cells were fixed with a 4% (wt/vol) paraformaldehyde–PBS solution and permeabilized with 0.2% (vol/vol) Triton X-100 and 0.1% (vol/vol) Tween-20 in PBS. Cells then were blocked with 10% (vol/vol) FBS and incubated at 4 °C overnight. Primary antibody (1:200) and secondary antibody (1:500) were diluted in 0.1% (vol/vol) Tween-20 in PBS and incubated at room temperature for 1 h each. The slides were counterstained with DAPI. The slides were imaged using a Zeiss confocal microscope, and images were analyzed with Zeiss LSM software. The antibodies used were PKM2 (Santa Cruz) and anti-mouse Alexa Fluor 555 (Molecular Probes).
In Vitro Deacetylation Assay.
Recombinant human SIRT6 (4.5 µg) (Sigma Aldrich) was incubated with 1 µg acetylated PKM2 peptide (Sigma Aldrich) in reaction conditions as previously described (1). The reaction mixture was run on an API QSTAR Pulsar I LC/MS/MS System (Applied Biosystems), and the data were analyzed by Analyst QS software. Acetylated PKM2 peptide sequences used in the assay were AcK62: SVETL(AcK)EMIK; AcK305: GDLGIEIPAE(AcK)VFLAQK; and AcK433: CIVLT(AcK)SGRSAHQ.
Glucose Uptake and Lactate Production.
Glucose uptake was measured using the Glucose Uptake Colorimetric Assay Kit (BioVision) according to the manufacturer's instructions. Lactate production was measured using Lactate Colorimetric Assay Kit II (BioVision). Glucose uptake and lactate production were normalized to cell number.
Proliferation Assay.
Cells were plated in triplicate in 12-well plates. At the indicated time points, cells were trypsinized, and the cell suspension was prepared. Equal volumes of the 0.4% (wt/vol) trypan blue solution and the cell suspension were mixed thoroughly, and unstained healthy cells were counted using a hemocytometer.
Transwell Migration Assay.
Cell migration was measured using the Cultrex cell migration assay (Trevigen). Briefly, cells were plated in the upper chamber of a 24-well Transwell plate. The lower chamber contained DMEM medium with 10% (vol/vol) FBS. After 24 h, the cells were collected in a cell-dissociation solution containing 1 μM of Calcein-AM. Percentages of migrated cells were calculated from the standard curve established for respective cell lines.
Transwell Invasion Assay.
Cell invasion through basement membranes was assayed using the CultreCoat BME-coated cell invasion assay (Trevigen). Initial rehydration of the membranes was performed, followed by the methods described in the migration assay.
Animal Experiments.
All animal protocols were approved by the Institutional Animal Care and Use Committee of National Institute of Immunology, New Delhi. For further details, please refer to SI Experimental Procedures.
SI Experimental Procedures
Cell Lines, Culture Conditions, and Transfection.
HepG2 cells were cultured in DMEM containing FBS (Invitrogen), 100 U/mL penicillin, and 100 μg/mL streptomycin at 37 °C. Recombinant adenoviruses were amplified and titrated as previously reported (32). Cells were grown to ∼50–70% confluency and were infected with recombinant adenovirus at a multiplicity of infection (MOI) of 10–20 for the indicated time. GFP-expressing adenovirus (Ad-GFP) was used as a negative control. To induce glucose starvation, cells were grown to ∼50% confluency and then were cultured in glucose-free DMEM (Invitrogen) containing dialyzed FBS (Invitrogen) and 5 mM glucose (Sigma). To induce serum starvation, cells were grown to ∼50% confluency and then were cultured in serum-free DMEM (Invitrogen). Transfections were carried out using Lipofectamine 3000 (Invitrogen) for HepG2 cells and Lipofectamine 2000 (Invitrogen) for other cell lines according to the manufacturer’s instructions. In transient transfection experiments the amount of plasmid DNA was kept constant with empty vector. Early-passage mouse embryonic fibroblasts (MEFs) were cultured, and retroviral transduction was carried out as described previously (33).
Plasmids and shRNA.
For domain mapping, GST fusion proteins expressing different SIRT6 and PKM2 domains as well as full-length SIRT6 and PKM2 were cloned in the pEBG vector. FLAG-tagged SIRT6 was kindly provided by Katrin Chua, Stanford University, Stanford, CA. FLAG-tagged SIRT6H133Y and FLAG-tagged PKM2 were obtained from Addgene. For stable expression of wild-type SIRT6 along with PKM2 mutants, the cDNAs were cloned in the dual expression plasmid pVITRO1 (Invivogen). Recombinant adenoviruses expressing SIRT6-HA-FLAG, SIRT6H133Y-FLAG, PKM2-FLAG, and PKM2K433Q were generated as described previously (32).
Vectors expressing shRNA against human SIRT6 (CCCCCTACAGCCCACCCTA), scrambled for human SIRT6 (GACCCCACTCCCCCTACCA), human PKM2 (CCAGATGGCAAGAGGGTGA), scrambled for human PKM2 (GCAGGAGGGACGGATCTAA), human XPO1 (GCTCAAGAAGTACTGACACAT), scrambled for human XPO1 (GGTACGAACATACGACCTTAA), human XPO4 (GTCAGCCAGTTGATTAGTAGT), scrambled for human XPO4 (GCTGGAATTCTGGGATATCTA), human XPO7 (CAGCCTACAGCACTGGGAATTTGCT), scrambled for human XPO7 (GCTAGCTATCGCCCTAACGAGTTGA), mouse SIRT6 (TGCATGTTTCGTATAAGTTT), scrambled for mouse SIRT6 (GATGTCTGTACTGATTATTT), mouse PKM2 (CGCTTACATGGAGAAGTGT), and scrambled for mouse PKM2 (GTCCGGATTTCAGGATAGA) were generated using the psiRNA-DUO plasmid (Invivogen). The shRNAs targeting human genes were designed against the 3′ UTR of the transcript and hence cannot target ectopically expressed genes.
Sequential Immunoprecipitation and LC/MS-MS.
HepG2 cells were infected with recombinant adenovirus expressing SIRT6 tagged with FLAG and HA epitopes. Ad-GFP was used as a negative control. Nuclear extracts were prepared 24 h after infection. Nuclear extracts were immunoprecipitated with anti-FLAG antibody-conjugated agarose beads (Santa Cruz) and were eluted with 3× FLAG peptide (Sigma). The eluate was subjected to a second immunoprecipitation using anti-HA antibody–conjugated agarose beads (Santa Cruz) followed by elution with HA peptide (Sigma). The final eluate was resolved by SDS/PAGE and visualized by silver staining. The bands were excised from SDS/PAGE gel, fully trypsinized, and analyzed by reverse-phase LC-MS/MS. MS was carried out at Proteomics International, Australia, and data were processed using the comparative proteomics analysis software suite MASCOT.
Western Blot and Immunoprecipitation.
Cells were lysed in lysis buffer [20 mM Tris⋅HCl (pH 7.4), 5 mM EDTA, 10 mM Na4P2O7, 100 mM NaF, 2 mM Na3VO4, 1% (vol/vol) Nonidet P-40, 1 mM PMSF, 1× Protease inhibitor mixture (Roche)]. Equal amounts of proteins per sample were subjected to SDS/PAGE and transferred to a PVDF membrane (Millipore). The following antibodies were used: β-actin (Santa Cruz), α-tubulin (Santa Cruz), GST (Santa Cruz), FLAG tag (Santa Cruz), SIRT6 (Cell Signaling Technology), PKM2 (Santa Cruz), XPO1 (Santa Cruz), XPO4 (Santa Cruz), XPO7 (Santa Cruz), β-catenin (Santa Cruz), STAT3 (Santa Cruz), Y705 phospho STAT3 (Santa Cruz), H3 (Santa Cruz), pH3T11 (Abcam), fibronectin (Santa Cruz), E-cadherin (Santa Cruz), Vimentin (Santa Cruz), and N-cadherin (Santa Cruz). Polyclonal antibody specific for PKM2 acetylated at lysine 433 was generated (ABGENEX Pvt. Ltd). Briefly, rabbits were immunized with the acetylated human PKM2 peptide (428- CIVLT(AcK)SGRSAHQ-440). Antisera from the immunized rabbits were affinity purified using the nonacetylated peptide followed by the acetylated peptide. Immunoprecipitations were performed using 500 μg of cell extracts pretreated with MNase as described (31) and incubated with antibodies as indicated. Subsequent immunoblots were performed as described above.
In Vitro Protein Kinase Assay.
FLAG-PKM2 (10 μg/mL) immunopurified from nuclear or cytoplasmic extracts of HepG2 cells was incubated with 10 μg/mL purified STAT3 (OriGene) in reaction conditions as previously described (17). Protein kinase activity was analyzed by Western blotting for total and phosphorylated STAT3 (Y705).
RT-qPCR.
Total RNA was extracted using TRIzol (Invitrogen). cDNA synthesis was carried out using the iScript cDNA synthesis kit (Bio-Rad) following the manufacturer’s protocol. qPCR then was carried out using Maxima SYBR Green Master Mix (Fermentas) in an Eppendorf Real-time PCR machine. 18S rRNA was used as the internal control for all samples. For other genes the following primers were used: human MEK5: CCAGAACATGTCCTTGGAAGA and CACCAGCTGAGTGCTAACTCC; human Cyclin D1: AAGGCGGAGGAGACCTGCGCG and ATCGTGCGGCATTGCGGC; human SOCS3: GGAGACTTCGATTCGGGACC and GAAACTTGCTGTGGGTGACC; human ICAM1: GGCCGGCCAGCTTATACAC and TAGACACTTGAGCTCGGGCA; human MMP7: CATGAGTGAGCTACAGTGGGAACA and GCCTTTGACACTAATCGATCCACT; human DKK1: CAGTAATTCTTCTAGGCTTCAC and CAAGAGATCCTTGCGTTCTAGGAC; human PFKM: GGAGAGCGTTTCGATGATGC and TCGGAGTCGTCCTTCTCGTT; human RPL3: CATCCGTGTCATTGCCCACA and TGCCCAAACACTTGGTTCAC; human RPL6: GGCATCCAGTCGACACCTAC and ACTTTTTCACCCGCCATCCT; mouse MEK5: GGGCCATCTCAACACACCAG and TGTCTCGATACCGTATGTCTTGT; mouse Cyclin D1: ACCTGGGCAGCCCCAACAAC and GGAGGCAGTCCGGGTCACACT; mouse SOCS3: GCTCCAAAAGCGAGTACCAGC and AGTAGAATCCGCTCTCCTGCAG; mouse ICAM1: GTGGCGGGAAAGTTCCTG and CGTCTTGCAGGTCATCTTAGGAG; mouse MMP7: GCGGAGATGCTCACTTTGAC and GCATCTATCACAGCGTGTTC; mouse DKK1: TCCCAGAAGAACCACACTGACTTC and TCTTGGACCAGAAGTCTCTTGCAC. The ΔΔCt method was used to analyze RT-qPCR data.
ChIP Assay.
ChIP was carried out using a kit following the manufacturer’s protocol (Millipore). Briefly, 1 × 10⁷ cells were fixed with formaldehyde and lysed with SDS lysis buffer supplemented with protease and deacetylase inhibitors. The cell lysates then were sonicated to shear the DNA to lengths of 0.2–1 kb. The samples were precleared with Protein A agarose/Salmon sperm DNA slurry. Control IgG (Santa Cruz), STAT3 (Santa Cruz), or β-catenin (Santa Cruz) antibody was added and incubated overnight at 4 °C followed by incubation with fresh Protein A agarose/Salmon sperm DNA slurry for 2 h. Precipitated chromatin complexes were removed from the beads by 30-min incubation with 500 μL of elution buffer (1% SDS, 0.1 M NaHCO3). Finally, the protein–DNA cross-links were reversed by incubation at 65 °C for 4 h, and immunoprecipitated DNA was analyzed by qPCR. For re-ChIP experiments, a part of the chromatin complexes immunoprecipitated with anti-STAT3 or anti–β-catenin antibody were eluted by incubation for 30 min at 37 °C in 100 μL of 10 mM DTT instead of elution buffer. After centrifugation, the supernatant was diluted 20 times with ChIP dilution buffer and immunoprecipitated with control IgG or PKM2 antibody (Santa Cruz) followed again by the ChIP procedure. The primers used for this analysis were MEK5: GTGGGAGAGATTTAATGGTC and GTTACCAGATGTGTTCACCAC; Cyclin D1: GGGGCGATTTGCATTTCTAT and CGGTCGTTGAGGAGGTTGG; SOCS3: GTTCCAGGAATCGGGGGGCGGG and CGGCTGGCTGCGTGCGGGGC; ICAM1: TGGAGGCCGGGAGCAG and AAACCTCGCGCCTTCCC; MMP7: TTGTGTGCTTCCTGCCAATA and TCGAAGAGTCGGAGCTTACA; DKK1: GGCCACTTTGATCTCACGCGTC and CTGGGAACTTGGGTGCCCTTGCC.
ChIP assays for SIRT6, H3K56ac, and H3K9ac were carried out as described previously (7).
Xenograft Studies.
Female nude (nu/nu) mice were s.c. injected in the right flank with 4 × 10⁶ cells/0.15 mL of serum-free DMEM. Tumors were allowed to develop for 30 d. Tumor volume was determined by direct measurement with a caliper and was calculated using the formula: (widest diameter × smallest diameter2)/2. At the end of the experiment, the mice were killed by carbon dioxide. The tumors were harvested and weighed. Tumor lysates were prepared, and Western blot analysis was performed as described above.
In Vivo Metastasis Assay.
HepG2Luc2 cells were generated by stably transfecting HepG2 cells (a pooled neomycin-resistant population) with the pGL4.51[luc2/CMV/Neo] vector (Promega). Cells were resuspended in serum-free DMEM with 10% (vol/vol) Matrigel at a concentration of 2 × 10⁶ cells/0.1 mL. The cell suspension was injected orthotopically into the liver of female nude mice. Tumors were allowed to develop for 4 wk. For weekly in vivo bioluminescence imaging, mice were anesthetized using ketamine (80 mg/kg) and xylaxine (10 mg/kg) by i.p. injection. Anesthetized animals were i.p. administered 150 mg/kg d-luciferin in PBS. Imaging was performed in a Kodak FX Pro imaging system, and images were analyzed using Carestream imaging software. An X-ray image was taken followed by acquisition and overlay of the pseudocolor image representing the spatial distribution of detected photon counts emerging from active luciferase within the animal. Camera settings were kept constant during all measurements. At the end of the experiment, the mice were killed, primary tumors were harvested, and immunoblotting was performed as described above. The lungs and pancreas were harvested, and ex vivo imaging was performed.
Tissue Microarrays.
Human liver carcinoma and matched normal adjacent tissue sections were obtained from US Biomax as tissue microarrays. Immunofluorescence was performed as described previously (34). Briefly, 4-μm paraffin sections were dewaxed and immunostained with 1:100 SIRT6 antibody (Millipore) or 1:100 AcK-433 PKM2. Secondary detection was carried out using anti-mouse Alexa Fluor 488 (Molecular Probes) or anti-rabbit Alexa Fluor 555 antibody (Molecular Probes). Slides were mounted with ProLong Gold antifade reagent with DAPI (Molecular Probes). Slides were imaged using a Zeiss ApoTome microscope, and images were analyzed with the Zeiss Zen Blue software. Quantitative analysis of immunofluorescence staining was performed using ImageJ software. The average signal intensity (in arbitrary units, AU) from four random fields was used for the analysis. Student’s t test was used for data analysis.
Acknowledgments
We thank the members of the Molecular Oncology Laboratory for helpful discussions and Dr. Pushkar Sharma, National Institute of Immunology, India for help with confocal microscopy. Financial support was received from the National Institute of Immunology Core Fund. A.B. was supported by a fellowship from the Department of Biotechnology, Government of India.
Footnotes
The authors declare no conflict of interest.
This article is a PNAS Direct Submission.
This article contains supporting information online at www.pnas.org/lookup/suppl/doi:10.1073/pnas.1520045113/-/DCSupplemental.
References
- 1.Michishita E, et al. SIRT6 is a histone H3 lysine 9 deacetylase that modulates telomeric chromatin. Nature. 2008;452(7186):492–496. doi: 10.1038/nature06736. [DOI] [PMC free article] [PubMed] [Google Scholar]
- 2.Michishita E, et al. Cell cycle-dependent deacetylation of telomeric histone H3 lysine K56 by human SIRT6. Cell Cycle. 2009;8(16):2664–2666. doi: 10.4161/cc.8.16.9367. [DOI] [PMC free article] [PubMed] [Google Scholar]
- 3.Kawahara TL, et al. SIRT6 links histone H3 lysine 9 deacetylation to NF-kappaB-dependent gene expression and organismal life span. Cell. 2009;136(1):62–74. doi: 10.1016/j.cell.2008.10.052. [DOI] [PMC free article] [PubMed] [Google Scholar]
- 4.Zhong L, et al. The histone deacetylase Sirt6 regulates glucose homeostasis via Hif1alpha. Cell. 2010;140(2):280–293. doi: 10.1016/j.cell.2009.12.041. [DOI] [PMC free article] [PubMed] [Google Scholar]
- 5.Kaidi A, Weinert BT, Choudhary C, Jackson SP. Human SIRT6 promotes DNA end resection through CtIP deacetylation. Science. 2010;329(5997):1348–1353. doi: 10.1126/science.1192049. [DOI] [PMC free article] [PubMed] [Google Scholar] [Retracted]
- 6.Mao Z, et al. SIRT6 promotes DNA repair under stress by activating PARP1. Science. 2011;332(6036):1443–1446. doi: 10.1126/science.1202723. [DOI] [PMC free article] [PubMed] [Google Scholar]
- 7.Sebastián C, et al. The histone deacetylase SIRT6 is a tumor suppressor that controls cancer metabolism. Cell. 2012;151(6):1185–1199. doi: 10.1016/j.cell.2012.10.047. [DOI] [PMC free article] [PubMed] [Google Scholar]
- 8.Min L, et al. Liver cancer initiation is controlled by AP-1 through SIRT6-dependent inhibition of survivin. Nat Cell Biol. 2012;14(11):1203–1211. doi: 10.1038/ncb2590. [DOI] [PubMed] [Google Scholar]
- 9.Marquardt JU, et al. Sirtuin-6-dependent genetic and epigenetic alterations are associated with poor clinical outcome in hepatocellular carcinoma patients. Hepatology. 2013;58(3):1054–1064. doi: 10.1002/hep.26413. [DOI] [PMC free article] [PubMed] [Google Scholar]
- 10.Kugel S, et al. Identification of and Molecular Basis for SIRT6 Loss-of-Function Point Mutations in Cancer. Cell Reports. 2015;13(3):479–488. doi: 10.1016/j.celrep.2015.09.022. [DOI] [PMC free article] [PubMed] [Google Scholar]
- 11.Christofk HR, Vander Heiden MG, Wu N, Asara JM, Cantley LC. Pyruvate kinase M2 is a phosphotyrosine-binding protein. Nature. 2008;452(7184):181–186. doi: 10.1038/nature06667. [DOI] [PubMed] [Google Scholar]
- 12.Desai S, et al. Tissue-specific isoform switch and DNA hypomethylation of the pyruvate kinase PKM gene in human cancers. Oncotarget. 2014;5(18):8202–8210. doi: 10.18632/oncotarget.1159. [DOI] [PMC free article] [PubMed] [Google Scholar]
- 13.Xu Q, Liu X, Zheng X, Yao Y, Liu Q. PKM2 regulates Gli1 expression in hepatocellular carcinoma. Oncol Lett. 2014;8(5):1973–1979. doi: 10.3892/ol.2014.2441. [DOI] [PMC free article] [PubMed] [Google Scholar]
- 14.Steták A, et al. Nuclear translocation of the tumor marker pyruvate kinase M2 induces programmed cell death. Cancer Res. 2007;67(4):1602–1608. doi: 10.1158/0008-5472.CAN-06-2870. [DOI] [PubMed] [Google Scholar]
- 15.Hoshino A, Hirst JA, Fujii H. Regulation of cell proliferation by interleukin-3-induced nuclear translocation of pyruvate kinase. J Biol Chem. 2007;282(24):17706–17711. doi: 10.1074/jbc.M700094200. [DOI] [PubMed] [Google Scholar]
- 16.Yang W, et al. Nuclear PKM2 regulates β-catenin transactivation upon EGFR activation. Nature. 2011;480(7375):118–122. doi: 10.1038/nature10598. [DOI] [PMC free article] [PubMed] [Google Scholar]
- 17.Gao X, Wang H, Yang JJ, Liu X, Liu ZR. Pyruvate kinase M2 regulates gene transcription by acting as a protein kinase. Mol Cell. 2012;45(5):598–609. doi: 10.1016/j.molcel.2012.01.001. [DOI] [PMC free article] [PubMed] [Google Scholar]
- 18.Yang W, et al. PKM2 phosphorylates histone H3 and promotes gene transcription and tumorigenesis. Cell. 2012;150(4):685–696. doi: 10.1016/j.cell.2012.07.018. [DOI] [PMC free article] [PubMed] [Google Scholar]
- 19.Lv L, et al. Mitogenic and oncogenic stimulation of K433 acetylation promotes PKM2 protein kinase activity and nuclear localization. Mol Cell. 2013;52(3):340–352. doi: 10.1016/j.molcel.2013.09.004. [DOI] [PMC free article] [PubMed] [Google Scholar]
- 20.Kanfi Y, et al. Regulation of SIRT6 protein levels by nutrient availability. FEBS Lett. 2008;582(5):543–548. doi: 10.1016/j.febslet.2008.01.019. [DOI] [PMC free article] [PubMed] [Google Scholar]
- 21.Kim HS, et al. Hepatic-specific disruption of SIRT6 in mice results in fatty liver formation due to enhanced glycolysis and triglyceride synthesis. Cell Metab. 2010;12(3):224–236. doi: 10.1016/j.cmet.2010.06.009. [DOI] [PMC free article] [PubMed] [Google Scholar]
- 22.Lv L, et al. Acetylation targets the M2 isoform of pyruvate kinase for degradation through chaperone-mediated autophagy and promotes tumor growth. Mol Cell. 2011;42(6):719–730. doi: 10.1016/j.molcel.2011.04.025. [DOI] [PMC free article] [PubMed] [Google Scholar]
- 23.Pemberton LF, Paschal BM. Mechanisms of receptor-mediated nuclear import and nuclear export. Traffic. 2005;6(3):187–198. doi: 10.1111/j.1600-0854.2005.00270.x. [DOI] [PubMed] [Google Scholar]
- 24.Dominy JE, Jr, et al. The deacetylase Sirt6 activates the acetyltransferase GCN5 and suppresses hepatic gluconeogenesis. Mol Cell. 2012;48(6):900–913. doi: 10.1016/j.molcel.2012.09.030. [DOI] [PMC free article] [PubMed] [Google Scholar]
- 25.Mazurek S. Pyruvate kinase type M2: A key regulator of the metabolic budget system in tumor cells. Int J Biochem Cell Biol. 2011;43(7):969–980. doi: 10.1016/j.biocel.2010.02.005. [DOI] [PubMed] [Google Scholar]
- 26.Tamada M, Suematsu M, Saya H. Pyruvate kinase M2: Multiple faces for conferring benefits on cancer cells. Clin Cancer Res. 2012;18(20):5554–5561. doi: 10.1158/1078-0432.CCR-12-0859. [DOI] [PubMed] [Google Scholar]
- 27.Spoden GA, et al. The SUMO-E3 ligase PIAS3 targets pyruvate kinase M2. J Cell Biochem. 2009;107(2):293–302. doi: 10.1002/jcb.22125. [DOI] [PubMed] [Google Scholar]
- 28.Yang W, et al. ERK1/2-dependent phosphorylation and nuclear translocation of PKM2 promotes the Warburg effect. Nat Cell Biol. 2012;14(12):1295–1304. doi: 10.1038/ncb2629. [DOI] [PMC free article] [PubMed] [Google Scholar]
- 29.Lipowsky G, et al. Exportin 4: A mediator of a novel nuclear export pathway in higher eukaryotes. EMBO J. 2000;19(16):4362–4371. doi: 10.1093/emboj/19.16.4362. [DOI] [PMC free article] [PubMed] [Google Scholar]
- 30.Kurisaki A, et al. The mechanism of nuclear export of Smad3 involves exportin 4 and Ran. Mol Cell Biol. 2006;26(4):1318–1332. doi: 10.1128/MCB.26.4.1318-1332.2006. [DOI] [PMC free article] [PubMed] [Google Scholar]
- 31.Groisman R, et al. The ubiquitin ligase activity in the DDB2 and CSA complexes is differentially regulated by the COP9 signalosome in response to DNA damage. Cell. 2003;113(3):357–367. doi: 10.1016/s0092-8674(03)00316-7. [DOI] [PubMed] [Google Scholar]
- 32.Das S, Somasundaram K. Therapeutic potential of an adenovirus expressing p73 beta, a p53 homologue, against human papilloma virus positive cervical cancer in vitro and in vivo. Cancer Biol Ther. 2006;5(2):210–217. doi: 10.4161/cbt.5.2.2402. [DOI] [PubMed] [Google Scholar]
- 33.Jones RG, et al. AMP-activated protein kinase induces a p53-dependent metabolic checkpoint. Mol Cell. 2005;18(3):283–293. doi: 10.1016/j.molcel.2005.03.027. [DOI] [PubMed] [Google Scholar]
- 34.Lei Q, et al. NKX3.1 stabilizes p53, inhibits AKT activation, and blocks prostate cancer initiation caused by PTEN loss. Cancer Cell. 2006;9(5):367–378. doi: 10.1016/j.ccr.2006.03.031. [DOI] [PubMed] [Google Scholar]


