Significance
Cells orient their motility along chemical gradients using sensitive measurements of the external environment, a process termed chemotaxis. How cells sense, respond to, and remember varying environmental stimuli is only just beginning to be understood. Here, we identify a directional memory in chemotactic neutrophil-like cells. This memory allows cells to orient in low signal gradients and even uniform environments. This memory can be modeled by distinct time scales of chemical sensing and cytoskeletal dynamics, pointing to a general strategy of separating time scales for robust behavioral dynamics in cellular systems. Disrupting specific long-lived molecular assemblies erases directional memory. These studies reveal a novel directional memory resulting from distinct molecular time scales and contributing to chemotactic robustness in migrating cells.
Keywords: confined cell migration, moesin, microtubules, chemotaxis, cell polarization
Abstract
Chemotaxis, the directional migration of cells in a chemical gradient, is robust to fluctuations associated with low chemical concentrations and dynamically changing gradients as well as high saturating chemical concentrations. Although a number of reports have identified cellular behavior consistent with a directional memory that could account for behavior in these complex environments, the quantitative and molecular details of such a memory process remain unknown. Using microfluidics to confine cellular motion to a 1D channel and control chemoattractant exposure, we observed directional memory in chemotactic neutrophil-like cells. We modeled this directional memory as a long-lived intracellular asymmetry that decays slower than observed membrane phospholipid signaling. Measurements of intracellular dynamics revealed that moesin at the cell rear is a long-lived element that when inhibited, results in a reduction of memory. Inhibition of ROCK (Rho-associated protein kinase), downstream of RhoA (Ras homolog gene family, member A), stabilized moesin and directional memory while depolymerization of microtubules (MTs) disoriented moesin deposition and also reduced directional memory. Our study reveals that long-lived polarized cytoskeletal structures, specifically moesin, actomyosin, and MTs, provide a directional memory in neutrophil-like cells even as they respond on short time scales to external chemical cues.
Directed cell motion underlies important functions in development, immunology, and resource foraging (1). The local cues for cellular orientation are chemical, either in the form of soluble gradients or substrate-bound moieties (2, 3), or physical, in the form of pressure, substrate adhesion, etc. (4, 5). In particular, chemical cues activate signaling at the cell surface and are integrated within the cell cytoplasm to give rise to a polarization in the direction of the local gradient. Although these processes have been the subject of detailed experimental study and theoretical and computational modeling, the mechanisms by which this orientation is achieved and maintained in the face of environmental noise remains incomplete.
Although migration might be thought of as being very sensitive to the variations in the external environment, instead, we see robust migration in a variety of fluctuating environments. These observations all point to the existence of a directional memory in chemotactic cells—a biochemical pathway that stores information about cellular orientation and prevents the loss of orientation in the face of fluctuations, transient loss of polarization, or saturation of the receptors. For example, recent work has demonstrated memory-based behavior in Dictyostelium amoebae under fluctuating waves of chemoattractant (6, 7), although the authors do not identify potential molecular elements that store this information.
Here, we use microchannel-based microfluidic devices to observe cell polarization and movement in confined mammalian neutrophil-like cells. Cells in this environment exhibit a strong bias to repolarize in the previous direction of motion after a period of depolarization. This memory is time-dependent and decays when the cell is unstimulated. To describe these results, we construct a minimal phenomenological model coupling membrane and cytoskeletal polarization lifetimes and show that this model provides a potential basis for this memory. We also show that the cytoskeletal ERM (Ezrin, Radixin, Moesin) family protein moesin has a long turnover time, in comparison with membrane phospholipid signaling, and that moesin inhibition results in a loss of memory. Depolymerization of microtubules (MTs) also disrupts memory, but by disrupting moesin localization, or reorienting the potential memory element. This membrane–cytoskeletal system acts to keep cells biased in their orientation based on previous signaling history potentially driving directed motility in noisy gradients.
Results
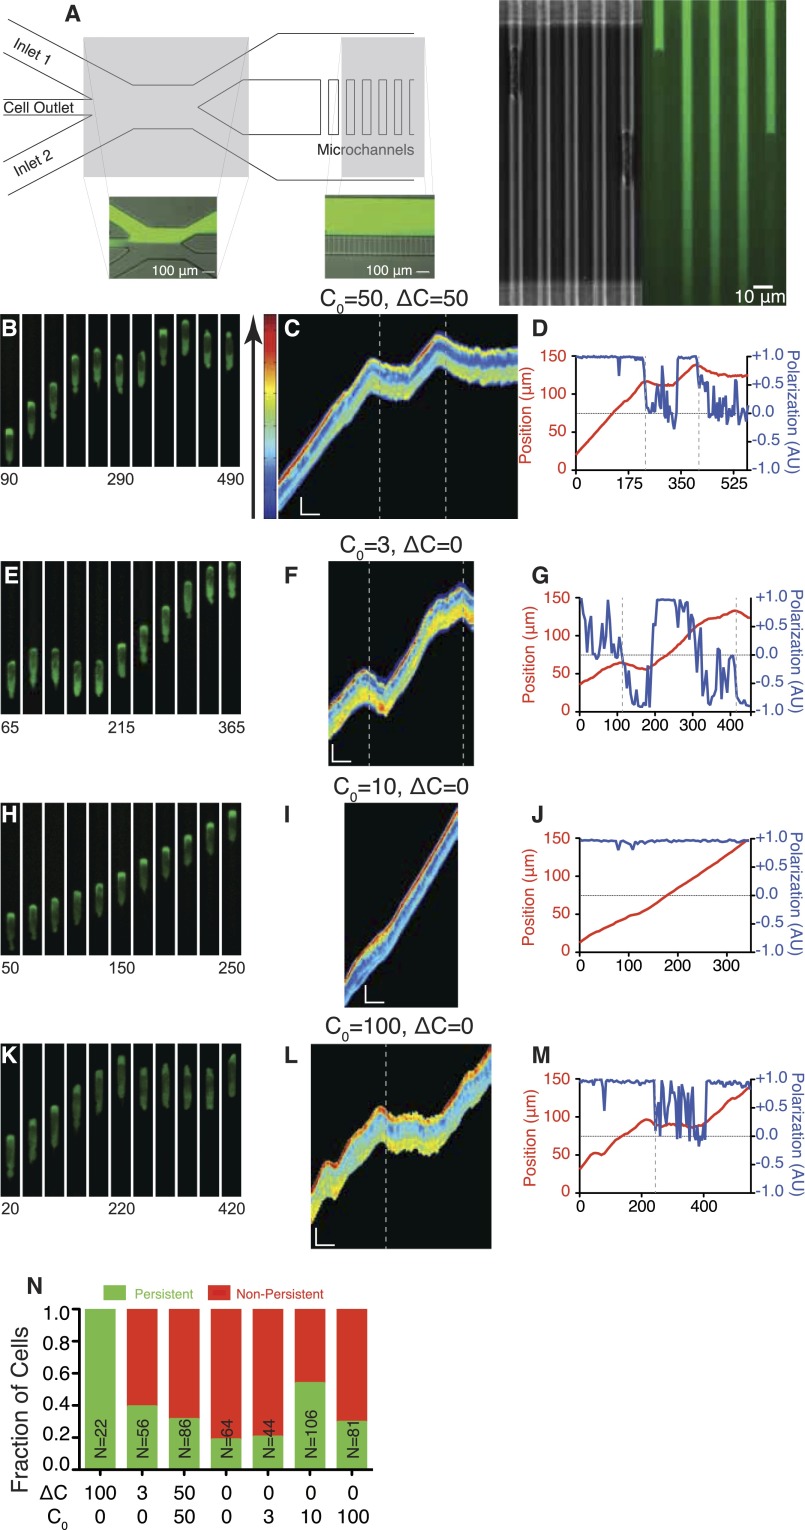
We adapted microfluidic devices that confine cell migration to a 1D geometry to allow independent and controlled exposure of chemoattractant to each side of the cell (Fig. S1A) (5, 8). Cells enter microchannels that connect two external reservoirs that maintain chemoattractant concentrations at each end. The microchannels are small enough (3 µm × 5 µm) that a single cell fills the cross-sectional area of the channel and acts as a barrier for fluid flow and diffusion, maintaining the concentration difference across the cell (Fig. S1A). Thus, the cell is exposed to differences between chemoattractant concentrations across it, and motion is restricted to 1D (up and down the channel). Moreover, the chemical exposure and cell geometry remain constant during cell motion, thus creating a stable fixed difference across the cell.
Fig. S1.
Device design and cellular response to static chemical environments. (A) Diagram of device geometry. Two inlet channels are used to introduce chemokine solutions into the device. The cell outlet channel is used when cells are introduced into the device from the outlet, downstream of the microchannel region. Insets demonstrate the positioning of the interface between the two inlet flows to balance pressure and maintain concentration difference across the microchannels. Fluorescein dye was used to visualize the separate streams. Inset shows a cell occluding a microchannel, resulting in build up of chemokine in front, as well as a microchannel without a cell resulting in a gradient of dye along the length of the channel. (B, E, H, and K) Montages of cells expressing PH-Akt-GFP in the conditions C0 = 50, ΔC = 50 (B); C0 = 3, ΔC = 0 (E); C0 = 10, ΔC = 0 (H); and C0 = 100, ΔC = 0 (K). (C, F, I, and L) Kymographs of cells shown in montages. Kymographs are false-colored according to the color bar shown on the left to better visualize differences in PH-Akt intensity. (Vertical scale bar: 15 μm; horizontal scale bar: 100 s.) (D, G, J, and M) Plots of cell centroid and PH-Akt polarization for corresponding montages. (N) Fraction of persistently polarized (green) and not persistently polarized (red) in the static conditions tested. Vertical dashed lines were added to both kymographs and time plots to represent the time at which the cell was determined to have de-polarized.
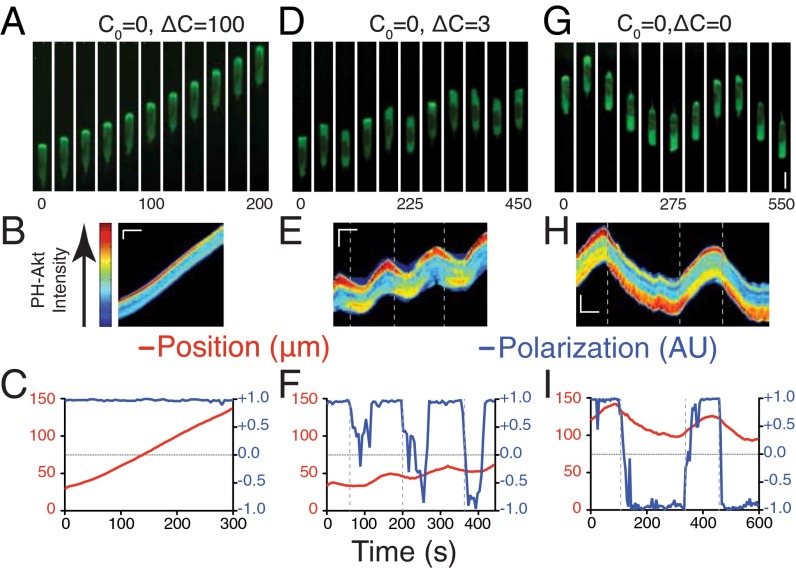
We subjected HL-60 (neutrophil-like) (9) cells to chemoattractant differences in formylated Met-Leu-Phe (fMLP). C0 designates the concentration in the lower reservoir (i.e., [lower]), and ΔC designates the difference (i.e., [upper] − [lower]). For a 0–100 nM difference (C0 = 0 nM and ΔC = 100 nM), cells showed strong polarization toward the higher fMLP concentration, as seen by both morphology and the accumulation of PH-Akt-EGFP at the leading edge of the motile cell [marking PIP3 lipids (10)] (Fig. 1 A and B and Movie S1). Quantitative analysis of cell polarization (11) and motility showed persistence in both measures (SI Experimental Procedures) for all cells measured (Fig. 1C). When cells were exposed to a smaller difference, cells were far less persistent (C0 = 0 nM, ΔC = 3 nM; Fig. 1 D and E and Movie S2). Quantitative analysis of cell polarization and motility showed fluctuations in both measures (Fig. 1F). The value 3 nM was chosen because it is well below the equilibrium dissociation constant (Kd) of the ligand fMLP for its receptor (10–15 nM) (12). Notably, cells that lose polarization exhibit a small motion opposite to their original direction of motion, a relaxation of its morphology, not a directed motion. Under saturating conditions (C0 = 50 nM, ΔC = 50 nM), where the background concentration of 50 nM is well above the receptor–ligand Kd (Fig. S1 B and C and Movie S3), we observed polarization persistence and directional changes similar to those seen for small differences (Fig. S1D).
Fig. 1.
Cellular response to static chemical environments. (A) Montages of cells expressing PH-Akt-GFP in the conditions C0 = 0, ΔC = 100. (B) Kymograph of cell shown in A, false-colored according to the color bar shown on the left. (C) Plots of cell centroid and PH-Akt polarization (Experimental Procedures) for corresponding montage and kymograph. (D–F) Montage (D), kymograph (E), and plots (F) for a cell in the condition C0 = 0, ΔC = 3. (G–I) Montage (G), kymograph (H), and plots (I) for a cell in the condition C0 = 0, ΔC = 0 (C). (Vertical scale for montages: A, D, and G, 10 μm; vertical scale bar for kymographs: B, E, and H, 15 μm; horizontal scale bar for kymographs: B, E, and H, 100 s.) Vertical dashed lines were added to both kymographs and time plots to represent the time at which the cell was determined to have depolarized.
Chemotactic cells can also undergo spontaneous polarization and motility in the absence of an external gradient, likely because of activation by extracellular matrix components such as fibronectin (13, 14). Observation of cells in 0–0 environments (C0 = 0 nM, ΔC = 0 nM) revealed cells with frequent switching of orientation and very few cells that maintained persistence across the entire channel (Fig. 1 G–I and Movie S4). When cells were placed in uniform environments of higher concentrations, we observed an increased level of persistent cells at 3 nM (C0 = 3 nM, ΔC = 0 nM; Fig. S1 E–G and Movie S5) that increased at 10 nM (C0 = 10 nM, ΔC = 0 nM; Fig. S1 H–J and Movie S6) and then dropped at 100 nM (C0 = 100 nM, ΔC = 0 nM; Fig. S1 K–M and Movie S7, with persistence quantified in Fig. S1N).
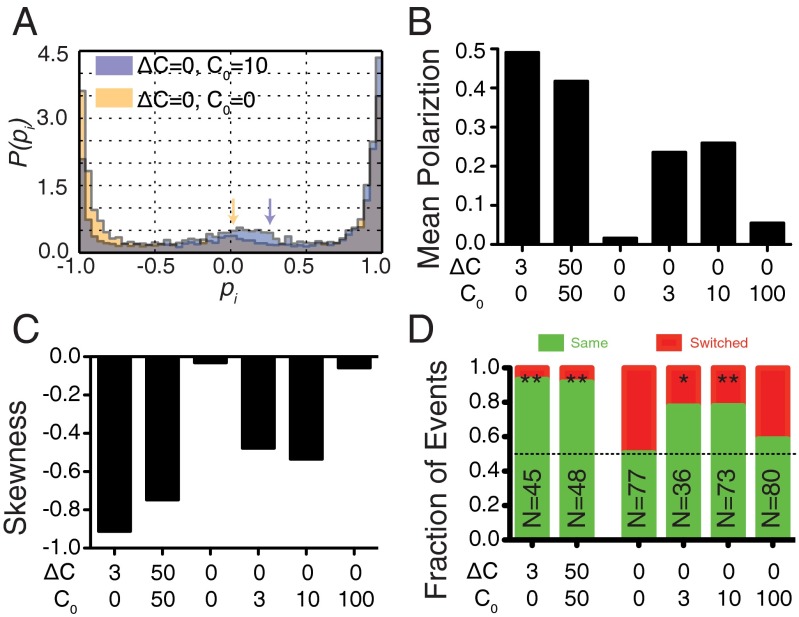
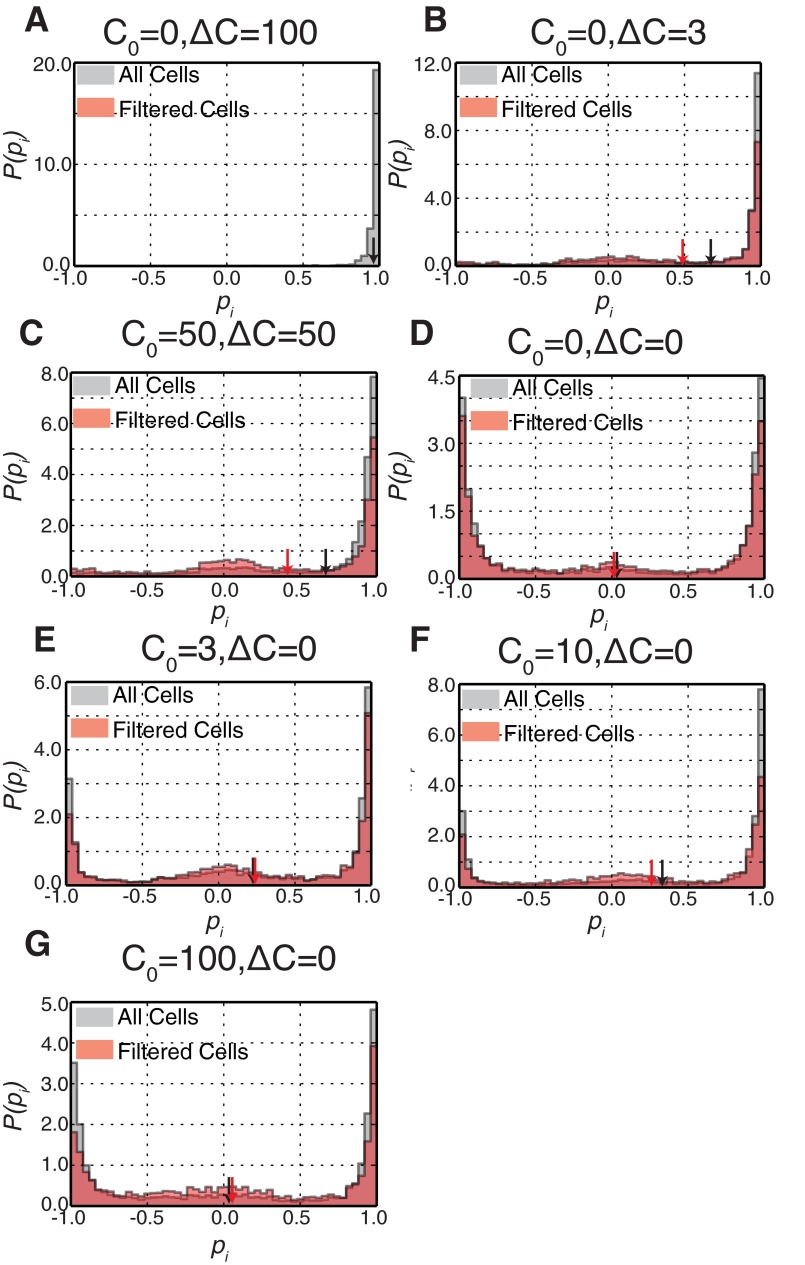
To quantify the polarization dynamics, we derived histograms of instantaneous cell polarization combining many cell trajectories (Fig. 2A and Fig. S2). All histograms show peaks near −1 and 1, reflecting the polarized state in both directions, and a small enrichment at 0 (the unpolarized state). The sign of the polarization was chosen such that the initial direction of polarization was positive. For persistently polarized cells, as observed in strong chemotactic differences (e.g., C0 = 0 nM, ΔC = 100 nM), cells exhibited a strong polarization bias toward +1 (Fig. S2A). At low chemoattractant differences (e.g., C0 = 0 nM, ΔC = 3 nM), we also observed a bias in polarization to the original direction of polarization with some fluctuation (Fig. S2B). This was also seen for differences on a large background concentration (e.g., C0 = 50 nM, ΔC = 50 nM; Fig. S2C). Histograms of cell polarization in uniform environments (ΔC = 0 nM) revealed that cells in 3 and 10 nM also showed a nonzero bias (Fig. 2 A and B and Fig. S2 E and F). In the absence of chemoattractant (0 nM) and at 100 nM uniform concentration, the mean polarization moved closer to 0 (Fig. 2A and Fig. S2 D and G). The mean and skewness (a measure of asymmetry) of these distributions indicated a directional bias under both chemotactic differences and uniform conditions (Fig. 2C).
Fig. 2.
Cells in uniform, nonzero concentrations exhibit a directional bias. (A) Histograms of instantaneous cell polarizations (PH-Akt) for cells in uniform concentrations of 0 nM (yellow) and 10 nM fMLP (blue). For the histograms shown all polarizations before the first depolarization of a cell were removed as described in the methods. Arrows designate the mean polarization. (B) Mean values for histograms of instantaneous polarizations. (C) Skewness of histograms of instantaneous polarizations (SI Experimental Procedures). (D) Statistics of repolarization direction. Green represents the percentage of events for which a cell repolarized in the same direction as before depolarization. Red represents the percentage of events for which a cell switched direction.
Fig. S2.
Histograms of instantaneous cell polarizations. Given that the vast majority of cells were polarized at the start of the observation period, we plotted the histogram of the entire trajectory (gray histogram) as well as the trajectory after the first depolarization event (red histogram) for all static conditions. Although there was a shift in the first-depolarization histogram, even small chemotactic differences resulted in a strong bias toward the original direction. (A–G) C0 = 0, ΔC = 100 (A); C0 = 0, ΔC = 3 (B); C0 = 50, ΔC = 50 (C); C0 = 0, ΔC = 0 (D); C0 = 3, ΔC = 0 (E); C0 = 10, ΔC = 0 (F); and C0 = 100, ΔC = 0 (G). Red and black arrows demonstrate the mean values for the two distributions in each condition.
To understand this bias in uniform environments, we revisited the trajectories of single cells. A cell that repolarized in the original direction of polarization after a depolarization event was designated a “same” cell, whereas cells that repolarized in the opposite direction were designated as “switched.” In environments with a chemical difference, cells exhibited a strong bias toward same (nonswitching) behavior (Fig. 2D). In some uniform environments, cells also exhibited strong nonswitching behavior, indicating a memory of the previous direction (e.g., 3 and 10 nM), whereas there was little to no bias in other uniform environments (e.g., 0 and 100 nM). Although the bias in the chemical difference environments might be expected, the bias seen in uniform environments, specifically 3 and 10 nM (∼80%, P < 0.004; Fisher exact test), indicated that internal cellular factors can determine the direction of repolarization and not the external conditions.
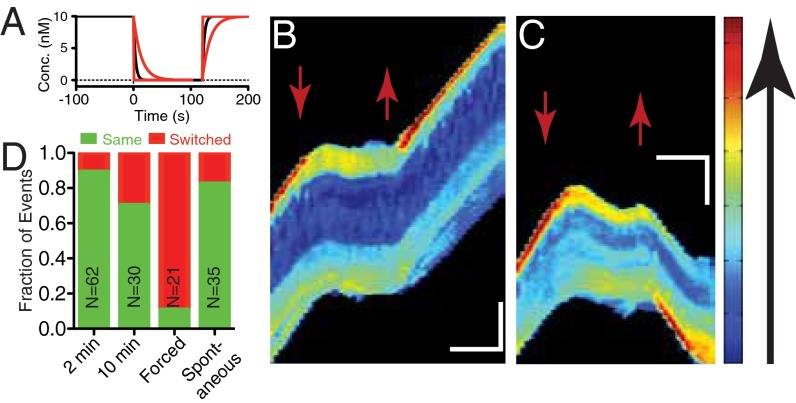
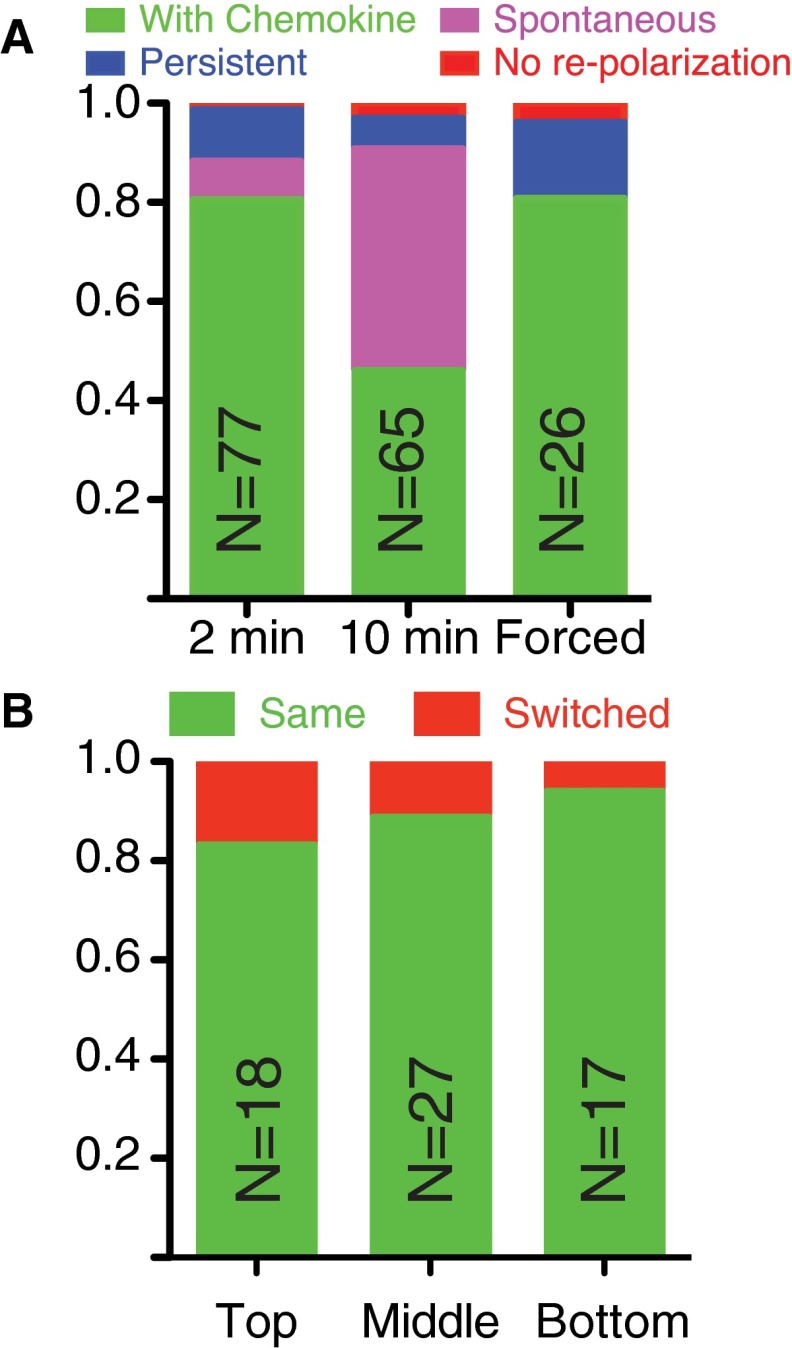
To investigate the temporal dynamics of this memory, we used a dynamic environment to shift cells from a uniform environment with chemoattractant (C0 = 10 nM, ΔC = 0 nM) to one with none (C0 = 0 nM, ΔC = 0 nM) to promote depolarization at a specified time (Fig. 3A). Chemoattractant was then reintroduced after a time delay. The majority of cells depolarized under removal of the chemoattractant (69/77, 90%, Fig. S3A), exhibiting both chemical (PH-Akt-GFP) and morphological depolarization. After 2 min in the absence of chemoattractant, a uniform environment (C0 = 10 nM, ΔC = 0 nM) was reestablished. Unpolarized cells reexposed to the uniform environment repolarized either in the same direction (Fig. 3B and Movie S8) to their previous motion or switched (Fig. 3C and Movie S9). Cells reexposed after 2 min of no chemoattractant exhibited a 90% bias toward the original direction (Fig. 3D). When extended out to 10 min of no chemoattractant, the bias dropped to 70%. During the 10-min depolarization time, many cells spontaneously polarized before the reintroduction of chemoattractant (29/65, 45%; Fig. S3A), and their directional bias toward the initial direction of polarization was ∼80% (Fig. 3D, “Spontaneous”), indicating that the readdition of chemoattractant was not required to activate the polarization machinery but that the memory was still intact. Interestingly, a small number of cells (8/77, 10%) did not depolarize after removal of the chemokine, indicating some long-lived persistence in the absence of an external signal. We investigated the role of cell position in the channel given that some cells would experience differential temporal cues (front vs. back) if cells were closer to the channel ends. We found no correlation between the position in the channel and choice of polarization direction (Fig. S3B).
Fig. 3.
Directional bias persists after removal of chemokine. (A) Calculated plot of concentration as a function of time in the microchannel (wash at t = 0 s; reintroduction at t = 120 s). Solid lines represent the decay attributable to diffusion for a distance of 50 μm (black), 100 µm (red, slow decay), and 10 μm (red, fast decay) from the end of the channel. (B and C) Kymographs representing a cell repolarizing in the same direction (B) and in the opposite direction (C). Red arrows mark the time when chemokine was removed (down) and reintroduced (up). (Vertical scale bar: 15 μm; horizontal scale bar: 100 s). (D) Repolarization direction statistics for cells exposed to the dynamic environment. Chemokine removal for 2 or 10 min. Repolarization by introducing chemokine only at the previous back of the cell (“Forced”). Spontaneous polarizations in the absence of chemokine are also shown.
Fig. S3.
Cellular responses to dynamics change in chemokine. (A) Percentage of cells that did not depolarize upon removal of chemokine (Persistent) or depolarized upon removal of chemokine and either repolarized upon reintroduction of chemokine (Normal), repolarized before reintroduction of chemokine (Spontaneous), or did not depolarize (No repolarization). (B) Cells were separated by whether they were in the bottom, middle, or top third of the microchannel, relative to the end at which they entered. As can be seen, the directional memory of the cells was not dependent on the position of the cell in the microchannel.
We expected that a strong opposing chemoattractant difference would be capable of overcoming this memory. We modified the dynamic protocol to take cells from the no chemoattractant environment to a fixed difference (C0 = 10 nM, ΔC = −10 nM) and found that for those cells initially polarized in the opposite direction to the final difference, 90% of the cells switched direction upon repolarization in the direction of the imposed difference (Fig. 3D, “Forced”).
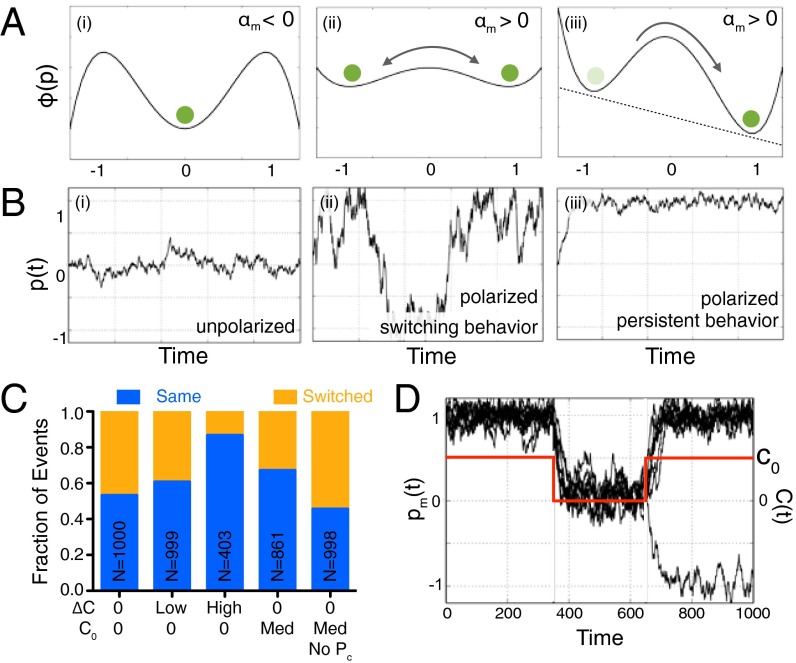
To quantify these observations in a minimal representation that accounts for the directional memory, we developed a phenomenological model for polarization dynamics as a function of the difference in concentration across the cell, ΔC, and the average concentration, C0 + ΔC/2. Our mathematical model represents the migrating cell as a composite of two interacting systems—a sensing unit embedded in the membrane and an actuating motor unit embedded in the cytoskeleton. The cytoskeleton can only indirectly sense the environment through the polarization state of the membrane; however, the cytoskeletal polarization biases membrane polarization much like the external environment does. We denote the membrane polarization by pm(t), as measured by PH-Akt-GFP activity, and we denote the cytoskeleton polarization by pc(t). Both of these variables can take values in the range of −1 to 1, where positive and negative values represent polarized states, and a vanishing value represents an unpolarized state. The dynamics of the system are modeled by a pair of Langevin-like equations for the membrane and cytoskeletal polarization, using a double-well potential that characterizes the two polarized states separated by an unpolarized state (Fig. 4A) and symmetry considerations:
| [1a] |
| [1b] |
The first term on each right-hand side arises from the derivative of the double-well potential, with three steady states corresponding to pm, pc = 0, +1, −1 (Fig. 4 A, i and ii). Here, αm and αc = αc(αm) are the stochastic gains for the membrane and cytoskeleton (which are functions of C via the fraction of bound receptors), so that for αm, αc <0, the unpolarized state is the only stable state, whereas for αm, αc > 0, there are two stable states (pm, pc = +1; and pm, pc = −1) corresponding to polarization in the initial and opposite directions, respectively. A gradient in the chemokine concentration biases the preferred polarization and corresponds to the term Δn, the difference in the fraction of bound receptors, which breaks the symmetry of the potential landscape with a deeper well associated with the preferred polarization (Fig. 4 A, iii). The last term in each equation ηm(t) is uncorrelated Gaussian noise. The second term in Eq. 1b denotes the time-averaged membrane polarization (t) = ∫t−∞ pm(t) Γ (t − τ)dτ/∫t−∞ Γ (t − τ)dτ, with Γ(t) = Ae−t/τ denoting a memory kernel associated with the signaling cascade from the membrane to the cytoskeleton, with a characteristic time, τ. It has been observed that if the membrane depolarizes and repolarizes after a given time, it will repolarize in the direction dictated by the cytoskeletal polarization. This suggests a minimal coupling where the integration of the membrane polarization over time that biases pc in the same direction, in turn biases pm again (SI Experimental Procedures, Model Description). Eq. 1 together with a stochastically varying gain αm (subject to receptor binding constraints; see SI Experimental Procedures, Model Description) form a complete set of equations for the dynamics of membrane and cytoskeleton polarization for some given initial conditions, with a single dimensionless parameter that controls the dynamical processes: τ αm.
Fig. 4.
Theoretical model of two-layer polarization reproduces directional bias. (A) Model effective potential wells, Φ(p), for a cell in a uniform low C0 (αm < 0) (i), a uniform high C0 (αm > 0) (ii), and ΔC > 0 (αm > 0) (iii). (B) Simulated cells in the conditions in A: (i) cells fluctuate about the unpolarized state p = 0, (ii) cells tend to be in the polarized state p = ±1 and can switch direction, and (iii) cells remain persistently polarized. (C) Directional repolarization statistics for simulated cells for different cases of C0 and ΔC, including no coupling to pc. (D) Simulations of the dynamic experiments exhibiting memory, where C(t) > 0 (plotted in red as a function of time), then C(t) = 0 (and cells depolarize), and then C(t) > 0 again, whereupon the vast majority of simulated cells repolarize in the original direction.
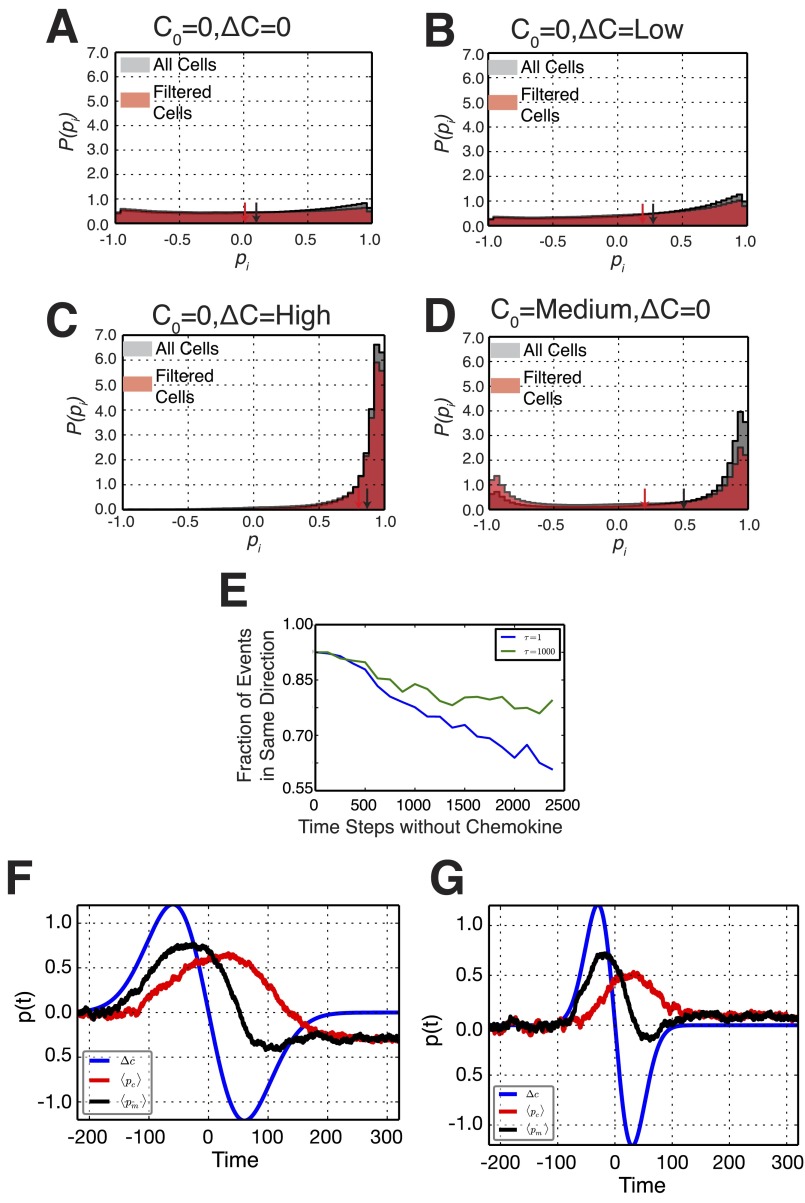
To gain some intuition about the model, we first look at the case τ = 0, effectively decoupling pm and pc. Fig. 4B shows examples of simulated trajectories of pm(t). Because αm is a function of the rate of binding events and noise, it responds to external conditions by switching between polarization directions and between polarized and unpolarized states. For αm < 0, the effective potential landscape exhibits a single well corresponding to the unpolarized state (Fig. 4 B, i). For αm > 0 and Δn = 0, the landscape switches to a symmetric double well corresponding to two polarized orientations (Fig. 4 B, ii). If Δn now increases above 0, the potential becomes asymmetric favoring the polarization in the direction of Δn (Fig. 4 B, iii). Next, we introduce memory with nonzero τ that couples pm and pc, and we carry out simulations following the direction in which a cell repolarizes following a depolarization event. In the absence of any chemokine, simulated cells exhibited no bias in the repolarization direction (Fig. 4C), whereas the introduction of even a small concentration difference resulted in a measurable bias, which increased with the magnitude of Δn. Fig. 4D shows that we qualitatively reproduce experimental behavior. In addition, cells in a uniform C0 also exhibited a directional bias (absent for τ = 0). These simulations also recovered distributions of instantaneous polarization (Fig. S4). Simulations of dynamic removal and reintroduction of chemokine (as in Fig. 3A) showed a strong bias to repolarizing in the same direction as the original polarization (Fig. 4D). Increasing the time for reintroduction of chemokine decreased the fidelity of the directional memory. Increasing τ, which simulates longer cytoskeletal time scales, resulted in a longer-lived directional memory (Fig. S4E).
Fig. S4.
Histograms of simulated cell polarizations. Histograms of simulated cellular polarizations including all polarization measurements (gray) and only those that occurred following the first depolarization of a cell (red) for the conditions C0 = 0, ΔC = 0 (A); C0 = 0, ΔC = Low (B); C0 = 0, ΔC = High (C); and C0 = Medium, ΔC = 0 (D). (E) Directional repolarization statistics for simulated cells as a function of the amount of time between removal and reintroduction of chemokine for two parameters of the time scale of the memory kernel: smaller time scale with τ = 1 in blue and a larger time scale with τ = 1,000 in green. The larger time scale exhibits longer memory compared with the smaller time scale, with a higher fraction of cells repolarizing in the same direction at any time. (F) For slow waves, where the time scale of the positive gradient τΔn = 200 is larger than the time scale of the memory kernel τpc =100, the polarization of the membrane switches directions as seen by the final negative p(t) at long times. (G) For faster waves, where τΔn = 100 is comparable to τpc, the cell exhibits directional memory and does not switch polarization directions, as seen by the positive p(t) at long times. Details are found in Results.
Our model also naturally allows us to explain seemingly paradoxical behaviors observed in other chemotactic systems. Indeed, in Dictyostelium, Nakajima et al. (9) showed that the speed of waves of chemoattractant affect the migration behavior, dubbing this the “wave-paradox”; for fast waves, no migration is observed; for slow waves, cells move toward the incoming wave but reverse their direction as the wave passes the cell; whereas for intermediate wave velocities, cells migrate toward the incoming wave throughout the wave cycle, resulting in forward cell migration in a negative chemotactic gradient. We now turn to describe this phenomenon using our two-layered mathematical model. We define two time scales in these experiments: τΔn, the time scale of the positive gradient (half the time the wave needs to cross the cell); and τpc, the time scale of the memory kernel. As the wave comes in, it imposes a positive gradient Δn > 0 while pc = 0; therefore, the total bias is positive, and pm increases with time to its maximum value +1. The temporal integration of pm biases pc, which therefore increases. After the wave passes the cell, the external gradient switches sign (i.e., Δn → −Δn). For slow waves (i.e., τΔn > τpc), upon switching of the gradient, pc will have already reached its maximum value, and therefore the total bias (−Δn + pc) effectively diminishes with time and eventually switches signs (i.e., pm also switches signs) (Fig. S4F). For intermediate waves (i.e., τΔn ∼ τpc), upon switching of the gradient, pc has not reached its maximum value yet and is still increasing, effectively canceling out the negative bias of the gradient −Δn (i.e., pm does not switch signs) (Fig. S4G). As with previous work in Dictyostelium (6, 7), which uses the more complex LEGI+M (local excitation–global inhibition plus memory) model, our model explains both directional memory and the wave paradox. We point out that the main differences lie in the reduced complexity of our model. In particular, our holistic model led us to three equations that characterize the dynamics of the observable chemical polarization of the membrane pm, the mechanical polarization of the cytoskeleton pc, as well as the gain associated with chemokine binding α, permitting the identification of putative cellular components corresponding to these variables with six parameters, which depend on the environment: Kd, the dissociation constant; k+, the association rate; ηm and ηα, the magnitude of noise; , the minimal bounds for α; and, lastly, τ, the extent of the memory kernel.
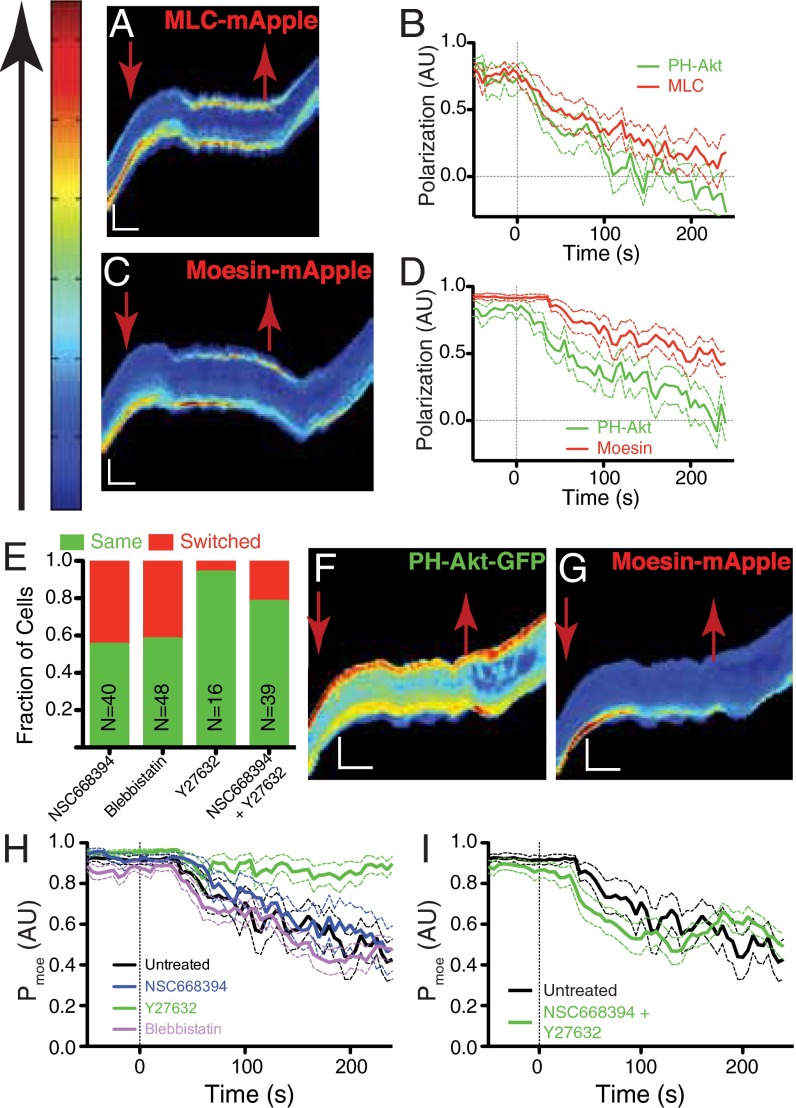
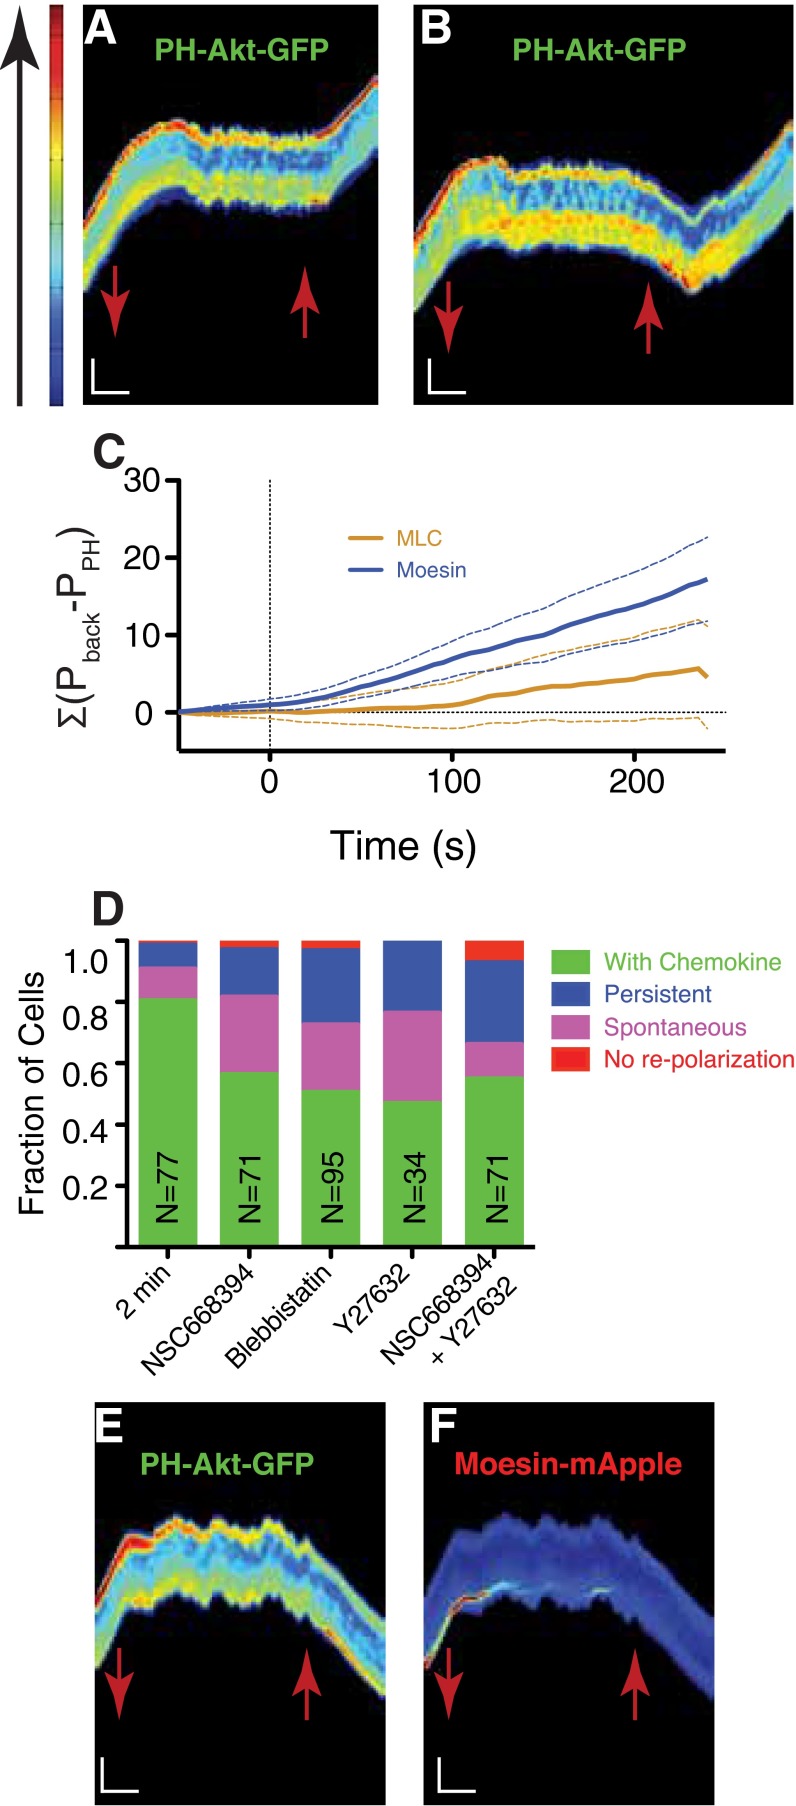
Two molecular assemblies that might serve as repositories of this long-lived asymmetry driving directional memory are the actomyosin network and the ERM–actin–membrane structures that localize to the rear of a polarized cell (15, 16). Both structures have been previously shown to exhibit turnover times that are long compared with PH-Akt dynamics in other cell types (17, 18). We introduced mApple-fusions to myosin light chain (MLC) and moesin into PH-Akt-GFP–expressing HL-60 cells. Polarization decay of mApple-MLC, after chemoattractant removal, was similar to that of PH-Akt-GFP (Fig. 5 A and B, Fig. S5A, and Movie S10). Unlike MLC, the mApple-moesin remained polarized longer than PH-Akt-GFP, after chemoattractant removal, indicating longer-lived asymmetry within the cell (Fig. 5 C and D, Fig. S5B, and Movie S11). Whereas the decay rate was only slightly faster, the most obvious difference was the delay in moesin depolarization, which resulted in a rapid increase in the cumulative difference between moesin and PH-Akt polarization compared with MLC vs. PH-Akt (Fig. S5C).
Fig. 5.
Identification of long-lived cytoskeletal polarization. (A) Representative kymograph MLC-mApple in a cell exposed to the dynamic environment described in Fig. 3A. (B) Average relaxation curves for MLC-mApple and PH-Akt-GFP polarization. (C and D) Kymograph and average relaxation curves for moesin-mApple. (E) Directional repolarization statistics for cells exposed to the dynamic environment (Fig. 3) with drugs introduced upon chemokine removal and washed out upon chemokine reintroduction. (F and G) Kymographs of PH-Akt-GFP (F) and moesin-mApple (G) for a cell dynamically exposed to the ROCK inhibitor Y27632. Note the prolonged polarization of moesin in G compared with C. (H and I) Average relaxation curves of moesin-mApple polarization for single drugs (H) and their combination (I). Decay plots represents the average value (solid) and SD (dashed). Red arrows mark the time when chemokine was removed (down) and reintroduced (up). (Vertical scale bar: 15 μm; horizontal scale bar: 100 s.)
Fig. S5.
Identification of long-lived cytoskeletal polarization. (A and B) Kymographs of PH-Akt-GFP localization for cells expressing either MLC-mApple (A) or moesin-mApple (B), shown in Fig. 5 A and C, respectively. Red arrows mark the time when chemokine was removed (down) and reintroduced (up). (Vertical scale bar: 15 μm; horizontal scale bar: 100 s.) (C) Cumulative sum of the difference between either MLC or moesin polarization and PH-Akt polarization. (D) Responses of cells to removal and reintroduction of chemokine (as described in Fig. S3) for the different drugs and drug combinations tested. (E and F) Kymographs of PH-Akt-GFP (E) and moesin-mApple (F) for a cell treated with moesin inhibitor NSC668394.
Moesin is a member of the ERM family of proteins that acts to connect the plasma membrane (via PIP2) to the cortical actin cytoskeleton (19–21). A critical threonine residue is present in the C terminus of each of the ERM family members that regulates the interaction with f-actin, and the N-terminal FERM (Band4.1, Ezrin, Radixin, Moesin) domain regulates an interaction with MTs (22). A quinolone-based compound (NSC668394) was previously developed to bind this threonine and prevent its phosphorylation, disrupting f-actin binding (23). Addition of NSC668394 at 50 µM to the dynamic protocol (during the no chemoattractant phase) resulted in a reduction of directional memory from 90% to 60% (Fig. 5E). Blebbistatin, a myosin II inhibitor (50 µM) also decreased directional memory (24) (Fig. 5E).
The ROCK (Rho-associated protein kinase) kinase is a downstream effector of Rho-GTP, an integrator of the back domain (25), and ROCK’s inhibition [via Y27632, 20 μM (26)] did not decrease directional memory (Fig. 5E). A significant number of cells under ROCK inhibition and chemoattractant removal continued to move along the channel (Fig. S5D). The combination of ROCK and moesin inhibition preserved memory. To understand the interrelationship between these components, we investigated the decay of moesin under each of these drugs. Interestingly, ROCK inhibition stabilized moesin at the back of the depolarized cell independently of PH-Akt (Fig. 5 F and G and Movie S12). All other treatments had no effect on the decay of moesin (Fig. 5H, Fig. S5 E and F, and Movie S13). The addition of the moesin inhibitor to ROCK inhibition partially restored moesin decay dynamics (Fig. 5I).
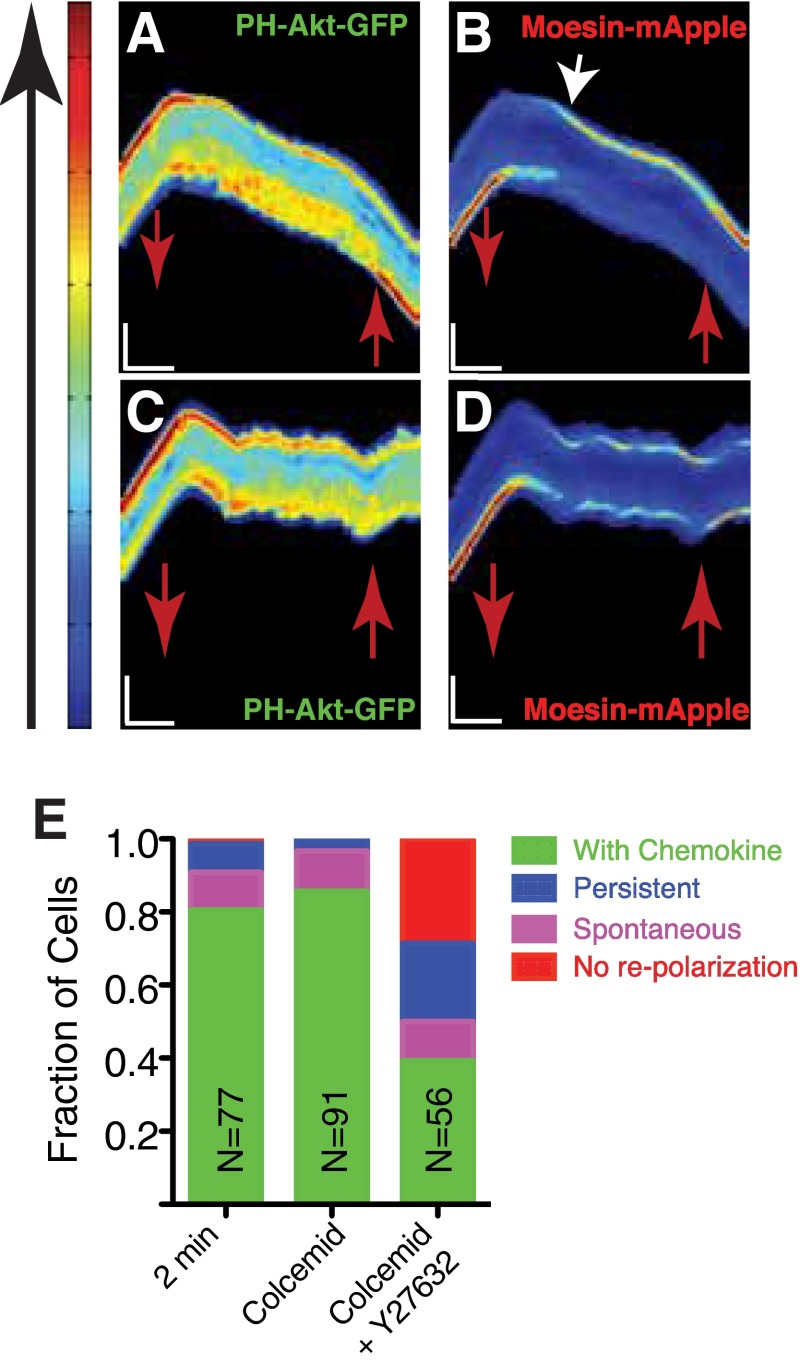
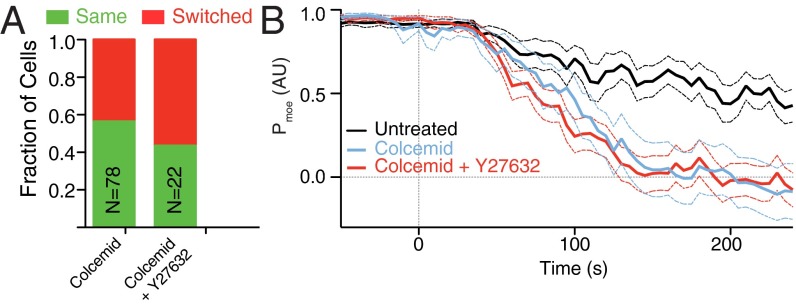
Treatment of chemotactic cells with colcemid (10 µM), a MT-depolymerizing compound during the no chemoattractant phase, resulted in the mislocalization of moesin and PH-Akt (Fig. S6 A and B and Movie S14), effectively accelerating the decay of moesin polarization and reducing directional memory (Fig. 6 A and B). Addition of the ROCK inhibitor to colcemid resulted in a stabilization of the mislocalized moesin at both the front and back of the cell (Fig. S6 C and D and Movie S15) and thus a reduction of memory (Fig. 6 A and B). This stabilization resulted in a dramatic increase in cells that did not repolarize after the reintroduction of chemoattractant and drug washout (Fig. S6E).
Fig. S6.
MT disruption alters relaxation dynamics of moesin polarization. (A and B) Kymographs of PH-Akt-GFP (A) and moesin-mApple (B) for a cell dynamically exposed to the MT inhibitor colcemid. Red arrows mark the time when chemokine was removed (down) and reintroduced (up). (Vertical scale bar: 15 μm; horizontal scale bar, 100 s.) (C and D) Kymograph of PH-Akt-GFP (C) and moesin-mApple for a cell exposed to the combination of colcemid and Y27632 (D). Red arrows mark the time when chemokine was removed (down) and reintroduced (up). (Vertical scale bar: 15 μm; horizontal scale bar: 100 s.) (E) Responses of cell to removal and reintroduction of chemokine (as described in Fig. S3) for treatment both with colcemid alone as well as drug combinations including colcemid.
Fig. 6.
MT disruption alters moesin polarization and disrupts memory. (A) Directional repolarization statistics for cells exposed to colcemid alone or colcemid and Y27632. (B) Average relaxation curves of moesin-mApple for untreated cells, cells exposed to colcemid and cells exposed to both colcemid and Y27632. Solid lines represent the average value across the population, dashed lines represent one SD.
Discussion
Observations of chemotactic neutrophil-like cells in a variety of chemical differences and uniform environments revealed a bias in repolarization directions toward that of previous cellular orientations. A model based on long-lived asymmetric cellular elements that persist after cells have depolarized and that influence orientation upon repolarization was able to recapitulate many aspects of this memory.
Observations of internal dynamics revealed that moesin is a strong candidate for this memory because moesin had the requisite long-lived behavior and moesin’s inhibition reduced directional memory. Although moesin exhibited the long polarization time scale indicative of a directional memory (exhibiting faster decay and delay in depolarization), inhibition via the small quinolone molecule did not change moesin dynamics but did interrupt memory. The action of NSC668394 is to block T558 phosphorylation on moesin and decouple moesin from f-actin (23). This decoupling may accelerate the depolarization of the actual memory element. Alternatively, the phosphosite itself may act to bias repolarization (27).
Blebbistatin also reduced memory, thereby implicating myosin as a potential memory element. This result was surprising given that MLC polarization decay did not exhibit the appropriate time scale to account for the observed directional memory (as shown in Fig. 5B and Fig. S5C). However, it is possible that myosin heavy chain localization remains polarized on a longer time scale than does the polarization of MLC (the regulatory light chain). Recent work identifying a serine-rich motif in myosin heavy chain II-B regulating cell polarization highlights a potential candidate (28). Under ROCK inhibition, moesin and likely myosin were stabilized, thereby promoting memory and indicating a link between RhoA (Ras homolog gene family, member A) activity and moesin turnover (29). However, the combination of ROCK and moesin inhibition restored moesin decay dynamics but still exhibited some memory supporting a role for actomyosin.
MT disruption also reduces directional memory but by mislocalizing moesin rather than accelerating its decay from the cell membrane. Loss of MTs in neutrophils has been previously associated with loss of polarity and reduced directional migration (30). Here we propose that the role of MTs acts to focus biochemical activities to maintain proteins such as moesin (and myosin) at the back domain, as has been observed in other cell types (31). One candidate for this regulation would be RhoA that has been linked to MTs through the MT-bound RhoGEF, GEF-H1 (32).
Together these data support a model of cellular orientation that depends on both external environmental cues and internal membrane lipid composition that polarize long-lived cytoskeletal markers that act as a form of directional memory. Models which focus only on the early chemotactic response associated with membrane polarization, e.g., LEGI would be unaffected by cytoskeletal perturbations. Our observations under perturbations of moesin and myosin show that this is not the case, thus requiring that we couple the dynamics of cytoskeletal and membrane polarizations.
Further dynamical tests in confined geometries and 2D chemotactic fields should help refine the layered model and account for additional time and length scales associated with complex spatiotemporal signaling [e.g., small GTPases (15)] within the cell. For example, the model predicts that when the new external cue is aligned with the internal memory it may establish polarization more rapidly than when an external cue is oriented in opposition to the internal memory. Further, kinetic measurements would begin to dissect interprocess time scales and explain behaviors such as U-turns originally described by Zigmond et al. (33) that occur at slow changes in the external environment but disappear in rapidly changing gradients (34) and maintain polarity in the face of reversed chemoattractant gradients (35). More generally, our study shows how the temporal separation of membrane and cytoskeletal polarizations allows a cell to sense and respond to a fluctuating environment robustly.
Experimental Procedures
Cell Culture and Stable Line Production.
HL-60 cell lines were generated and maintained as previously described (5), with details in the SI Experimental Procedures. Dual expression cell lines were generated via lentiviral infection of cells stably expressing PH-Akt-GFP with either MLC-mApple or hsMoesin-mApple.
Microfluidic Device Operation.
Operation of the microfluidic devices was carried out as previously described (5, 8) with details available in the SI Experimental Procedures. To expose cells to dynamic changes in concentration, cells were loaded and allowed to enter the microchannels in a uniform concentration of 10 nM fMLP by clamping off the 0 nM reservoir. The chemokine was then washed away by clamping off the 10 nM inlet and releasing the 0 nM reservoir. Chemokine was reintroduced by clamping the 0 nM inlet and releasing the 10 nM inlet. Inhibitors were added to the 0 nM reservoir (SI Experimental Procedures).
Image Acquisition and Analysis.
The cell polarization was determined using a clustering method similar to that described by Ku et al. (11) with details in the SI Experimental Procedures. To determine cell persistence, cells that maintained a polarized morphology and a polarization parameter >0.8 (the threshold) throughout the entire length of the channel, or during the entire period of imaging, were determined to be persistent. Transient fluctuations of the polarization parameter below the threshold for a single frame were still determined to be persistent. In the case that the polarization parameter remained below the threshold for two or more frames, the cell was determined to have depolarized. Repolarization events were identified if the polarization parameter increased above the threshold and a morphological polarization was established.
Note Added in Proof.
During the preparation of this manuscript, a report by Maiuri et al. (36) demonstrated that retrograde flow during migration increases the asymmetry of cell-polarity cues, thus maintaining cell polarization (i.e., persistence). It is possible that this effect on polarization is related to the coupling we suggest between membrane and cytoskeletal polarization, drawing a parallel between directional memory and persistence.
SI Experimental Procedures
Cell Culture and Stable Line Production.
HL-60 cultures were maintained in RPMI 1640 (11875119; Invitrogen) media supplemented with 20% FBS (26104; Invitrogen), 1% Penstrep (30-002-CI; Cellgro), and 25 mM sterile filtered Hepes (BP310; Fisher Scientific) and were passaged every 2–3 d. Cells were differentiated in complete media supplemented with DMSO added to a final concentration of 1.3%. Cells differentiated for at least 5 d and not more than 7 d were used for experiments.
Cell lines stably expressing PH-Akt-GFP were generated via retroviral infection, as described previously (5). Briefly, Plat-GP cells (Cell Biolabs) were used to produce retrovirus by cotransfection with a pBABE packaging vector (pBABEblast, pJag98) containing the cDNA for 3× PH-Akt-GFP (cDNA obtained from Lew Cantley, Harvard Medical School, Boston) and VSV-G using Fugene 6 (Roche). Lentiviral particles were generated as described previously (5), with the exception that 293T cells were used and a pCDH packaging vector (Systems Biosciences) was cotransfected with the helper plasmids psPAX2 (no. 12260; Addgene) and pMD2.G (no. 12259; Addgene). The viral supernatants (both lenti and retro) were collected after 48–72 h and filtered using a 0.45-μm syringe filter.
Polybrene was added to the supernatant at a final concentration of 16 μg/mL. Cells were suspended in one well of a six-well plate at a concentration of 106/mL in a volume of 2 mL. To this suspension was added 5 mL of viral supernatant and the cells were spun at 1,000 × g for 90 min in a swinging bucket rotor. Cells were then incubated for 5 h at 37 °C. Following this incubation, cells were pelleted and resuspended into 2 mL of fresh media. The next day, 2 mL of fresh media was added to the cells. The next day, cells were placed under selection in 1 μg/mL blasticidin. Once a stable pool of blasticidin-resistant cells was obtained, the cells were then sorted for GFP expression (HMS/Systems Biology Flow Cytometry Facility).
Microfluidic Device Fabrication.
Microfluidic devices were generated as described previously (5, 8). High-resolution film (Fineline Imaging) or chrome (Advanced Reproductions; Front-Range Photomasks) masks were used to generate photoresist masters. SU-8 (Microchem) was spun onto silicon wafers at a rate according to the feature height desired. The photoresist was then exposed to UV light using a mask aligner (Neutronix Quintel). Unexposed SU-8 was developed away. PDMS was then either spun (for membranes) or poured onto the wafers, cured overnight at 70 °C. The top layer of the devices was then cut out, access holes were punched for pneumatic valve control using a 0.75 mm diameter punch, and the devices were then bonded to the spun membrane using oxygen plasma. These devices were again cut out and additional fluid access holes were punched and the devices were then bonded to either 1 × 3 glass slides (Fisher Scientific), or 45 × 50 mm No. 1.5 coverslips (Fisher Scientific).
Microfluidic Device Operation.
Tygon tubing (part no. 2007900S-54HL; Greene Rubber Company) and 30-gauge blunt syringe needles (BN2505; Brico Medical Supplies) were used to connect syringes to the microfluidic devices. The outer diameter of the Tygon tubing (0.03 in) is slightly larger than the diameter of the hole punched, so when the tubing was inserted into the hole, a seal was created. Each of the pneumatic valve control chambers was connected to a 1 mL syringe. To close the valves, the syringe was compressed from a volume of 0.2 mL to ∼0.05 mL To open the valves, the syringes were pulled open from a volume of 0.2 mL to the maximum volume of the syringe.
Fibronectin was adsorbed onto the channel walls by filling the device with a solution containing 50 μg/mL fibronectin (F0895; Sigma-Aldrich) in 50 mM Tris⋅HCl. Any air bubbles present were removed by pressurizing the device. The solution was incubated in the device for 1 h at room temperature and then rinsed out with HBSS supplemented with 25 mM Hepes and 0.2% human serum albumin.
Each inlet was connected to a syringe, with the plunger removed. One syringe contained a solution of HBSS, while the other contained a solution of HBSS with fMLP. Fluorescein was added to the syringe containing fMLP to visualize the interface of the two inlet streams for balancing the stream pressures. To reduce the introduction of air bubbles while loading cells, a drop of HBSS was placed onto the cell inlet hole before removing the priming tubing.
To load cells into the device, 2–3 mL of differentiated cells were pelleted and 30 μL of the cell pellet was taken and placed into a blunt needle with a short section of tubing. The cells were then pushed through the tubing by applying pressure to the top of the needle with a finger, until a small drop appeared at the end of the tubing to provide a liquid-liquid interface while inserting the tubing to prevent the introduction of air bubbles. The cells were then pushed into the device by applying pressure with a finger and the on-chip valves were manipulated to control whether cells were loaded on only side of the microchannels or on both sides.
When inhibitors were used [10 μM colcemid (EMD Millipore), 50 µM NSC688394 (EMD Millipore), 20 μM Y-27632 (Tocris), or 50 μM blebbistatin (Abcam)], they were added to the 0 nM reservoir. For the experiments in which inhibitors were tested, either 10 μM colcemid (EMD Millipore) or 50 μM NSC688394 (EMD Millipore) was added to the 0 nM reservoir.
Image Acquisition and Analysis.
Cells were imaged on either a Nikon TE2000 microscope (Nikon) or a Nikon Eclipse Ti (Nikon) with a 40× Ph3 Plan Apo (Nikon) objective. The microscopes were controlled with the Volocity software package (Perkin-Elmer) or Nikon Elements (Nikon), respectively. Images were acquired at a frame rate of 1 frame every 5s, in both the GFP and bright-field channels.
For each cell, the central 30% of the channel was extracted, and the image was averaged over the width of the channel for each time point, generating a 1D intensity profile. The edge of the cell was then determined, at each time point, by applying a nonlinear filter (37), and an adaptive threshold was implemented with a constraint on cell length determined from the previous frame to find the edges of the cell. All images were analyzed with in-house Matlab (MathWorks) algorithms.
The polarization was determined using a clustering method similar to that described by Ku et al. (11). First, the locations of the top 5% of pixels, by intensity, were found. The average pair-wise distance between these pixel locations was then calculated. Next, the theoretical minimum average pair-wise distance was calculated by generating a disk of the same area as the top 5% pixels identified and the theoretical maximum average pair-wise distance was calculated by distributing an equal number of pixels through a region of the same size as the cell. The measured average pair-wise distance was then subtracted from the maximum theoretical average, and the result was divided by the difference of the theoretical minimum from the theoretical maximum, giving a value ranging between 0 and 1. The orientation of the polarization was then determined by comparing the center of mass of the 5% brightest pixels and the center of the cell. This process was performed for each time step, and the resulting polarization trajectory was scaled by the initial orientation such that each cell starts with a positive polarization.
Skewness of polarization histograms was calculated as the third central moment divided by the SD cubed.
Model Description.
Here, we complement the description of polarization dynamics embodied in Eq. 1 by accounting for the dynamics and constraints on the membrane polarization gain αm. The fraction of bound receptors n is related to the chemokine concentration c and the dissociation constant Kd through n = c/(c + Kd). The gain associated with the membrane polarization αm is a function of the rate of binding events non = k+c(1 − n) = nk+Kd, where k+ is the rate of association of a chemokine ligand to a receptor. We take non to be the average of n on both sides non = k+Kd (nL + nR)/2. αm increases with non (assumed here to grow linearly for simplicity), effectively lowering the ratio to the noise [i.e., the stronger the signal (the higher the fraction of bound receptors) the lower the noise]. We also assume a minimal value for αm, so that:
| [S1] |
As mentioned in Results, the gain is itself is stochastically driven by a noise term ηα, so that
| [S2] |
but is restricted to the initial values set in Eq. S1. This allows αm to randomly switch signs and therefore allows the cell to depolarize and repolarize spontaneously, as also seen experimentally. The gain associated with the polarization of the cytoskeleton is slaved to αm but is also a function the history of the membrane polarization: αc = αm | |. A persistent (switching) membrane polarization is reflected in a maximal (low) value of its history and hence lowering (raising) the sensitivity of the cytoskeleton polarization. This reasoning hinges again on the notion that the cytoskeleton reacts to the membrane polarization on a longer time scale. We also point that while solving (Eqs. 1, S1, and S2), we also enforce reflecting boundary conditions have been set for pm and pc at the extreme values +1 and −1, because values beyond this range are not defined and have no physical meaning.
The parameters used in our simulations are: η = 5.0, ηα = 8.0, k+Kd = 4.0, = 0.1, τ = 100.
The value = 0.1 was chosen arbitrarily as a small number in the range of 0–1. The value for k+Kd was chosen to be double the distance between the two wells of the double-well potential (i.e., 2), because this parameter sets the depth of the wells. The noise η (i.e., the SD of the Gaussian noise) was taken to be slightly larger than the depth of the wells, therefore allowing to hop between the two wells but allowing some residence time within each well. This value can be associated with the experimental residence time in each polarization state when there is no gradient. Lastly, the value for the noise driving αm the gain of the membrane polarization ηα is what sets the rate of spontaneous polarization or depolarization. Considering the distribution of time spent in different polarizations (Fig. 2A), we can discern three peaks: p = 1 and p = −1 are roughly equal in magnitude, and a smaller peak at p = 0. The ratio of polarized/unpolarized peaks is set by ηα. In our simulations, it was chosen so as to best reproduce the experimentally reported ratio. Furthermore, it is important to note that if this parameter is set to be too low, the gain does not change sign often enough, not allowing the polarization to change direction often enough (i.e., the dynamics may seem persistent within some time frame). This finding calls our attention to the notion that biological systems may be poised at criticality, allowing versatility without paying in robustness. Lastly, in the simulations, we considered the same cases of concentrations as in the experiments, translating them to non and Δn through the relations non = k+Kd(nL + nR)/2 and Δn = k+Kd(nL − nR)/2, where nL = cL/(cL + Kd) and nR = cR/(cR + Kd), and Kd = 10 [a typical value (13)], where c and Kd are expressed in nM. We also note Kd = 10 nM yields k+ = 0.4 1/s nM, also typical. The relevant values for the different cases of concentrations, expressed as fractions of bound receptors are: C0-0: non = 0, Δn = 0; C0-3: non = 0.12, Δn = 0.23; C50-100: non = 0.87, Δn = 0.08; C0-100: non = 0.46, Δn = 0.91; and C10-10: non = 0.5, Δn = 0.
Supplementary Material
Acknowledgments
The authors thank the members of the J.V.S. and L.M. laboratories and Tim Mitchison for valuable discussions. Microfabrication work was supported by BioMEMS Resource Center Grant P41 EB002503. This work was supported by Biological and Biotechnological Sciences Research Council Grant BB/F021402 (to G.T.C.), Brigham and Women’s Renal Division funds (to J.V.S.), National Science Foundation Grant BMMB 15-36616 (to J.V.S. and L.M.), and a MacArthur Fellowship (to L.M.). Y.M. is an Awardee of the Weizmann Institute of Science–National Postdoctoral Award Program for Advancing Women in Science.
Footnotes
The authors declare no conflict of interest.
This article is a PNAS Direct Submission.
This article contains supporting information online at www.pnas.org/lookup/suppl/doi:10.1073/pnas.1513289113/-/DCSupplemental.
References
- 1.Swaney KF, Huang C-H, Devreotes PN. Eukaryotic chemotaxis: A network of signaling pathways controls motility, directional sensing, and polarity. Annu Rev Biophys. 2010;39:265–289. doi: 10.1146/annurev.biophys.093008.131228. [DOI] [PMC free article] [PubMed] [Google Scholar]
- 2.Zigmond SH. Mechanisms of sensing chemical gradients by polymorphonuclear leukocytes. Nature. 1974;249(456):450–452. doi: 10.1038/249450a0. [DOI] [PubMed] [Google Scholar]
- 3.Brandley BK, Schnaar RL. Tumor cell haptotaxis on covalently immobilized linear and exponential gradients of a cell adhesion peptide. Dev Biol. 1989;135(1):74–86. doi: 10.1016/0012-1606(89)90159-0. [DOI] [PubMed] [Google Scholar]
- 4.Lo C-M, Wang H-B, Dembo M, Wang YL. Cell movement is guided by the rigidity of the substrate. Biophys J. 2000;79(1):144–152. doi: 10.1016/S0006-3495(00)76279-5. [DOI] [PMC free article] [PubMed] [Google Scholar]
- 5.Prentice-Mott HV, et al. Biased migration of confined neutrophil-like cells in asymmetric hydraulic environments. Proc Natl Acad Sci USA. 2013;110(52):21006–21011. doi: 10.1073/pnas.1317441110. [DOI] [PMC free article] [PubMed] [Google Scholar]
- 6.Skoge M, et al. Cellular memory in eukaryotic chemotaxis. Proc Natl Acad Sci USA. 2014;111(40):14448–14453. doi: 10.1073/pnas.1412197111. [DOI] [PMC free article] [PubMed] [Google Scholar]
- 7.Nakajima A, Ishihara S, Imoto D, Sawai S. Rectified directional sensing in long-range cell migration. Nat Commun. 2014;5:5367. doi: 10.1038/ncomms6367. [DOI] [PMC free article] [PubMed] [Google Scholar]
- 8.Irimia D, Charras G, Agrawal N, Mitchison T, Toner M. Polar stimulation and constrained cell migration in microfluidic channels. Lab Chip. 2007;7(12):1783–1790. doi: 10.1039/b710524j. [DOI] [PMC free article] [PubMed] [Google Scholar]
- 9.Millius A, Weiner OD. Chemotaxis in neutrophil-like HL-60 cells. Methods Mol Biol. 2009;571:167–177. doi: 10.1007/978-1-60761-198-1_11. [DOI] [PMC free article] [PubMed] [Google Scholar]
- 10.Meili R, et al. Chemoattractant-mediated transient activation and membrane localization of Akt/PKB is required for efficient chemotaxis to cAMP in Dictyostelium. EMBO J. 1999;18(8):2092–2105. doi: 10.1093/emboj/18.8.2092. [DOI] [PMC free article] [PubMed] [Google Scholar]
- 11.Ku C-J, Wang Y, Weiner OD, Altschuler SJ, Wu LF. Network crosstalk dynamically changes during neutrophil polarization. Cell. 2012;149(5):1073–1083. doi: 10.1016/j.cell.2012.03.044. [DOI] [PMC free article] [PubMed] [Google Scholar]
- 12.Williams LT, Snyderman R, Pike MC, Lefkowitz RJ. Specific receptor sites for chemotactic peptides on human polymorphonuclear leukocytes. Proc Natl Acad Sci USA. 1977;74(3):1204–1208. doi: 10.1073/pnas.74.3.1204. [DOI] [PMC free article] [PubMed] [Google Scholar]
- 13.Li L, Nørrelykke SF, Cox EC. Persistent cell motion in the absence of external signals: A search strategy for eukaryotic cells. PLoS One. 2008;3(5):e2093. doi: 10.1371/journal.pone.0002093. [DOI] [PMC free article] [PubMed] [Google Scholar]
- 14.Bosgraaf L, Van Haastert PJM. Navigation of chemotactic cells by parallel signaling to pseudopod persistence and orientation. PLoS One. 2009;4(8):e6842. doi: 10.1371/journal.pone.0006842. [DOI] [PMC free article] [PubMed] [Google Scholar]
- 15.Xu J, et al. Divergent signals and cytoskeletal assemblies regulate self-organizing polarity in neutrophils. Cell. 2003;114(2):201–214. doi: 10.1016/s0092-8674(03)00555-5. [DOI] [PubMed] [Google Scholar]
- 16.Seveau S, Keller H, Maxfield FR, Piller F, Halbwachs-Mecarelli L. Neutrophil polarity and locomotion are associated with surface redistribution of leukosialin (CD43), an antiadhesive membrane molecule. Blood. 2000;95(8):2462–2470. [PubMed] [Google Scholar]
- 17.Wang Y, et al. Identifying network motifs that buffer front-to-back signaling in polarized neutrophils. Cell Rep. 2013;3(5):1607–1616. doi: 10.1016/j.celrep.2013.04.009. [DOI] [PMC free article] [PubMed] [Google Scholar]
- 18.Fritzsche M, Thorogate R, Charras G. Quantitative analysis of ezrin turnover dynamics in the actin cortex. Biophys J. 2014;106(2):343–353. doi: 10.1016/j.bpj.2013.11.4499. [DOI] [PMC free article] [PubMed] [Google Scholar]
- 19.Neisch AL, Fehon RG. Ezrin, Radixin and Moesin: Key regulators of membrane-cortex interactions and signaling. Curr Opin Cell Biol. 2011;23(4):377–382. doi: 10.1016/j.ceb.2011.04.011. [DOI] [PMC free article] [PubMed] [Google Scholar]
- 20.Bretscher A, Edwards K, Fehon RG. ERM proteins and merlin: Integrators at the cell cortex. Nat Rev Mol Cell Biol. 2002;3(8):586–599. doi: 10.1038/nrm882. [DOI] [PubMed] [Google Scholar]
- 21.Kunda P, Pelling AE, Liu T, Baum B. Moesin controls cortical rigidity, cell rounding, and spindle morphogenesis during mitosis. Curr Biol. 2008;18(2):91–101. doi: 10.1016/j.cub.2007.12.051. [DOI] [PubMed] [Google Scholar]
- 22.Solinet S, et al. The actin-binding ERM protein Moesin binds to and stabilizes microtubules at the cell cortex. J Cell Biol. 2013;202(2):251–260. doi: 10.1083/jcb.201304052. [DOI] [PMC free article] [PubMed] [Google Scholar]
- 23.Bulut G, et al. Small molecule inhibitors of ezrin inhibit the invasive phenotype of osteosarcoma cells. Oncogene. 2012;31(3):269–281. doi: 10.1038/onc.2011.245. [DOI] [PMC free article] [PubMed] [Google Scholar]
- 24.Straight AF, et al. Dissecting temporal and spatial control of cytokinesis with a myosin II Inhibitor. Science. 2003;299(5613):1743–1747. doi: 10.1126/science.1081412. [DOI] [PubMed] [Google Scholar]
- 25.Wong K, Pertz O, Hahn K, Bourne H. Neutrophil polarization: Spatiotemporal dynamics of RhoA activity support a self-organizing mechanism. Proc Natl Acad Sci USA. 2006;103(10):3639–3644. doi: 10.1073/pnas.0600092103. [DOI] [PMC free article] [PubMed] [Google Scholar]
- 26.Uehata M, et al. Calcium sensitization of smooth muscle mediated by a Rho-associated protein kinase in hypertension. Nature. 1997;389(6654):990–994. doi: 10.1038/40187. [DOI] [PubMed] [Google Scholar]
- 27.Liu X, et al. Moesin and myosin phosphatase confine neutrophil orientation in a chemotactic gradient. J Exp Med. 2015;212(2):267–280. doi: 10.1084/jem.20140508. [DOI] [PMC free article] [PubMed] [Google Scholar]
- 28.Juanes-Garcia A, et al. A regulatory motif in nonmuscle myosin II-B regulates its role in migratory front-back polarity. J Cell Biol. 2015;209(1):23–32. doi: 10.1083/jcb.201407059. [DOI] [PMC free article] [PubMed] [Google Scholar]
- 29.Ivetic A, Ridley AJ. Ezrin/radixin/moesin proteins and Rho GTPase signalling in leucocytes. Immunology. 2004;112(2):165–176. doi: 10.1111/j.1365-2567.2004.01882.x. [DOI] [PMC free article] [PubMed] [Google Scholar]
- 30.Xu J, Wang F, Van Keymeulen A, Rentel M, Bourne HR. Neutrophil microtubules suppress polarity and enhance directional migration. Proc Natl Acad Sci USA. 2005;102(19):6884–6889. doi: 10.1073/pnas.0502106102. [DOI] [PMC free article] [PubMed] [Google Scholar]
- 31.Zhang J, Guo WH, Wang YL. Microtubules stabilize cell polarity by localizing rear signals. Proc Natl Acad Sci USA. 2014 doi: 10.1073/pnas.1410533111. [DOI] [PMC free article] [PubMed] [Google Scholar]
- 32.Kwan KM, Kirschner MW. A microtubule-binding Rho-GEF controls cell morphology during convergent extension of Xenopus laevis. Development. 2005;132(20):4599–4610. doi: 10.1242/dev.02041. [DOI] [PMC free article] [PubMed] [Google Scholar]
- 33.Zigmond SH, Levitsky HI, Kreel BJ. Cell polarity: An examination of its behavioral expression and its consequences for polymorphonuclear leukocyte chemotaxis. J Cell Biol. 1981;89(3):585–592. doi: 10.1083/jcb.89.3.585. [DOI] [PMC free article] [PubMed] [Google Scholar]
- 34.Irimia D, et al. Microfluidic system for measuring neutrophil migratory responses to fast switches of chemical gradients. Lab Chip. 2006;6(2):191–198. doi: 10.1039/b511877h. [DOI] [PMC free article] [PubMed] [Google Scholar]
- 35.Robertson AL, et al. A zebrafish compound screen reveals modulation of neutrophil reverse migration as an anti-inflammatory mechanism. Sci Transl Med. 2014;6:225ra229–225ra229. doi: 10.1126/scitranslmed.3007672. [DOI] [PMC free article] [PubMed] [Google Scholar]
- 36.Maiuri P, et al. Actin flows mediate a universal coupling between cell speed and cell persistence. Cell. 2015;161(2):374–386. doi: 10.1016/j.cell.2015.01.056. [DOI] [PubMed] [Google Scholar]
- 37.Chung SH, Kennedy RA. Forward-backward non-linear filtering technique for extracting small biological signals from noise. J Neurosci Methods. 1991;40(1):71–86. doi: 10.1016/0165-0270(91)90118-j. [DOI] [PubMed] [Google Scholar]
Associated Data
This section collects any data citations, data availability statements, or supplementary materials included in this article.


