Significance
The clinical and scientific community widely regards uterine leiomyomas as a single entity, although evidence of genetic heterogeneity exists. The aim of this study was to explore transcriptional differences between leiomyomas harboring different genetic alterations, including high mobility group AT-hook 2 rearrangements, mediator complex subunit 12 mutations, biallelic inactivation of fumarate hydratase, and collagen, type IV, alpha 5-collagen, type IV, alpha 6 deletions. The evidence presented herein strongly suggests that specific driver mutations are the major determinants of expression changes in leiomyomas. Here we highlight subtype-specific expression differences in key driver pathways and emphasize the utility of stratification in leiomyoma research. Finally, we offer a set of candidate biomarkers that will facilitate the molecular classification of leiomyomas.
Keywords: uterine leiomyoma, transcriptional profiling, MED12, HMGA2
Abstract
Uterine leiomyomas are common benign smooth muscle tumors that impose a major burden on women’s health. Recent sequencing studies have revealed recurrent and mutually exclusive mutations in leiomyomas, suggesting the involvement of molecularly distinct pathways. In this study, we explored transcriptional differences among leiomyomas harboring different genetic drivers, including high mobility group AT-hook 2 (HMGA2) rearrangements, mediator complex subunit 12 (MED12) mutations, biallelic inactivation of fumarate hydratase (FH), and collagen, type IV, alpha 5 and collagen, type IV, alpha 6 (COL4A5-COL4A6) deletions. We also explored the transcriptional consequences of 7q22, 22q, and 1p deletions, aiming to identify possible target genes. We investigated 94 leiomyomas and 60 corresponding myometrial tissues using exon arrays, whole genome sequencing, and SNP arrays. This integrative approach revealed subtype-specific expression changes in key driver pathways, including Wnt/β-catenin, Prolactin, and insulin-like growth factor (IGF)1 signaling. Leiomyomas with HMGA2 aberrations displayed highly significant up-regulation of the proto-oncogene pleomorphic adenoma gene 1 (PLAG1), suggesting that HMGA2 promotes tumorigenesis through PLAG1 activation. This was supported by the identification of genetic PLAG1 alterations resulting in expression signatures as seen in leiomyomas with HMGA2 aberrations. RAD51 paralog B (RAD51B), the preferential translocation partner of HMGA2, was up-regulated in MED12 mutant lesions, suggesting a role for this gene in the genesis of leiomyomas. FH-deficient leiomyomas were uniquely characterized by activation of nuclear factor erythroid 2-related factor 2 (NRF2) target genes, supporting the hypothesis that accumulation of fumarate leads to activation of the oncogenic transcription factor NRF2. This study emphasizes the need for molecular stratification in leiomyoma research and possibly in clinical practice as well. Further research is needed to determine whether the candidate biomarkers presented herein can provide guidance for managing the millions of patients affected by these lesions.
Uterine leiomyomas, also known as fibroids, are highly common benign tumors arising from the smooth muscle cells of the myometrium. Leiomyomas can cause a variety of health complications and are the leading indication for hysterectomy (1). The clinical and scientific community widely regards leiomyomas as a single entity, although substantial evidence of heterogeneity exists at several different levels, including symptoms, histopathology, therapeutic requirements, and genetic changes (2).
In terms of genetics, recent high-throughput sequencing studies have identified recurrent and mutually exclusive mutations in a limited number of key genes (3, 4), indicating the existence of molecularly distinct subtypes of leiomyomas. The currently established driver changes include high mobility group AT-hook 2 (HMGA2) rearrangements, mediator complex subunit 12 (MED12) mutations, and biallelic inactivation of fumarate hydratase (FH) (5). Leiomyomas with deletions affecting collagen, type IV, alpha 5 and collagen, type IV, alpha 6 (COL4A5-COL4A6) may constitute a rare fourth subtype (4). HMGA2 and MED12 represent the two most common driver genes and together contribute to 80–90% of all leiomyomas (5).
Less frequently, leiomyomas harbor 6p21 rearrangements affecting high mobility group AT-hook 1 (HMGA1) (6). Some of these rearrangements have been reported to co-occur with MED12 mutations, suggesting that a subset of HMGA1 rearrangements are secondary events (7). Leiomyomas also may harbor recurrent deletions and rearrangements of 7q22, 22q, and 1p (8–11). These deletions co-occur with other genetic alterations and may be secondary driver events, often present only in a subpopulation of tumor cells (4, 7, 8, 11–13).
Although several genetic defects underlying the development of leiomyomas have been discovered, the mechanisms of tumorigenesis remain poorly understood, and whether these mutations affect the same or different driver pathways is unclear. Previous expression profiling studies have discovered that hundreds of genes are differentially expressed between leiomyomas and normal myometrial tissue (9, 14–20); however, the majority of these studies have not accounted for the genetic background of the lesions examined. Therefore, we sought to explore the transcriptional differences and similarities among 94 leiomyomas from 60 patients harboring different genetic driver alterations, including HMGA2 rearrangements, MED12 mutations, biallelic inactivation of FH, COL4A5-COL4A6 deletions, and leiomyomas lacking these four driver changes, henceforth termed quadruple-negative leiomyomas. We also explored the transcriptional consequences of recurrent 7q22, 22q, and 1p deletions, aiming to identify the possible target genes.
Results
Unsupervised Hierarchical Clustering Reveals Distinct Expression Profiles Associated with Specific Driver Mutations.
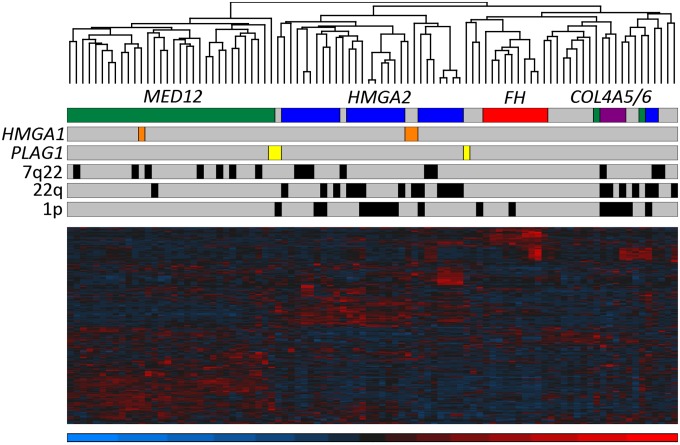
To identify possible expression patterns associated with driver mutations, we integrated genome-wide expression and genomic data of 94 leiomyomas. The selection of these leiomyomas is described in detail in SI Materials and Methods. As determined by the screening of known driver changes using whole genome sequencing (WGS), SNP arrays, and MED12 sequencing, the 94 leiomyomas included 27 with an HMGA2 rearrangement, 34 with a MED12 mutation, 10 with biallelic loss of FH, and 4 with a COL4A5-COL4A6 deletion (Dataset S1). Unsupervised hierarchical clustering analysis of exon array data revealed that the vast majority of leiomyomas clustered according to the mutation status of these four driver genes (Fig. 1).
Fig. 1.
Unsupervised hierarchical clustering of 94 leiomyomas from 60 patients. Hierarchical clustering using 1% most variable genes revealed that most leiomyomas grouped together according to the mutation status of MED12 (green), HMGA2 (blue), FH (red), and COL4A5-COL4A6 (purple). The remaining quadruple-negative leiomyomas exhibited transcriptional heterogeneity and clustered into several unique branches; however, four of these clustered with leiomyomas of the HMGA2 subtype, and two of them were found to harbor a genetic HMGA1 alteration (orange). One leiomyoma (MY5008 m3) harbored both an HMGA1 alteration and a MED12 mutation, and consequently clustered with leiomyomas of the MED12 subtype. We identified genetic PLAG1 alterations (yellow) in three leiomyomas. Although one of these tumors (MY16 m1) also harbored a MED12 mutation and clustered with the MED12 subtypes, all three tumors also displayed expression signatures similar to those seen in leiomyomas with HMGA2 or HMGA1 alterations. Chromosomal deletions of 7q22, 22q, and 1p had no major influence on the clustering.
Pathway Enrichment Analysis Using Differentially Expressed Genes.
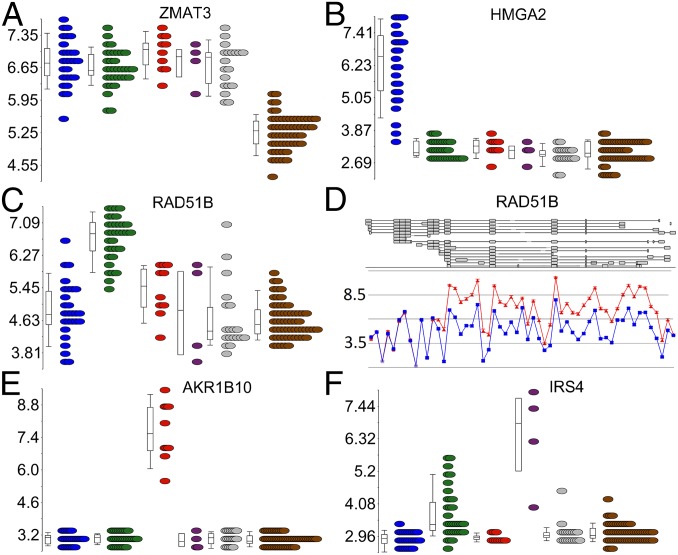
To identify genes differentially expressed in the complete set of leiomyomas, we compared all 94 leiomyomas against the corresponding 60 myometrium tissue specimens. This comparison identified 135 genes as significantly differentially expressed [q <0.05; –2> fold change (FC) >2] (Dataset S2). Zinc finger, matrin type 3 (ZMAT3) was the most significant gene, up-regulated in all leiomyomas regardless of subtype (Fig. 2A).
Fig. 2.
Examples of shared and uniquely expressed genes. (A) ZMAT3 was the most significantly differentially expressed gene in all leiomyomas compared with the normal myometrial tissue (brown). (B) HMGA2 was the most uniquely expressed gene in leiomyomas of the HMGA2 (blue) subtype. (C) RAD51B was the most uniquely expressed gene in leiomyomas of the MED12 (green) subtype. (E) AKR1B10 was the most uniquely expressed gene in leiomyomas of the FH (red) subtype. (F) IRS4 was the most uniquely expressed gene in leiomyomas of the COL4A5-COL4A6 (purple) subtype. (D) Exon-level analysis revealed that the overexpression of RAD51B in MED12 mutant leiomyomas originated predominantly from a noncoding transcript (ENST00000492236).
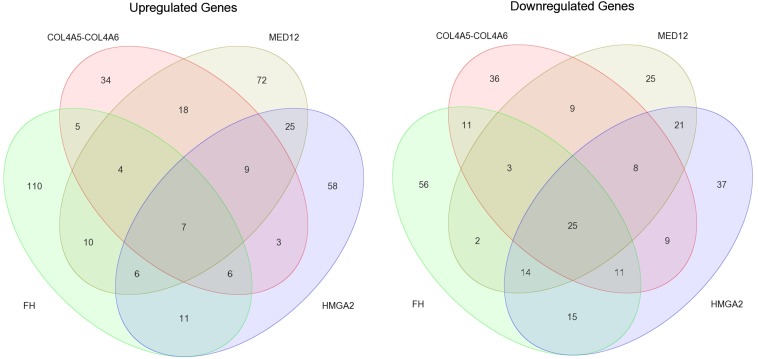
To identify genes differentially expressed in leiomyomas of the HMGA2, MED12, FH, and COL4A5-COL4A6 subtypes, we compared leiomyomas of each subtype against all of the myometrium tissue specimens. This revealed 265 genes significantly differentially expressed in leiomyomas of the HMGA2 subtype, 258 genes significantly differentially expressed in leiomyomas of the MED12 subtype, 296 genes significantly differentially expressed in leiomyomas of the FH subtype, and 198 genes as significantly differentially expressed in leiomyomas of the COL4A5-COL4A6 subtype (q <0.05; –2> FC >2) (Fig. S1 and Dataset S2). Differential expression analysis was not performed with the quadruple-negative leiomyomas, owing to the high transcriptional heterogeneity revealed by the clustering analysis.
Fig. S1.
Venn diagram illustrating the number of shared and uniquely differentially expressed genes (q <0.05; –2> FC >2) among leiomyomas of the HMGA2, MED12, FH, and COL4A5-COL4A6 subtypes. Leiomyomas of the MED12 and HMGA2 subtypes shared the most differentially expressed genes, and leiomyomas of the FH subtype exhibited the most uniquely differentially expressed genes.
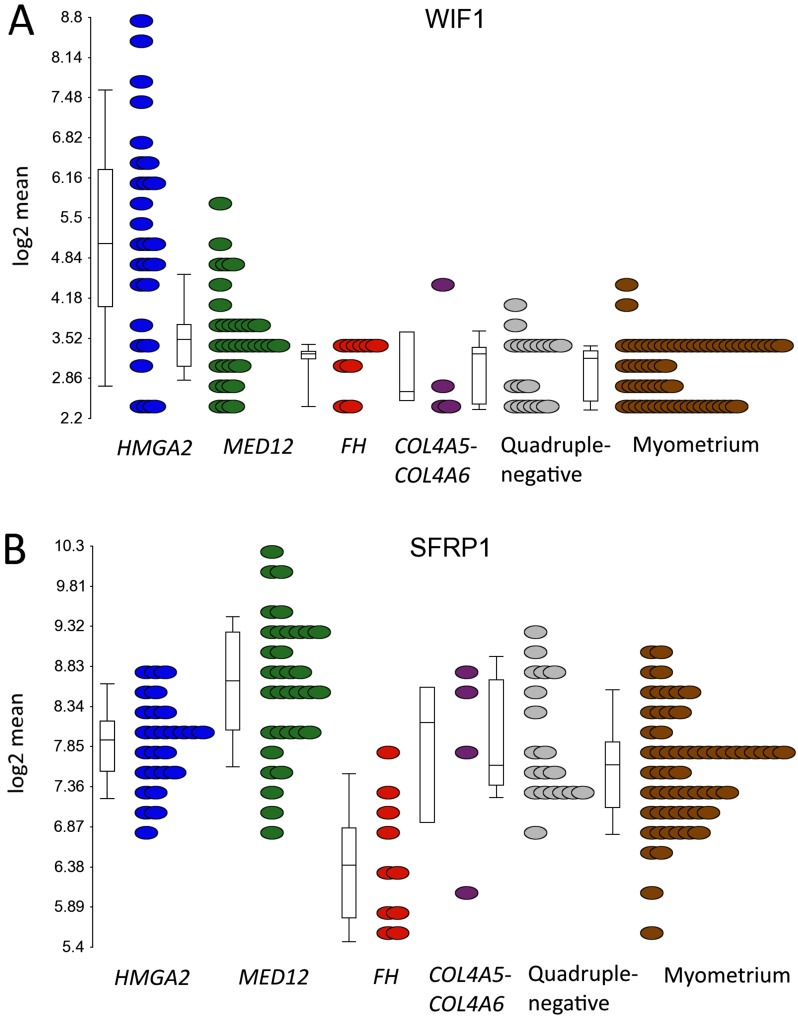
Ingenuity Pathway Analysis (IPA) was performed with each of the five gene lists obtained from the differential expression analyses (Dataset S3). The most significant pathways among the different subgroups are compared in Table S1. The Wnt/β-catenin pathway was among the most significantly dysregulated pathways in the complete set of leiomyomas, and was predicted to be inhibited according to IPA. In addition, the Wnt antagonists Wnt inhibitory factor 1 (WIF1) and secreted frizzled-related protein 1 (SFRP1) (21) were significantly up-regulated in leiomyomas of the HMGA2 and MED12 subtypes, respectively (Dataset S2 and Fig. S2).
Table S1.
The most significantly enriched pathways in different leiomyoma subtypes according to IPA
| Ingenuity canonical pathway | All leiomyomas | HMGA2 | MED12 | FH | COL4A5-COL4A6 | |||||
| q-value | z-score | q-value | z-score | q-value | z-score | q-value | z-score | q-value | z-score | |
| Inhibition of matrix metalloproteases | 8.3E-04 | NaN | 1.8E-01 | NaN | 2.2E-04 | NaN | 2.0E-01 | NaN | NaN | NaN |
| Colorectal cancer metastasis signaling | 1.4E-03 | −0.3 | 3.1E-02 | −0.3 | 1.1E-06 | −0.5 | 3.5E-01 | −1.6 | 2.8E-01 | −1.6 |
| RAR activation | 1.5E-03 | NaN | 8.3E-02 | NaN | 1.2E-02 | NaN | 1.9E-01 | NaN | 2.8E-01 | NaN |
| Glucocorticoid receptor signaling | 2.4E-03 | NaN | 1.9E-02 | NaN | 1.1E-02 | NaN | 6.3E-01 | NaN | 3.4E-01 | NaN |
| Wnt/β-catenin signaling | 2.7E-03 | −0.5 | 4.2E-02 | −0.5 | 6.9E-04 | −0.7 | 1.6E-01 | −0.8 | 8.3E-02 | 0.5 |
| Endothelin-1 signaling | 2.7E-03 | −1.9 | 1.6E-02 | −1.7 | 5.4E-02 | −1.6 | 3.5E-01 | −0.5 | 3.3E-01 | −2.0 |
| Prolactin signaling | 2.7E-03 | 0.5 | 1.6E-02 | 1.6 | 3.4E-03 | 0.8 | 7.7E-01 | NaN | 2.8E-01 | NaN |
| Granulocyte adhesion and diapedesis | 2.8E-03 | NaN | 2.8E-01 | NaN | 9.6E-03 | NaN | 7.4E-01 | NaN | NaN | NaN |
| Agranulocyte adhesion and diapedesis | 3.8E-03 | NaN | 2.9E-01 | NaN | 4.6E-03 | NaN | 5.8E-01 | NaN | NaN | NaN |
| Bladder cancer signaling | 4.3E-03 | NaN | 4.2E-02 | NaN | 6.9E-03 | NaN | 2.4E-01 | NaN | NaN | NaN |
| IGF1 signaling | 6.5E-03 | NaN | 5.4E-02 | NaN | 3.2E-02 | NaN | 4.8E-01 | NaN | 2.8E-01 | NaN |
| Role of macrophages, fibroblasts, and endothelial cells in rheumatoid arthritis | 7.4E-03 | NaN | 5.4E-02 | NaN | 5.3E-05 | NaN | 3.5E-01 | NaN | 4.4E-01 | NaN |
| HIF1α signaling | 7.4E-03 | NaN | 2.4E-01 | NaN | 3.4E-03 | NaN | 5.1E-01 | NaN | 6.5E-01 | NaN |
| Growth hormone signaling | 1.0E-02 | NaN | 3.1E-02 | 1.0 | 1.2E-02 | 1.0 | 3.5E-01 | NaN | 5.6E-01 | NaN |
| PI3K signaling in B lymphocytes | 1.3E-02 | −2.2 | 4.2E-02 | −2.5 | 2.5E-03 | −2.5 | 3.5E-01 | −2.0 | 2.8E-01 | NaN |
| Neuropathic pain signaling in dorsal horn neurons | 2.8E-02 | 0.0 | 1.6E-02 | 0.4 | 8.1E-02 | 0.0 | 2.7E-01 | 0.0 | 4.2E-01 | NaN |
| IL-8 signaling | 3.6E-02 | −0.5 | 3.1E-02 | 0.0 | 3.2E-02 | −1.1 | NaN | NaN | 3.4E-01 | −2.0 |
| Hepatic fibrosis/hepatic stellate cell activation | 3.6E-02 | NaN | 3.1E-02 | NaN | 9.8E-06 | NaN | 1.7E-01 | NaN | 4.2E-01 | NaN |
| d-myo-inositol-5-phosphate metabolism | 5.3E-02 | NaN | 3.1E-02 | NaN | 2.9E-01 | NaN | 6.5E-01 | NaN | 5.2E-01 | NaN |
| Axonal guidance signaling | 6.3E-02 | NaN | 1.5E-01 | NaN | 2.5E-03 | NaN | 2.4E-01 | NaN | 2.8E-01 | NaN |
| Glioma signaling | 7.6E-02 | NaN | 3.1E-02 | 1.6 | 1.7E-01 | NaN | NaN | NaN | NaN | NaN |
| Complement system | 7.9E-02 | NaN | 3.1E-02 | NaN | 4.6E-02 | NaN | 1.9E-01 | NaN | 2.8E-01 | NaN |
| NRF2-mediated oxidative stress response | 8.1E-02 | NaN | 7.2E-02 | NaN | 1.2E-01 | NaN | 2.3E-02 | 1.3 | 3.3E-01 | NaN |
| Glioblastoma multiforme signaling | 1.4E-01 | NaN | 3.1E-02 | 0.0 | 7.8E-02 | 1.3 | 7.7E-01 | NaN | 3.7E-01 | NaN |
| Role of osteoblasts, osteoclasts, and chondrocytes in rheumatoid arthritis | 2.3E-01 | NaN | 5.1E-01 | NaN | 3.4E-03 | NaN | 3.5E-01 | NaN | 2.8E-01 | NaN |
| Pentose phosphate pathway | NaN | NaN | NaN | NaN | NaN | NaN | 3.9E-02 | NaN | NaN | NaN |
A positive z-score indicates a predicted activation, and a negative z-score indicates a predicted inactivation of the enriched pathway. NaN, a z-score cannot be calculated for all Ingenuity canonical pathways.
Fig. S2.
mRNA expression of the Wnt antagonists WIF1 and SFRP1 in different uterine leiomyoma subtypes. (A) Leiomyomas of the HMGA2 subtype displayed a significant up-regulation of the Wnt inhibitor WIF1 (FC = 4.7). (B) Leiomyomas of the MED12 subtype displayed a significant up-regulation of the Wnt inhibitor SFRP1 (FC = 2.1).
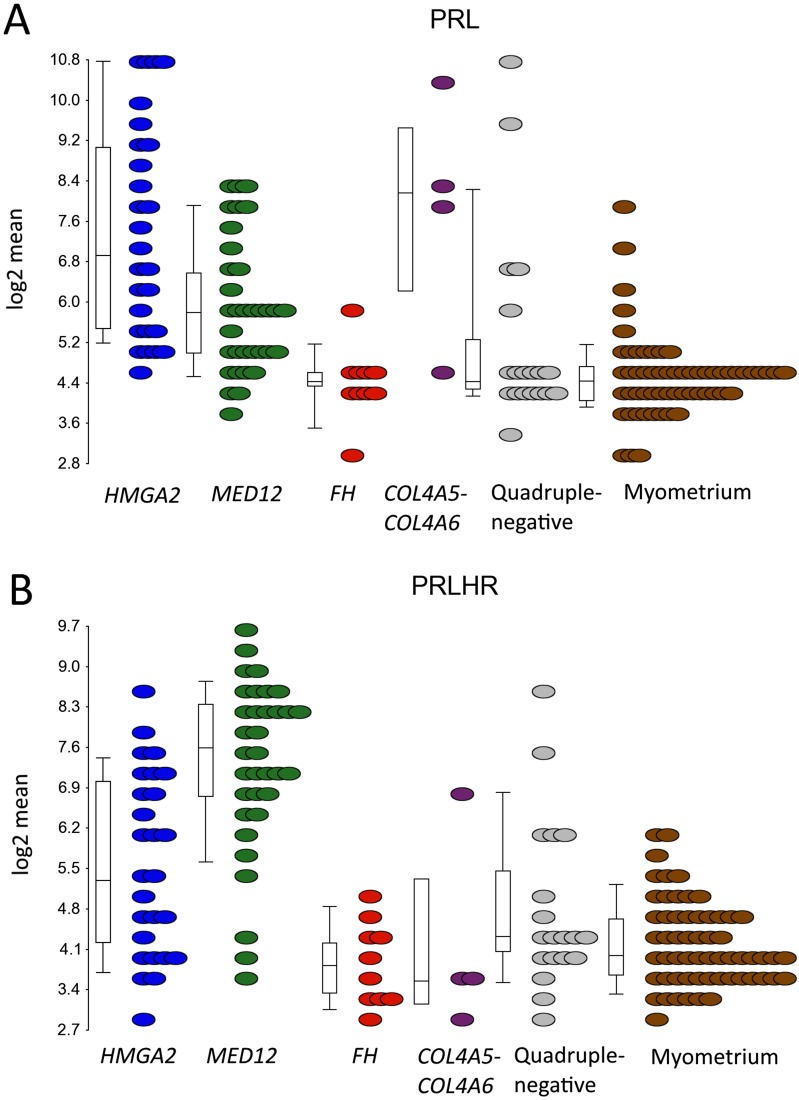
IPA also revealed a significant activation of prolactin signaling in leiomyomas. Indeed, prolactin (PRL) was one the most up-regulated genes in the complete set of leiomyomas (FC = 3.0; Dataset S2), and was significantly up-regulated in leiomyomas of the HMGA2 (FC = 7.6), MED12 (FC = 2.6), and COL4A5-COL4A6 (FC = 9.9) subtypes (Dataset S2 and Fig. S3A). Prolactin-releasing hormone receptor (PRLHR) was also one the most up-regulated genes in the complete set (FC = 3.0; Dataset S2), and was significantly up-regulated in leiomyomas of the HMGA2 (FC = 2.7) and MED12 (FC = 9.0) subtypes (Dataset S2 and Fig. S3B).
Fig. S3.
mRNA expression of PRL and PRLHR in different uterine leiomyoma subtypes. (A) PRL was significantly up-regulated in three subtypes (HMGA2, MED12, and COL4A5-COL4A6), and particularly high expression was seen in leiomyomas of the HMGA2 (FC = 7.6) and COL4A5-COL4A6 (FC = 9.9) subtypes. (B) In contrast, PRLHR was significantly up-regulated in two subtypes (HMGA2 and MED12), and particularly high expression was seen in leiomyomas of the MED12 subtype (FC = 9.0).
Uniquely Expressed Genes in Different Leiomyoma Subtypes.
To identify the most uniquely expressed genes for each leiomyoma subtype, we compared each subtype against the other leiomyomas and myometrium samples (Dataset S4). These genes represent candidate biomarkers of the different leiomyoma subtypes. The 20 most uniquely expressed (q <0.05; –2> FC >2) protein-coding genes for each subtype are presented in Table 1. Below we highlight some of these genes and their association with significantly dysregulated pathways.
Table 1.
The 20 most uniquely expressed genes in each respective leiomyoma subtype
| HMGA2: gene | q-value | FC | MED12: gene | q-value | FC | FH: gene | q-value | FC | COL4A5/6: gene | q-value | FC |
| HMGA2 | 5.0E-33 | 10.3 | RAD51B | 6.4E-22 | 3.8 | AKR1B10 | 4.1E-42 | 27.1 | IRS4 | 3.4E-08 | 10.5 |
| IGF2BP2 | 6.0E-28 | 4.4 | PLP1 | 3.5E-20 | 3.2 | TKT | 6.7E-35 | 4.4 | NSG1 | 8.8E-08 | 2.2 |
| CCND2 | 7.9E-18 | 2.5 | GARNL3 | 2.4E-19 | 2.3 | PDK1 | 2.8E-24 | 3.6 | MXRA8 | 4.9E-05 | −2.5 |
| IL11RA | 7.7E-17 | 2.7 | KIAA1199 | 2.8E-18 | 5.7 | SLC7A11 | 4.8E-24 | 7.2 | FBLN1 | 4.9E-05 | −3.8 |
| C19orf38 | 1.3E-15 | 3.0 | LAMP5 | 3.0E-18 | 5.1 | G6PD | 9.9E-22 | 3.9 | PCSK2 | 2.1E-04 | 3.3 |
| PLAG1 | 3.1E-15 | 8.2 | MMP11 | 6.7E-18 | 5.5 | PIR | 1.7E-21 | 3.2 | DPYD | 5.7E-04 | −2.7 |
| GRPR | 1.2E-13 | 8.3 | ADAM12 | 8.7E-17 | 8.8 | GCLM | 4.1E-21 | 3.7 | SPATA6 | 7.2E-04 | −2.0 |
| PAPPA2 | 7.4E-13 | 7.1 | POPDC2 | 9.7E-17 | 3.2 | SRXN1 | 4.6E-18 | 2.4 | CTNNA3 | 7.7E-04 | 2.5 |
| PLA2R1 | 7.4E-13 | −4.3 | CPA3 | 2.8E-15 | −5.0 | ENTPD7 | 1.1E-17 | 4.1 | TMEM55A | 6.9E-03 | 2.1 |
| TBX3 | 3.1E-12 | −2.4 | THSD4 | 4.7E-15 | 2.5 | TNFRSF21 | 3.1E-16 | 10.3 | PCDHB8 | 9.3E-03 | 2.4 |
| CBLN4 | 3.7E-12 | 3.1 | CACNA1C | 5.6E-15 | 2.1 | SLC6A6 | 8.7E-15 | 4.8 | SCG2 | 1.4E-02 | 8.7 |
| GPR20 | 1.6E-11 | 2.7 | MMP16 | 8.0E-15 | 4.0 | NQO1 | 6.4E-13 | 7.3 | SLAIN1 | 1.6E-02 | −2.1 |
| GPR22 | 4.6E-11 | 4.1 | CNTROB | 1.6E-14 | 2.2 | BNIP3 | 9.4E-13 | 3.0 | PLAGL1 | 1.8E-02 | −2.5 |
| QPRT | 5.5E-11 | 2.0 | NHSL2 | 1.6E-14 | 2.0 | RNF128 | 1.2E-12 | 2.4 | PARM1 | 1.9E-02 | −3.0 |
| PAWR | 8.7E-11 | −2.7 | KCNAB3 | 1.9E-14 | 3.1 | MGAT5 | 2.5E-12 | 2.5 | LIX1 | 2.0E-02 | 2.4 |
| MB21D2 | 1.1E-10 | 2.3 | UNC5D | 6.0E-14 | 2.8 | PGD | 2.7E-11 | 3.0 | RHOB | 2.0E-02 | −2.0 |
| CCND1 | 2.5E-10 | 3.6 | HPGDS | 9.1E-14 | −2.4 | FAM46C | 2.7E-11 | 4.4 | TGFBR3 | 2.3E-02 | −2.0 |
| WIF1 | 3.3E-10 | 5.0 | PCP4 | 1.2E-13 | 3.3 | AEBP1 | 4.2E-11 | −3.9 | HIST1H4H | 3.1E-02 | 2.1 |
| EGFR | 4.2E-10 | −2.2 | WBSCR17 | 1.4E-13 | 2.2 | SESN3 | 2.4E-10 | 4.0 | COL4A5 | 3.6E-02 | −3.7 |
| AVPR1A | 4.7E-10 | −4.3 | RUNDC1 | 1.4E-13 | 2.2 | ABCC3 | 5.6E-10 | 2.1 | PCDHB2 | 3.7E-02 | 4.4 |
Uniquely Expressed Genes in Leiomyomas of the HMGA2 Subtype.
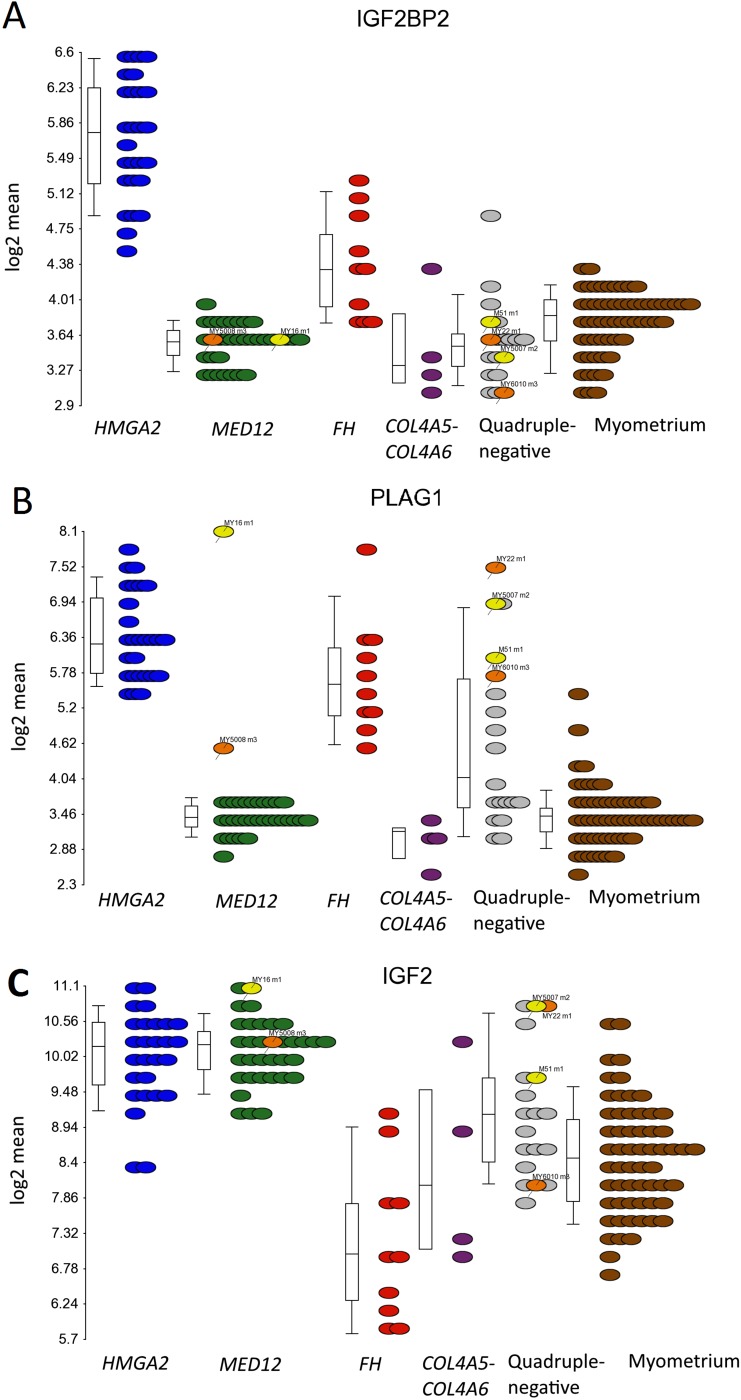
We identified HMGA2 itself as the most uniquely expressed gene (FC = 10.3) in leiomyomas of the HMGA2 subtype (Table 1 and Fig. 2B). Insulin-like growth factor 2 mRNA-binding protein 2 (IGF2BP2), one of the few genes previously proven to be directly regulated by HMGA2 (22), was the second-most significant gene (FC = 4.4; Fig. S4A). The proto-oncogene pleomorphic adenoma gene 1 (PLAG1) also was among the most uniquely expressed genes (FC = 8.2; Fig. S4B). Up-regulation (FC = 5.7) of PLAG1 also was seen in three leiomyomas found to harbor an HMGA1 alteration (Dataset S2). Only 2 out of 34 leiomyomas of the MED12 subtype exhibited up-regulation of PLAG1 (FC >2), and one of these harbored an HMGA1 alteration (My5008 m3; FC = 2.6). The other tumor (My16 m1; FC = 17.5) was identified to harbor a balanced translocation, t(6, 8)(q13;q12), with breakpoints located ∼2.3 kbp downstream of PLAG1 and ∼21.9 kbp downstream of COL12A1 (Dataset S5). Further examination revealed up-regulation of PLAG1 in two quadruple-negative leiomyomas (My5007 m2; FC = 11.3 and M51 m1; FC = 7.5) harboring a whole chromosome 8 duplication (Dataset S6). Leiomyomas with a genetic PLAG1 alteration also displayed similar expression patterns as seen in leiomyomas with HMGA2 or HMGA1 alterations (Fig. 1). One of these (My5007 m2) also clustered with leiomyomas of the HMGA2 subtype.
Fig. S4.
mRNA overexpression of IGF2BP2, PLAG1, and IGF2 in leiomyomas of the HMGA2 subtype. (A) Statistical analysis identified IGF2BP2 as the second-most uniquely expressed gene (FC = 4.4) in leiomyomas of the HMGA2 subtype (blue dots). (B) The proto-oncogene PLAG1 also was among the most uniquely expressed genes (FC = 8.2). Up-regulation of PLAG1 (FC = 5.7) was also seen among the three leiomyomas with genetic HMGA1 alterations (orange dots). Three leiomyomas harbored a genetic PLAG1 alteration (yellow dots) and showed a highly significant up-regulation of PLAG1 (FC = 12.5). (C) PLAG1 is known to regulate the expression of IGF2, and we detected a significant up-regulation (FC = 3.0) of IGF2 in leiomyomas of the HMGA2 subtype. A significant up-regulation of IGF2 was also seen in the leiomyomas with a genetic PLAG1 alteration (FC = 4.3) and in two out of three leiomyomas with a HMGA1 alteration (FC > 2). Of note, leiomyomas of the MED12 subtype also displayed a significant up-regulation of IGF2 (FC = 3.1), and whereas leiomyomas of the FH subtype displayed a significant up-regulation of PLAG1 (FC = 4.8), surprisingly, IGF2 was down-regulated in these lesions (FC = –2.5).
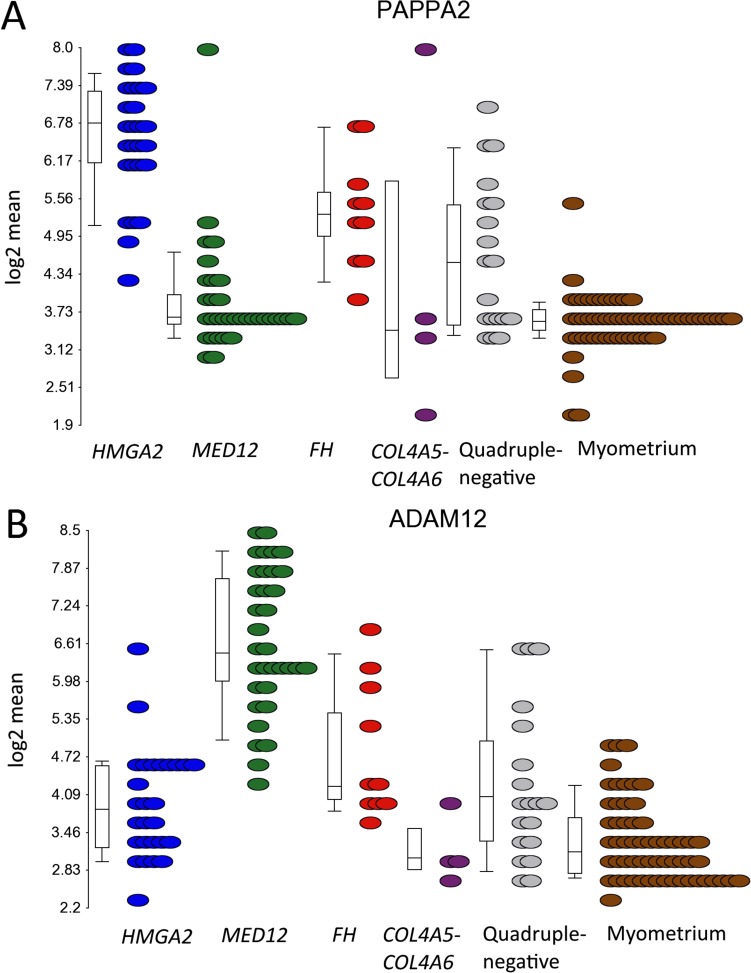
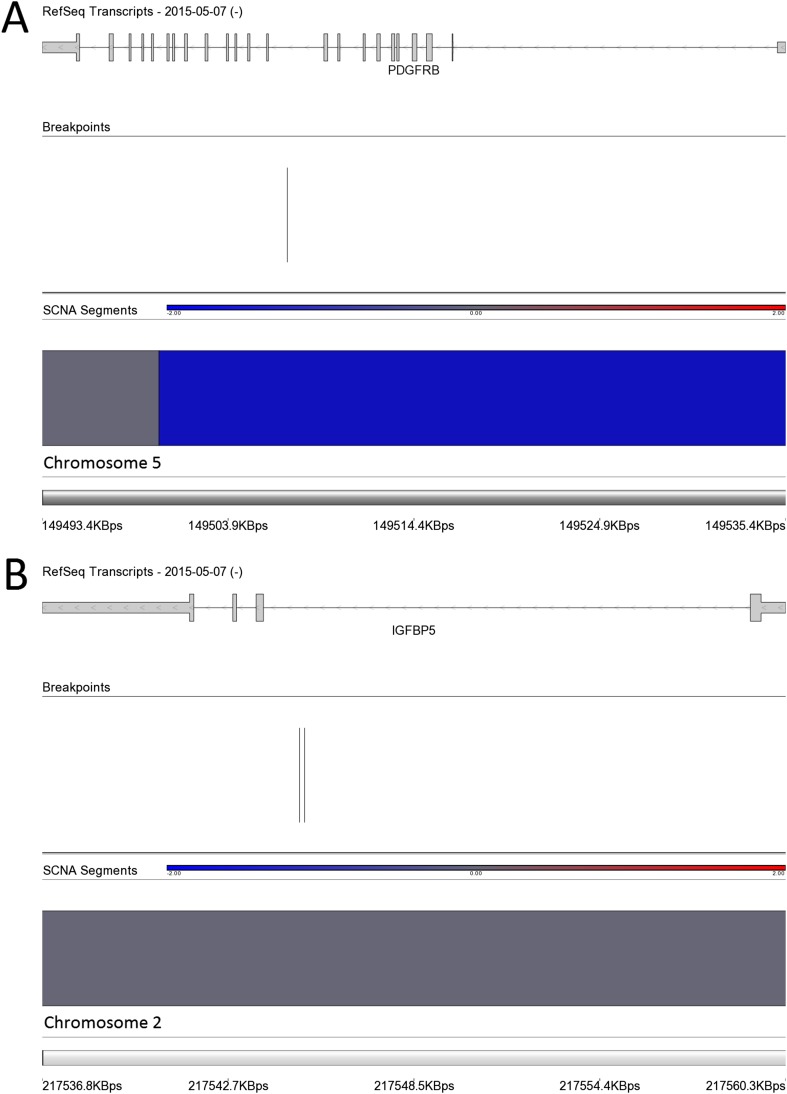
Insulin-like growth factor-2 (IGF2) has previously been shown to be directly regulated by PLAG1 (23–25), and we detected a significant up-regulation of IGF2 in leiomyomas of the HMGA2 (FC = 3.0) and MED12 (FC = 3.1) subtypes (Dataset S2 and Fig. S4C). A significant up-regulation (FC = 4.3) of IGF2 was detected in the leiomyomas with a genetic PLAG1 alteration as well (Dataset S2 and Fig. S4C). Leiomyomas of the HMGA2 subtype also displayed a unique up-regulation of pappalysin 2 (PAPPA2) (FC = 7.1; Fig. S5A), a gene encoding for an insulin-like growth factor-binding protein 5 (IGFBP-5) protease (26). Interestingly, we found one quadruple-negative leiomyoma harboring a fusion gene joining exon 1 of IGFBP5 to exon 11 of platelet-derived growth factor receptor, beta polypeptide (PDGFRB) (Dataset S5 and Fig. S6).
Fig. S5.
mRNA expression of the PAPPA2 and ADAM12 in different uterine leiomyoma subtypes. (A) Leiomyomas of the HMGA2 subtype displayed a significant up-regulation of the PAPPA2 (FC = 7.9). (B) Leiomyomas of the MED12 subtype displayed a significant up-regulation of the ADAM12 (FC = 10.5).
Fig. S6.
Chromosomal rearrangements in a quadruple-negative leiomyoma (M18 m1) resulting in a fusion gene involving the 5′ end IGFBP5 (A) and the 3′ end of PDGFRB (B). The breakpoints were located in intron 1 of IGFBP5 and in intron 10 of PDGFRB.
Uniquely Expressed Genes in Leiomyomas of the MED12 Subtype.
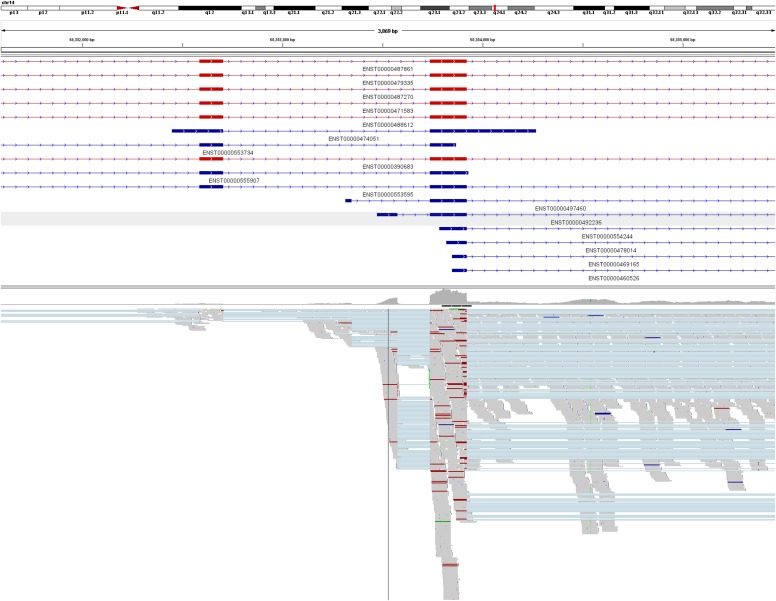
We identified RAD51 paralog B (RAD51B) as the most uniquely expressed gene (FC = 3.8) in leiomyomas of the MED12 subtype (Table 1 and Fig. 2C). Exon-level analysis, confirmed by RNA sequencing, revealed that the up-regulation originated predominantly from a noncoding transcript of RAD51B (ENST00000492236; Fig. 2D and Fig. S7). Of note, expression of this noncoding transcript also was seen at lower levels in the corresponding myometrium samples. We also detected a unique up-regulation of ADAM metallopeptidase domain 12 (ADAM12) (FC = 8.8; Fig. S5B), another IGFBP-5 protease (27).
Fig. S7.
RNA sequencing validation of the up-regulated noncoding transcript of RAD51B in leiomyomas of the MED12 subtype. Illustrated are read alignments at the RAD51B locus in two pooled MED12 mutant samples (MY18 m1 and MY23 m1). Protein-coding transcripts are marked in red; noncoding transcripts, in blue. As observed with the exon arrays, the overexpression of RAD51B originates predominately from a noncoding transcript of RAD51B (ENST00000492236).
Uniquely Expressed Genes in Leiomyomas of the FH Subtype.
We identified aldo-keto reductase family 1, member B10 (aldose reductase) (AKR1B10) as the most uniquely expressed gene (FC = 27.0) in leiomyomas of the FH subtype (Table 1). Expression of AKR1B10 was not seen in any of the other leiomyoma or myometrium samples (Fig. 2E). The NRF2-mediated oxidative stress response was the most significantly dysregulated pathway in leiomyomas of the FH subtype (Table S1). Furthermore, 8 of the 20 most uniquely expressed genes (AKR1B10, TKT, PIR, SLC7A11, NQO1, SRXN1, SLC6A6, and GCLM) have previously been reported as targets of the transcription factor nuclear factor erythroid 2-related factor 2 (NRF2) (28–31). The pentose phosphate pathway was the only other statistically significant pathway, and three (TKT, PGD, and G6PD) of the 20 most uniquely expressed genes encode for key enzymes of this pathway. None of the other leiomyoma subtypes displayed dysregulation of these two pathways (Table S1).
Uniquely Expressed Genes in Leiomyomas of the COL4A5-COL4A6 Subtype.
Although COL4A5 and COL4A6 are both affected by the characteristic COL4A5-COL4A6 deletions, only COL4A5 displayed a statistically significant down-regulation compared with the myometrium (FC = –3.3; Dataset S2). However, we identified insulin receptor substrate-4 (IRS4), a gene located adjacent to COL4A5, as the most uniquely expressed gene in these leiomyomas (FC = 10.5; Table 1 and Fig. 2F). No pathway reached statistical significance (Table S1).
Identification of Down-Regulated Genes Within Commonly Deleted Regions on Chromosomes 7q22, 22q, and 1p.
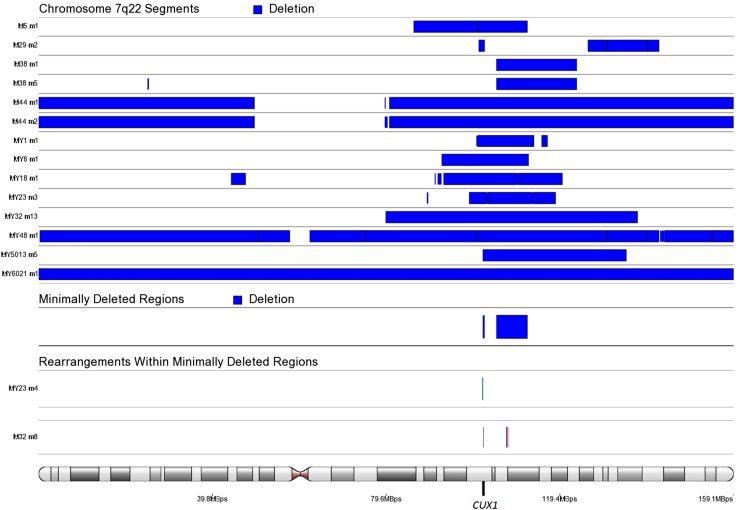
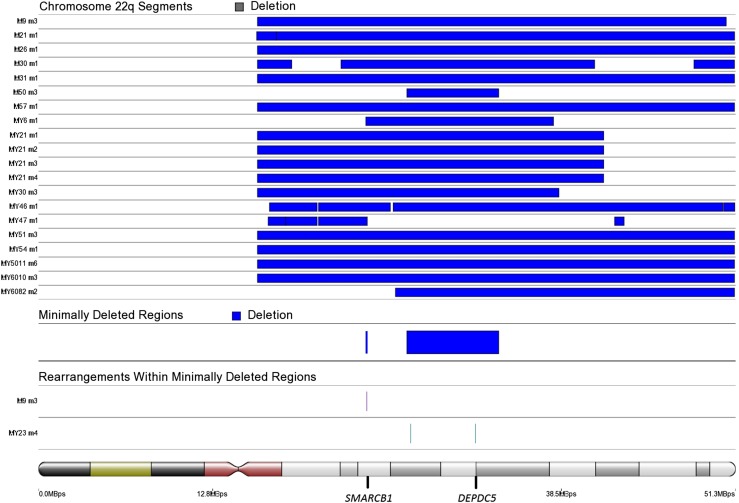
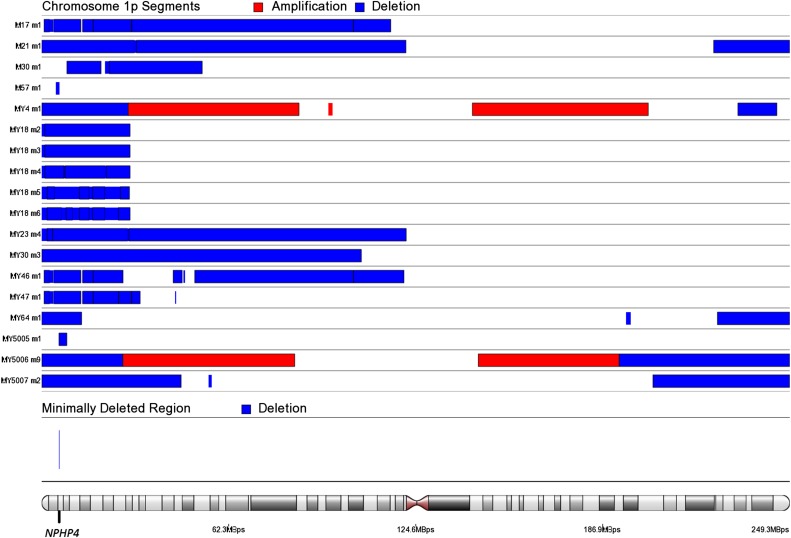
To identify genes most significantly down-regulated by chromosome 7q22, 22q, and 1p deletions, we compared leiomyomas harboring these deletions against leiomyomas and myometrium tissue specimens lacking these aberrations. A total of 14 leiomyomas harbored a deletion spanning 7q22 (Fig. S8). In addition, two leiomyomas harbored chromosomal rearrangements affecting cut-like homeobox 1 (CUX1) on 7q22 (Dataset S5 and Fig. S8). A total of 20 leiomyomas harbored a 22q deletion, including 5 leiomyomas harboring a “second hit” truncating mutation affecting DEP domain containing 5 (DEPDC5) (Fig. S9 and Dataset S1). We identified one additional leiomyoma (MY23 m4) harboring a chromosomal rearrangement with breakpoints located ∼14 kbp upstream of DEPDC5 (Dataset S5). Another minimally deleted region was identified on 22q, and one leiomyoma (M9 m3) harbored an additional rearrangement within this region, resulting in a second hit loss of the SWI/SNF-related, matrix-associated, actin-dependent regulator of chromatin, subfamily b, member 1 (SMARCB1) gene (Fig. S9 and Dataset S5). A total of 18 leiomyomas harbored a 1p deletion, and the minimally deleted region contained only one protein-coding gene, nephronophthisis 4 (NPHP4) (Fig. S10). Table 2 presents the 10 most significantly down-regulated protein-coding genes (q <0.05) within commonly deleted regions, and the number times that each gene was affected by a deletion.
Fig. S8.
SCNAs affecting chromosome 7q22. We identified 104849448–111900000 as the minimally deleted region. Another, less commonly deleted region was identified on 101732303–102100000. This region contained the putative target gene CUX1. Two additional samples harbored chromosomal rearrangements that disrupted the CUX1 gene.
Fig. S9.
SCNAs affecting chromosome 22q. We identified 27111559–33871686 as the minimally deleted region on chromosome 22q. We analyzed this region further, and identified one additional leiomyoma (MY23 m4) harboring chromosomal rearrangements within this region. One of the breakpoints was located ∼14 kbp upstream of the putative target gene DEPDC5. Another, less commonly deleted region was identified on 24087031–24200000. We analyzed this region further, and identified one leiomyoma (M9 m3) as harboring an additional rearrangement within this region, resulting in a second hit disruption of the tumor suppressor SMARCB1.
Fig. S10.
SCNAs affecting chromosome 1p. We identified Chr1:5753010–5953574 as the minimally deleted region on chromosome 1p. This region contained only one protein-coding gene: NPHP4.
Table 2.
The 10 most significantly down-regulated genes by 7q22, 22q, and 1p deletions
| 7q22: gene | q-value | FC | No. of samples | 22q: gene | q-value | FC | No. of samples | 1p: gene | q-value | FC | No. of samples |
| LMTK2 | 1.9E-04 | −1.3 | 8 | FBXO7 | 1.1E-12 | −1.4 | 19 | UBE4B | 6.6E-11 | −1.5 | 16 |
| COPS6 | 7.5E-04 | −1.3 | 9 | MTMR3 | 7.6E-12 | −1.4 | 19 | EXOSC10 | 5.7E-08 | −1.3 | 16 |
| CUX1 | 7.9E-04 | −1.5 | 13 | DEPDC5 | 5.6E-08 | −1.3 | 19 | DNAJC16 | 5.7E-08 | −1.2 | 15 |
| MLL5 | 2.0E-03 | −1.4 | 11 | RNF185 | 1.6E-07 | −1.5 | 19 | GNB1 | 8.1E-08 | −1.3 | 15 |
| TNPO3 | 2.0E-03 | −1.3 | 8 | EIF3D | 2.0E-07 | −1.3 | 18 | PRDM2 | 9.9E-08 | −1.3 | 15 |
| ZNF800 | 4.6E-03 | −1.2 | 7 | DUSP18 | 4.0E-07 | −1.4 | 19 | FAM54B | 1.4E-07 | −1.4 | 15 |
| PNPLA8 | 1.9E-02 | −1.4 | 13 | TTC28 | 7.5E-07 | −1.4 | 19 | VPS13D | 1.4E-07 | −1.5 | 16 |
| ZNF394 | 2.0E-02 | −1.3 | 9 | EP300 | 8.3E-07 | −1.3 | 15 | RERE | 2.5E-07 | −1.5 | 17 |
| CADPS2 | 2.0E-02 | −2 | 8 | MAPK1 | 1.2E-06 | −1.3 | 16 | KIF1B | 6.0E-07 | −1.5 | 16 |
| PMPCB | 2.1E-02 | −1.4 | 11 | MKL1 | 1.3E-06 | −1.4 | 16 | CLSTN1 | 9.8E-07 | −1.5 | 16 |
SI Materials and Methods
Study Subjects.
This research was approved by the Ethics Review Board of Helsinki University Hospital. All samples were collected in accordance with Finnish laws and regulations with permission from the director of the health care unit. The study materials were derived from five different tissue collections (3–5), one consisting of anonymous patients and the other four consisting of patients who provided signed informed consent before entering the study.
DNA, RNA, and cDNA Sample Preparation.
DNA was extracted from fresh-frozen tissue specimens using the FastDNA Kit (MP Biomedicals). Quality and quantity of the extracted DNA were measured using the Quant-iT PicoGreen dsDNA Assay Kit (Invitrogen). RNA was extracted using either TRIzol Reagent (Invitrogen) or Tri Reagent RT (Molecular Research Center) and purified with the RNeasy MinElute Cleanup Kit (Qiagen). The concentration and purity of the extracted RNA were assessed using an Agilent 2100 Bioanalyzer. Extracted RNA was converted to cDNA according to standard procedures.
Sample Selection and Mutational Screening of Driver Mutations.
A total of 94 leiomyoma and 60 corresponding myometrium samples were investigated in this study (Dataset S1). The dataset was selected to include all 38 leiomyomas previously characterized by WGS, 10 leiomyomas previously identified to harbor biallelic loss of FH, and 5 leiomyomas previously identified to harbor a second hit DEPDC5 point mutation (2, 3). The dataset was also selected to include leiomyomas previously identified to harbor deletions on chromosome 22q. WGS data were available for 63 leiomyoma samples and 31 corresponding myometrium samples. SNP array data were available for 50 leiomyoma samples and 36 corresponding myometrium samples. All leiomyomas were screened for MED12 exons 1 and 2 mutations using Sanger sequencing with primers as reported previously (3). All samples were screened for rearrangements and deletions affecting HMGA2, HMGA1, and COL4A5-COL4A6 using WGS and/or SNP arrays. WGS data were not available for 31 leiomyomas, 6 of which were classified as HMGA2 subtype leiomyomas owing to their high level (FC >4) of HMGA2 expression compared with their respective myometrium samples (Dataset S1). All samples were also screened for 7q22, 22q, and 1p deletions and for rearrangements located within the minimally deleted regions of these.
In addition to known driver changes, we identified one leiomyoma harboring a complex chromosomal rearrangement affecting intron 1 of IGFBP5 and intron 10 of PDGFRB (Dataset S5). This rearrangement was validated using primers 5′-TAGGGAGTCCTGTCCCACCT-3′ (forward) and 5′-TGCCTTTCCTAACTCACACCT-3′ (reverse). An in-frame fusion gene joining exon 1 of IGFBP5 to exon 11 of PDGFRB was validated using the cDNA primers 5′-GAGAAAGCCCTCTCCATGTG-3′ (forward) and 5′-CTTCTGCCAAAGCATGATGA-3′ (reverse). The oligonucleotide primers were designed using the Primer 3 program (bioinfo.ut.ee/primer3-0.4.0/primer3/). One leiomyoma was found to harbor a balanced translocation t (6, 8)(q13; q12) resulting in PLAG1 overexpression (Dataset S5). All leiomyomas were explored for additional genomic alterations affecting PLAG1, and two quadruple-negative leiomyomas were identified to harbor a whole chromosome 8 duplication (Dataset S6). Dataset S1 provides the mutational status of each respective lesion examined in this study.
WGS and SNP Array Preparation.
The WGS samples were prepared, sequenced, and aligned as described previously (4), with the exception of one tumor–normal pair (M21) that was aligned following other procedures as described previously (58). In short, a total of 37 leiomyomas and their corresponding 20 myometrium tissue specimens were prepared and sequenced according to the Illumina paired-end WGS, a total of 26 leiomyomas and their corresponding 25 myometrium tissue specimens were prepared and sequenced according to Complete Genomics paired-end WGS protocol, and a total of 50 leiomyomas and their corresponding 36 myometrium tissue specimens were prepared and analyzed using Illumina HumanOmni2.5-8 BeadChip version 1.1 or 1.2. SNP array sample preparation and hybridization were was performed at the Estonian Genome Center, University of Tartu (Tartu, Estonia) or Illumina (San Diego, CA).
Detection of Somatic Copy Number Alterations Using WGS and SNP Arrays.
Genome-wide SCNAs were detected from complete genomics WGS data as described previously (4). Both the SNP array data and the Illumina WGS data were analyzed for SCNAs using Partek Genomic Suite version 6.5. Raw somatic copy number calls were constructed from Illumina WGS BAM files using VarScan2 with the following parameters: min-coverage; 10; min-coverage-tumor, 10; min-segment-size, 500; max-segment-size, 500. Each sample was then normalized by subtracting against the median of its raw log2ratio calls. The SNP arrays were preprocessed using Illumina Genome Studio version 2011.1 with default parameters. The SNP array dataset included a few technical replicates that were averaged. Raw somatic copy number calls were constructed, log2-transformed, and smoothed using Partek Genomic Suite version 6.5. Both the SNP array and the WGS copy number calls were corrected for GC waves using Partek Genomic Suite version 6.5.
To identify regions of SCNAs, Partek’s segmentation algorithm was performed using a minimum of 500 markers, a signal-to-noise ratio of 0.5, and a segmentation P value of 0.0001. Segments <−0.2 (deletions) and >0.2 (duplications) were reported. All segments were visually inspected (by log2 ratio plots), and segments identified as technical artifacts were manually filtered out. The segmentation algorithm was also performed with a minimum of 100 markers to detect two smaller deletions located upstream of HMGA1 in sample MY5008 m3 and within COL4A5-COL4A6 in sample M21 m1. A final list of segments affecting selected regions is presented in Dataset S6.
Detection of Genomic Rearrangements Using WGS.
Genomic rearrangements were detected from Illumina and Complete Genomics WGS data as described previously (4). In short, genomic rearrangements were detected from Illumina BAM files using BreakDancer version 1.2. Rearrangements were called with stricter parameters in the tumor (−q 65 −r 4) than in the normal myometrium samples (−q 1 −r 1 −y 1). Tumor calls (BreakDancer and Complete Genomics calls) were filtered against a myometrium control set consisting of Illumina BreakDancer calls (n = 25) and Complete Genomics structural variation calls (n = 26). All genomes were examined for breakpoints located within or at a maximum of 400,000 bp upstream/downstream of the canonical transcripts (Ensembl v68) of HMGA2, HMGA1, COL4A5-COL4A6, PLAG1, IGFBP5, and PDGFRB. One leiomyoma (M30 m1) exhibited an HMGA2-RAD51B rearrangement that was clearly detectable through the SCNA analysis, but detectable with BreakDancer only by lowering the parameters to (−q 40 −r 2). Of note, the same leiomyoma (M30 m1) exhibited a rearrangement affecting the COL4A5 locus; however, this rearrangement did not result in the characteristic COL4A5-COL4A6 deletion. All genomes were also examined for rearrangements located within the minimally deleted regions of chromosome 7q22, 22q, and 1p deletions. A final list of genomic rearrangements affecting selected regions is provided in Dataset S5.
Gene Expression Analysis Using Microarrays and RNA Sequencing.
Gene expression data were constructed using Affymetrix GeneChip Human Exon 1.0 ST arrays using remapped Brainarray Custom CDF files (HuEx10stv2_Hs_ENSG, version 16). All arrays were hybridized and assessed for quality by the Biomedicum Functional Genomics Unit using the instructions provided by Affymetrix. Analysis of gene expression data were performed with Partek Genomic Suite version 6.5. The samples were quantile-normalized by the robust multichip average method and adjusted for probe sequence and GC content. The datasets were prepared in five different batches, and Partek’s batch effect removal algorithm was used to remove technical noise. The dataset included a few technical replicates that were averaged. Unsupervised hierarchical clustering analysis (cosine correlation) was performed using the 1% most variable genes (n = 372), as defined by the coefficient of variation calculated across all tumor samples.
A two-way ANOVA (paired t test) was constructed to identify genes that were differentially expressed in all leiomyomas compared with the corresponding myometrium samples. A one-way ANOVA was constructed to identify genes that were differentially expressed between each leiomyoma subtype (HMGA2, MED12, FH, and COL4A5-COL4A6) and the myometrium samples. FDR control (Benjamini and Hochberg method) was used to correct for multiple testing. Genes with an FDR <0.05 and a twofold change were considered significant. Pathway enrichment analysis was carried out with differentially expressed genes using Qiagen’s IPA software.
To identify the most uniquely expressed genes for each leiomyoma subtype, a two-way paired ANOVA was constructed that compared each subtype against the rest of the leiomyoma and myometrium samples. These genes have a subtype-specific expression level that differs from both the other leiomyoma and myometrium samples. Exon-level analysis of gene expression data were performed with default parameters using Affymetrix-provided annotations (v35 and hg19).
To identify the genes most significantly down-regulated by chromosome 7q22, 22q, and 1p deletions, a two-way ANOVA (paired) was constructed that compared leiomyomas harboring these aberrations against the rest of the leiomyoma and myometrium samples. FDR control (Benjamini and Hochberg method) was used to correct for multiple testing.
RNA sequencing was performed to validate up-regulation of the noncoding transcript of RAD51B in two leiomyomas (MY18 m1 and MY23 m1) of the MED12 subtype. RNA-seq libraries were prepared from rRNA-depleted (RiboMinus Transcriptome Isolation Kit; Life Technologies) samples using the Illumina TruSeq RNA Sample Preparation Kit A as instructed by the manufacturer. The quality of the data were assessed using FastQC version 0.10. The RNA sequencing data were mapped to the human reference genome GRCh37 with TopHat version 1.4.1 (59).
Discussion
Recent high-throughput sequencing studies have underlined the genetic heterogeneity of leiomyomas (3, 4), suggesting the existence of molecularly distinct subtypes of leiomyomas. In this study, we identified global expression signatures associated with the mutation status of HMGA2, MED12, FH, and COL4A5-COL4A6, supporting the existence of molecularly distinct leiomyoma subtypes. In contrast, deletions of 7q22, 22q, and 1p frequently co-occurred with other genetic changes and had no major influence on the clustering, suggesting that these changes are involved in tumor progression rather than initiation. Leiomyomas with HMGA1 or HMGA2 alterations displayed similar global expression signatures, supporting the idea that these structurally and evolutionarily related transcription factors have similar functions in tumorigenesis (32). The majority of quadruple-negative leiomyomas clustered into several unique branches, indicating the presence of multiple rare and possibly novel subtypes.
Several recent studies have examined a potential role for Wnt/β-catenin signaling in the development of leiomyomas (7, 19, 33–35). Although our work confirms an aberrant expression of genes related to Wnt/β-catenin signaling, the pathway was unexpectedly predicted to be inhibited. Furthermore, we identified the Wnt pathway antagonists WIF1 and SFRP1 (21) as distinctly up-regulated in leiomyomas of the HMGA2 and MED12 subtypes, respectively. Interestingly, WIF1 is located closely upstream of HMGA2 and transcribed from the opposite strand. WIF1 also is a recurrent translocation partner of HMGA2 in pleomorphic adenomas of the salivary gland (36).
Previous studies have hypothesized that PRL may act as a mitogenic autocrine/paracrine growth factor in human tumorigenesis (37). We identified prolactin signaling as one of the most significantly activated pathways in the complete set of leiomyomas. Furthermore, PRL itself was one of the most highly expressed genes. Interestingly, transgenic mice overexpressing HMGA2 have shown to develop pituitary adenomas secreting prolactin (38), and we detected a particularly high expression of PRL in leiomyomas of the HMGA2 subtype.
The release of prolactin has been shown to be regulated by the prolactin-releasing peptide receptor (PrRPR) (39). We identified a high expression of PRLHR, the gene that encodes for this receptor in leiomyomas of the MED12 subtype. A recent study showed that up-regulation of PrRPR stimulates the proliferation of cultured primary human leiomyoma cells, and that transgenic mice overexpressing PRLHR develop myometrial hyperplasia with excessive extracellular matrix deposition (40).
We identified PLAG1 as one the most uniquely up-regulated genes in leiomyomas with HMGA2 or HMGA1 aberrations. Furthermore, we identified genetic PLAG1 alterations in three leiomyomas, all of which exhibited expression signatures as seen in leiomyomas with HMGA2 or HMGA1 alterations. PLAG1 encodes for a transcription factor whose ectopic expression can trigger the development of several benign mesenchymal tumors (41). Indeed, the overexpression of PLAG1 is typically triggered by chromosomal translocations or, in rarer cases, by amplifications (42). PLAG1 and HMGA2 translocations are both frequent and mutually exclusive in pleomorphic adenomas of the salivary gland (43). RAD51B is the preferential translocation partner of HMGA2 in leiomyomas, and PLAG1 translocations also have been shown to involve the RAD51B loci in lipoblastomas (44). Taken together, these findings indicate that leiomyomas also harbor genetic PLAG1 alterations, and suggest that HMGA2 and HMGA1 promote tumorigenesis through the activation of PLAG1.
Compatible with previous expression profiling studies (14), our pathway analysis revealed a significant dysregulation of IGF1 signaling in leiomyomas. After HMGA2 itself, our statistical analysis identified IGF2BP2 as the second-most uniquely expressed gene in leiomyomas of the HMGA2 subtype. Previous studies have shown that HMGA2 activates the expression of IGF2BP2 by binding to an AT-rich regulatory region within its first intron (22). IGF2BP2 encodes for a protein involved in promoting IGF2 mRNA translation (45). Interestingly, several previous studies have demonstrated that PLAG1 regulates the expression of IGF2 by binding to its P3 promoter (23–25). In support of this, we detected up-regulation of IGF2 in the majority of leiomyomas with an HMGA2, HMGA1, or PLAG1 alteration. IGF2 encodes for insulin-like growth factor 2 and exerts its growth-promoting effect by binding to the IGF1 receptor.
We identified PAPPA2 and ADAM12 as two highly uniquely overexpressed genes in leiomyomas of the HMGA2 and MED12 subtypes, respectively. Both of these genes are expressed at high levels during early placental development and encode for specific proteases of IGFBP-5 (26, 27). Previous studies have shown that IGFBP-5 inhibits IGF1-induced proliferation and migration of smooth muscle cells (46). We identified one quadruple-negative leiomyoma as harboring a fusion gene involving IGFBP5 and PDGFRB. Although fusions involving PDGFRB are known to drive hematopoietic cancers (47), the disruption of IGFBP5 may further enhance leiomyoma development. The exact role of IGFBP-5 in leiomyoma development remains to be resolved, given that IGFBP-5 has been found to both promote and inhibit cancer development (48).
We identified IRS4, a gene located adjacent to COL4A5, as the most uniquely expressed gene in leiomyomas of the COL4A5-COL4A6 subtype. IRS4 encodes for the insulin receptor substrate 4, which has been shown to enhance insulin-like growth factor 1–induced cell proliferation (49). Taken together, these observations support a central role for IGF1 signaling in leiomyomas of the HMGA2, MED12, and COL4A5-COL4A6 subtypes.
The mechanism of tumorigenesis caused by FH mutations has remained unclear. The most extensively studied hypothesis is activation of the hypoxia pathway (50). Biallelic loss of FH results is accumulation of intracellular fumarate, which in turn may inhibit the degradation of hypoxia-inducible factor 1-alpha (HIF1α), leading to pseudohypoxia through aberrant accumulation of this key protein. More recently, two independent research groups demonstrated that KEAP1, a negative regulator of the oncogenic transcription factor NRF2, becomes succinated by high levels of fumarate, leading to accumulation and activation of NRF2 (30, 51). Activation of NRF2 has recently been identified as a common feature of many cancers (52). In this study, we found that the NRF2 signaling pathway was the single most significantly dysregulated pathway in leiomyomas of the FH subtype, whereas the HIF1α signaling pathway was not significantly altered. We detected AKR1B10, a known target of NRF2 (29), as a highly promising biomarker for FH deficiency. NRF2 activation has previously been shown to redirect glucose and glutamine into anabolic pathways, including the pentose phosphate pathway (31). In support of this, we identified the pentose phosphate pathway as the only other statistically significant pathway.
We previously reported RAD51B to be specifically up-regulated in leiomyomas with MED12 mutations (4). In this study, we discovered that this up-regulation corresponds to a (long) non–protein-coding transcript of RAD51B. Remarkably, RAD51B is also the most common translocation partner of HMGA2 in leiomyomas (4, 53). It is tempting to speculate that this noncoding transcript might have an unresolved tumor-promoting role.
Leiomyomas frequently harbor recurrent deletions affecting 7q22, 22q, and 1p, suggesting that these regions contain tumor suppressor genes (8–11). High-throughput sequencing studies have rarely detected second hit mutations within these regions, however (3, 4, 13), suggesting that the target genes may act in a haploinsufficient manner. Furthermore, these changes are often very complex, consisting of inversions, translocations, and deletions in various regions (4), suggesting that multiple genes are targeted simultaneously. In an effort to identify putative target genes, we explored the transcriptional consequences of genes located within these deletions.
We identified CUX1 as the third-most significantly down-regulated gene of 7q22 deletions. CUX1 is located within the minimally deleted region and has been shown to be disrupted by chromosomal rearrangements (4, 54); however, no point mutations have been found, and some 7q22 deletions do not span CUX1 (55). Only one of our samples harbored a biallelic loss of CUX1, suggesting that CUX1 is a haploinsufficent tumor suppressor. Indeed, CUX1 was recently shown to have such a role in acute myeloid leukemia (56).
This study included five leiomyomas previously detected to harbor truncating DEPDC5 point mutations, indicating that DEPDC5 is a target gene on 22q (4). Compatible with this notion, our expression analysis identified DEPDC5 as the third-most significantly down-regulated gene of 22q deletions. Interestingly, we identified another commonly deleted region on chromosome 22q. One leiomyoma harbored an additional chromosomal rearrangement within this region, resulting in biallelic loss of the tumor suppressor SMARCB1. SMARCB1 is of special interest because a germline mutation in SMARCB1, typically causing schwannomatosis, was recently associated with the development of leiomyomas as well (57).
Deletions of 1p have been associated with distinct histopathological features and possible malignant progression of leiomyomas (11, 16). Interestingly, we identified NPHP4 as the most commonly deleted gene on chromosome 1p. NPHP4 has previously been highlighted as a putative target gene in leiomyomas, owing to recurrent translocation breakpoints located upstream of the NPHP4 locus (10); however, we did not detect a significant down-regulation of NPHP4 in leiomyomas with 1p deletions.
Conclusions
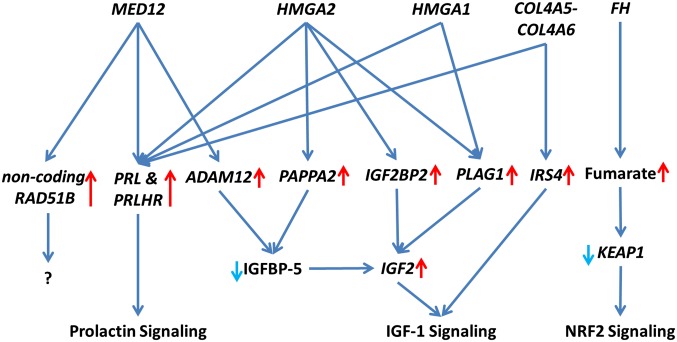
It is well known that uterine leiomyomas display significant heterogeneity in terms of symptoms, histopathology, therapeutic requirements, and genetic changes (2). The evidence presented in this study strongly suggests that specific driver mutations are the major determinants of expression changes in leiomyomas. The variability and inconsistencies frequently seen among samples and studies may be largely explained by different genetic factors driving the lesions. Here we highlight subtype-specific expression changes in key driver pathways, including Wnt/β-catenin, prolactin, IGF1, and NRF2 signaling (Fig. 3). Transcriptional differences in key driver genes and pathways also may explain the frequently seen differences in clinicopathological outcomes. The evidence presented in this study highlight the need for molecular stratification in uterine leiomyoma research, and possibly in clinical practice. This study offers a set of candidate biomarkers that will facilitate the classification of uterine leiomyomas in both contexts.
Fig. 3.
Schematic of highlighted driver pathways in leiomyoma development and growth. Leiomyomas display subtype-specific differences in key driver pathways, including Prolactin, IGF1, and NRF2 signaling.
Materials and Methods
Detailed descriptions of the materials and methods used in this study are provided in SI Materials and Methods. The research was approved by the Ethics Review Board of Helsinki University Hospital. A total of 94 leiomyomas and 60 corresponding myometrium tissue specimens were investigated (Dataset S1). All tissue specimens were collected during hysterectomies and stored as fresh-frozen. The samples were derived from five tissue collections, one consisting of anonymous patients and the other four of patients who signed an informed consent before entering the study.
All leiomyomas were screened for MED12 exon 1 and 2 mutations using Sanger sequencing with primers as reported previously (3). All specimens were screened for rearrangements and deletions affecting HMGA2, HMGA1, and COL4A5-COL4A6 using WGS and/or SNP arrays. All specimens were also screened for 7q22, 22q, and 1p deletions, as well as for rearrangements located within the minimally deleted regions of these. Dataset S1 presents the mutational status of each lesion examined in this study.
WGS data were available for 63 leiomyomas and 31 corresponding myometrium tissue specimens. Genomic DNA libraries were prepared and sequenced according to Illumina and Complete Genomics paired-end sequencing service protocols. A total of 50 leiomyomas and 36 corresponding myometrium tissue specimens were prepared and analyzed using Illumina HumanOmni2.5-8 BeadChips version 1.1 or 1.2. Genome-wide somatic copy number alterations (SCNAs) were detected from Complete Genomics WGS as described previously (4). Both the SNP array data and the Illumina WGS data were analyzed for SCNAs using Partek Genomics Suite version 6.5. Genomic rearrangements were detected from Illumina and Complete Genomics WGS data as described previously (4). In short, genomic rearrangements were detected from Illumina BAM files using BreakDancer version 1.2.
Gene expression data were constructed using Affymetrix GeneChip Human Exon 1.0 ST arrays. Differential expression analyses were performed with Partek Genomics Suite version 6.5. Unsupervised hierarchical clustering analysis (cosine correlation) was performed using 1% most variable genes (n = 372), defined by the coefficient of variation calculated across all tumor samples. Pathway enrichment analysis was carried out with differentially expressed genes using Qiagen’s IPA software. False discovery rate (FDR) control (Benjamini and Hochberg method) was used to correct for multiple testing. RNA sequencing libraries were prepared from rRNA-depleted (RiboMinus Transcriptome Isolation Kit; Life Technologies) samples using the Illumina TruSeq RNA Sample Preparation Kit A in accordance with the manufacturer’s instructions.
Supplementary Material
Acknowledgments
We thank S. Nieminen, I.-L. Svedberg, I. Vuoristo, A. Ollikainen, H. Metsola, and P. Ikonen for their excellent technical assistance; the staff of the Department of Pathology, Helsinki University Hospital for their assistance with tissue acquisition; and the Institute for Molecular Medicine Finland, the Biomedicum Functional Genomics Unit, and the Estonian Genome Center, University of Tartu for their services. We also acknowledge the computational resources provided by the ELIXIR node hosted at the CSC-IT Center for Science, funded by the Academy of Finland (Grants 271642 and 263164), the CSC, and the Ministry of Education and Culture of Finland. This work was supported by grants from the Academy of Finland Center of Excellence (Finnish Center of Excellence in Cancer Genetics Research Grants 250345, 260370, and 265124), Helsinki University Hospital research funds, the Cancer Society of Finland, the Maud Kuistila Foundation, the Emil Aaltonen Foundation, the Biomedicum Helsinki Foundation, the Orion–Farmos Research Foundation, a University of Helsinki postdoctoral grant, the Sigrid Jusélius Foundation, and the Ida Montin Foundation.
Footnotes
The authors declare no conflict of interest.
This article is a PNAS Direct Submission.
This article contains supporting information online at www.pnas.org/lookup/suppl/doi:10.1073/pnas.1518752113/-/DCSupplemental.
References
- 1.Rice KE, Secrist JR, Woodrow EL, Hallock LM, Neal JL. Etiology, diagnosis, and management of uterine leiomyomas. J Midwifery Womens Health. 2012;57(3):241–247. doi: 10.1111/j.1542-2011.2012.00176.x. [DOI] [PubMed] [Google Scholar]
- 2.Zhao D, Rogers PAW. Is fibroid heterogeneity a significant issue for clinicians and researchers? Reprod Biomed Online. 2013;27(1):64–74. doi: 10.1016/j.rbmo.2013.04.001. [DOI] [PubMed] [Google Scholar]
- 3.Mäkinen N, et al. MED12, the mediator complex subunit 12 gene, is mutated at high frequency in uterine leiomyomas. Science. 2011;334(6053):252–255. doi: 10.1126/science.1208930. [DOI] [PubMed] [Google Scholar]
- 4.Mehine M, et al. Characterization of uterine leiomyomas by whole-genome sequencing. N Engl J Med. 2013;369(1):43–53. doi: 10.1056/NEJMoa1302736. [DOI] [PubMed] [Google Scholar]
- 5.Mehine M, Mäkinen N, Heinonen HR, Aaltonen LA, Vahteristo P. Genomics of uterine leiomyomas: Insights from high-throughput sequencing. Fertil Steril. 2014;102(3):621–629. doi: 10.1016/j.fertnstert.2014.06.050. [DOI] [PubMed] [Google Scholar]
- 6.Nezhad MH, et al. 6p21 rearrangements in uterine leiomyomas targeting HMGA1. Cancer Genet Cytogenet. 2010;203(2):247–252. doi: 10.1016/j.cancergencyto.2010.08.005. [DOI] [PubMed] [Google Scholar]
- 7.Markowski DN, et al. MED12 mutations in uterine fibroids: Their relationship to cytogenetic subgroups. Int J Cancer. 2012;131(7):1528–1536. doi: 10.1002/ijc.27424. [DOI] [PubMed] [Google Scholar]
- 8.Pandis N, et al. Chromosome analysis of 96 uterine leiomyomas. Cancer Genet Cytogenet. 1991;55(1):11–18. doi: 10.1016/0165-4608(91)90229-n. [DOI] [PubMed] [Google Scholar]
- 9.Vanharanta S, et al. 7q deletion mapping and expression profiling in uterine fibroids. Oncogene. 2005;24(43):6545–6554. doi: 10.1038/sj.onc.1208784. [DOI] [PubMed] [Google Scholar]
- 10.van Rijk A, et al. Characterization of a recurrent t(1;2)(p36;p24) in human uterine leiomyoma. Cancer Genet Cytogenet. 2009;193(1):54–62. doi: 10.1016/j.cancergencyto.2009.03.011. [DOI] [PubMed] [Google Scholar]
- 11.Hodge JC, Pearce KE, Clayton AC, Taran FA, Stewart EA. Uterine cellular leiomyomata with chromosome 1p deletions represent a distinct entity. Am J Obstet Gynecol. 2014;210(6):572.e1–572.e7. doi: 10.1016/j.ajog.2014.01.011. [DOI] [PMC free article] [PubMed] [Google Scholar]
- 12.Xing YP, Powell WL, Morton CC. The del(7q) subgroup in uterine leiomyomata: genetic and biologic characteristics: Further evidence for the secondary nature of cytogenetic abnormalities in the pathobiology of uterine leiomyomata. Cancer Genet Cytogenet. 1997;98(1):69–74. doi: 10.1016/s0165-4608(96)00406-2. [DOI] [PubMed] [Google Scholar]
- 13.Mehine M, et al. Clonally related uterine leiomyomas are common and display branched tumor evolution. Hum Mol Genet. 2015;24(15):4407–4416. doi: 10.1093/hmg/ddv177. [DOI] [PubMed] [Google Scholar]
- 14.Arslan AA, et al. Gene expression studies provide clues to the pathogenesis of uterine leiomyoma: New evidence and a systematic review. Hum Reprod. 2005;20(4):852–863. doi: 10.1093/humrep/deh698. [DOI] [PubMed] [Google Scholar]
- 15.Vanharanta S, et al. Distinct expression profile in fumarate-hydratase–deficient uterine fibroids. Hum Mol Genet. 2006;15(1):97–103. doi: 10.1093/hmg/ddi431. [DOI] [PubMed] [Google Scholar]
- 16.Christacos NC, Quade BJ, Dal Cin P, Morton CC. Uterine leiomyomata with deletions of Ip represent a distinct cytogenetic subgroup associated with unusual histologic features. Genes Chromosomes Cancer. 2006;45(3):304–312. doi: 10.1002/gcc.20291. [DOI] [PubMed] [Google Scholar]
- 17.Leppert PC, Catherino WH, Segars JH. A new hypothesis about the origin of uterine fibroids based on gene expression profiling with microarrays. Am J Obstet Gynecol. 2006;195(2):415–420. doi: 10.1016/j.ajog.2005.12.059. [DOI] [PMC free article] [PubMed] [Google Scholar]
- 18.Crabtree JS, et al. Comparison of human and rat uterine leiomyomata: Identification of a dysregulated mammalian target of rapamycin pathway. Cancer Res. 2009;69(15):6171–6178. doi: 10.1158/0008-5472.CAN-08-4471. [DOI] [PubMed] [Google Scholar]
- 19.Zavadil J, et al. Profiling and functional analyses of microRNAs and their target gene products in human uterine leiomyomas. PLoS One. 2010;5(8):e12362. doi: 10.1371/journal.pone.0012362. [DOI] [PMC free article] [PubMed] [Google Scholar]
- 20.Hodge JC, et al. Expression profiling of uterine leiomyomata cytogenetic subgroups reveals distinct signatures in matched myometrium: Transcriptional profiling of the t(12;14) and evidence in support of predisposing genetic heterogeneity. Hum Mol Genet. 2012;21(10):2312–2329. doi: 10.1093/hmg/dds051. [DOI] [PMC free article] [PubMed] [Google Scholar]
- 21.Hu J, et al. Blockade of Wnt signaling inhibits angiogenesis and tumor growth in hepatocellular carcinoma. Cancer Res. 2009;69(17):6951–6959. doi: 10.1158/0008-5472.CAN-09-0541. [DOI] [PubMed] [Google Scholar]
- 22.Cleynen I, et al. HMGA2 regulates transcription of the Imp2 gene via an intronic regulatory element in cooperation with nuclear factor-kappaB. Mol Cancer Res. 2007;5(4):363–372. doi: 10.1158/1541-7786.MCR-06-0331. [DOI] [PubMed] [Google Scholar]
- 23.Voz ML, Agten NS, Van de Ven WJ, Kas K. PLAG1, the main translocation target in pleomorphic adenoma of the salivary glands, is a positive regulator of IGF-II. Cancer Res. 2000;60(1):106–113. [PubMed] [Google Scholar]
- 24.Voz ML, et al. Microarray screening for target genes of the proto-oncogene PLAG1. Oncogene. 2004;23(1):179–191. doi: 10.1038/sj.onc.1207013. [DOI] [PubMed] [Google Scholar]
- 25.Akhtar M, et al. Cell type and context-specific function of PLAG1 for IGF2 P3 promoter activity. Int J Oncol. 2012;41(6):1959–1966. doi: 10.3892/ijo.2012.1641. [DOI] [PMC free article] [PubMed] [Google Scholar]
- 26.Yan X, Baxter RC, Firth SM. Involvement of pregnancy-associated plasma protein-A2 in insulin-like growth factor (IGF) binding protein-5 proteolysis during pregnancy: A potential mechanism for increasing IGF bioavailability. J Clin Endocrinol Metab. 2010;95(3):1412–1420. doi: 10.1210/jc.2009-2277. [DOI] [PubMed] [Google Scholar]
- 27.Loechel F, Fox JW, Murphy G, Albrechtsen R, Wewer UM. ADAM 12-S cleaves IGFBP-3 and IGFBP-5 and is inhibited by TIMP-3. Biochem Biophys Res Commun. 2000;278(3):511–515. doi: 10.1006/bbrc.2000.3835. [DOI] [PubMed] [Google Scholar]
- 28.Malhotra D, et al. Global mapping of binding sites for Nrf2 identifies novel targets in cell survival response through ChIP-Seq profiling and network analysis. Nucleic Acids Res. 2010;38(17):5718–5734. doi: 10.1093/nar/gkq212. [DOI] [PMC free article] [PubMed] [Google Scholar]
- 29.Ooi A, et al. An antioxidant response phenotype shared between hereditary and sporadic type 2 papillary renal cell carcinoma. Cancer Cell. 2011;20(4):511–523. doi: 10.1016/j.ccr.2011.08.024. [DOI] [PubMed] [Google Scholar]
- 30.Adam J, et al. Renal cyst formation in Fh1-deficient mice is independent of the Hif/Phd pathway: Roles for fumarate in KEAP1 succination and Nrf2 signaling. Cancer Cell. 2011;20(4):524–537. doi: 10.1016/j.ccr.2011.09.006. [DOI] [PMC free article] [PubMed] [Google Scholar]
- 31.Mitsuishi Y, et al. Nrf2 redirects glucose and glutamine into anabolic pathways in metabolic reprogramming. Cancer Cell. 2012;22(1):66–79. doi: 10.1016/j.ccr.2012.05.016. [DOI] [PubMed] [Google Scholar]
- 32.Cleynen I, Van de Ven WJ. The HMGA proteins: A myriad of functions (Review) Int J Oncol. 2008;32(2):289–305. [PubMed] [Google Scholar]
- 33.Ono M, et al. Inhibition of canonical WNT signaling attenuates human leiomyoma cell growth. Fertil Steril. 2014;101(5):1441–1449. doi: 10.1016/j.fertnstert.2014.01.017. [DOI] [PMC free article] [PubMed] [Google Scholar]
- 34.Ono M, et al. Paracrine activation of WNT/β-catenin pathway in uterine leiomyoma stem cells promotes tumor growth. Proc Natl Acad Sci USA. 2013;110(42):17053–17058. doi: 10.1073/pnas.1313650110. [DOI] [PMC free article] [PubMed] [Google Scholar]
- 35.Pérot G, et al. MED12 alterations in both human benign and malignant uterine soft tissue tumors. PLoS ONE. 2012;7(6):e40015. doi: 10.1371/journal.pone.0040015. [DOI] [PMC free article] [PubMed] [Google Scholar]
- 36.Queimado L, Lopes CS, Reis AM. WIF1, an inhibitor of the Wnt pathway, is rearranged in salivary gland tumors. Genes Chromosomes Cancer. 2007;46(3):215–225. doi: 10.1002/gcc.20402. [DOI] [PubMed] [Google Scholar]
- 37.Ben-Jonathan N, Liby K, McFarland M, Zinger M. Prolactin as an autocrine/paracrine growth factor in human cancer. Trends Endocrinol Metab. 2002;13(6):245–250. doi: 10.1016/s1043-2760(02)00603-3. [DOI] [PubMed] [Google Scholar]
- 38.Fedele M, et al. Overexpression of the HMGA2 gene in transgenic mice leads to the onset of pituitary adenomas. Oncogene. 2002;21(20):3190–3198. doi: 10.1038/sj.onc.1205428. [DOI] [PubMed] [Google Scholar]
- 39.Hinuma S, et al. A prolactin-releasing peptide in the brain. Nature. 1998;393(6682):272–276. doi: 10.1038/30515. [DOI] [PubMed] [Google Scholar]
- 40.Varghese BV, et al. Loss of the repressor REST in uterine fibroids promotes aberrant G protein-coupled receptor 10 expression and activates mammalian target of rapamycin pathway. Proc Natl Acad Sci USA. 2013;110(6):2187–2192. doi: 10.1073/pnas.1215759110. [DOI] [PMC free article] [PubMed] [Google Scholar]
- 41.Van Dyck F, Declercq J, Braem CV, Van de Ven WJ. PLAG1, the prototype of the PLAG gene family: Versatility in tumour development (review) Int J Oncol. 2007;30(4):765–774. [PubMed] [Google Scholar]
- 42.Zatkova A, et al. Amplification and overexpression of the IGF2 regulator PLAG1 in hepatoblastoma. Genes Chromosomes Cancer. 2004;39(2):126–137. doi: 10.1002/gcc.10307. [DOI] [PubMed] [Google Scholar]
- 43.Bahrami A, Perez-Ordonez B, Dalton JD, Weinreb I. An analysis of PLAG1 and HMGA2 rearrangements in salivary duct carcinoma and examination of the role of precursor lesions. Histopathology. 2013;63(2):250–262. doi: 10.1111/his.12152. [DOI] [PubMed] [Google Scholar]
- 44.Deen M, Ebrahim S, Schloff D, Mohamed AN. A novel PLAG1-RAD51L1 gene fusion resulting from a t(8;14)(q12;q24) in a case of lipoblastoma. Cancer Genet. 2013;206(6):233–237. doi: 10.1016/j.cancergen.2013.05.019. [DOI] [PubMed] [Google Scholar]
- 45.Dai N, et al. mTOR phosphorylates IMP2 to promote IGF2 mRNA translation by internal ribosomal entry. Genes Dev. 2011;25(11):1159–1172. doi: 10.1101/gad.2042311. [DOI] [PMC free article] [PubMed] [Google Scholar]
- 46.Parker A, Rees C, Clarke J, Busby WH, Jr, Clemmons DR. Binding of insulin-like growth factor (IGF)-binding protein-5 to smooth-muscle cell extracellular matrix is a major determinant of the cellular response to IGF-I. Mol Biol Cell. 1998;9(9):2383–2392. doi: 10.1091/mbc.9.9.2383. [DOI] [PMC free article] [PubMed] [Google Scholar]
- 47.Savage N, George TI, Gotlib J. Myeloid neoplasms associated with eosinophilia and rearrangement of PDGFRA, PDGFRB, and FGFR1: A review. Int J Lab Hematol. 2013;35(5):491–500. doi: 10.1111/ijlh.12057. [DOI] [PubMed] [Google Scholar]
- 48.Güllü G, Karabulut S, Akkiprik M. Functional roles and clinical values of insulin-like growth factor-binding protein-5 in different types of cancers. Chin J Cancer. 2012;31(6):266–280. doi: 10.5732/cjc.011.10405. [DOI] [PMC free article] [PubMed] [Google Scholar]
- 49.Qu BH, Karas M, Koval A, LeRoith D. Insulin receptor substrate-4 enhances insulin-like growth factor-I–induced cell proliferation. J Biol Chem. 1999;274(44):31179–31184. doi: 10.1074/jbc.274.44.31179. [DOI] [PubMed] [Google Scholar]
- 50.Lehtonen HJ. Hereditary leiomyomatosis and renal cell cancer: Update on clinical and molecular characteristics. Fam Cancer. 2011;10(2):397–411. doi: 10.1007/s10689-011-9428-z. [DOI] [PubMed] [Google Scholar]
- 51.Kinch L, Grishin NV, Brugarolas J. Succination of Keap1 and activation of Nrf2-dependent antioxidant pathways in FH-deficient papillary renal cell carcinoma type 2. Cancer Cell. 2011;20(4):418–420. doi: 10.1016/j.ccr.2011.10.005. [DOI] [PMC free article] [PubMed] [Google Scholar]
- 52.Sporn MB, Liby KT. NRF2 and cancer: The good, the bad and the importance of context. Nat Rev Cancer. 2012;12(8):564–571. doi: 10.1038/nrc3278. [DOI] [PMC free article] [PubMed] [Google Scholar]
- 53.Quade BJ, et al. Fusion transcripts involving HMGA2 are not a common molecular mechanism in uterine leiomyomata with rearrangements in 12q15. Cancer Res. 2003;63(6):1351–1358. [PubMed] [Google Scholar]
- 54.Schoenmakers EFPM, et al. Identification of CUX1 as the recurrent chromosomal band 7q22 target gene in human uterine leiomyoma. Genes Chromosomes Cancer. 2013;52(1):11–23. doi: 10.1002/gcc.22001. [DOI] [PubMed] [Google Scholar]
- 55.Neville PJ, Thomas N, Campbell IG. Loss of heterozygosity at 7q22 and mutation analysis of the CDP gene in human epithelial ovarian tumors. Int J Cancer. 2001;91(3):345–349. doi: 10.1002/1097-0215(200002)9999:9999<::aid-ijc1050>3.0.co;2-1. [DOI] [PubMed] [Google Scholar]
- 56.McNerney ME, et al. CUX1 is a haploinsufficient tumor suppressor gene on chromosome 7 frequently inactivated in acute myeloid leukemia. Blood. 2013;121(6):975–983. doi: 10.1182/blood-2012-04-426965. [DOI] [PMC free article] [PubMed] [Google Scholar]
- 57.Hulsebos TJ, et al. SMARCB1 involvement in the development of leiomyoma in a patient with schwannomatosis. Am J Surg Pathol. 2014;38(3):421–425. doi: 10.1097/PAS.0000000000000110. [DOI] [PubMed] [Google Scholar]
- 58.Katainen R, et al. CTCF/cohesin-binding sites are frequently mutated in cancer. Nat Genet. 2015;47(7):818–821. doi: 10.1038/ng.3335. [DOI] [PubMed] [Google Scholar]
- 59.Trapnell C, Pachter L, Salzberg SL. TopHat: Discovering splice junctions with RNA-Seq. Bioinformatics. 2009;25(9):1105–1111. doi: 10.1093/bioinformatics/btp120. [DOI] [PMC free article] [PubMed] [Google Scholar]
Associated Data
This section collects any data citations, data availability statements, or supplementary materials included in this article.


