

Abstract
The Keap1/Nrf2 pathway, known to regulate the expression of a series of cytoprotective and antioxidant genes, has been studied in the context of obesity and type 2 diabetes; diseases that are characterized by chronic oxidative stress. There is increasing evidence, however, that the transcription factor Nrf2 can crosstalk with pathways not directly related to cytoprotection. Our present work focuses on the effect of Nrf2 on hepatic gluconeogenesis and lipogenesis, two metabolic processes which are dysregulated in the obese/diabetic state. To this end, a genetic mouse model of Nrf2 pathway activation was used (Keap1-hypo; both Keap1 alleles are hypomorphic) and was exposed to a 3-month high-fat diet along with the relevant control wild-type mice. The Keap1-hypo mice were partially protected from obesity, had lower fasting glucose and insulin levels and developed less liver steatosis compared to the wild-type. Key gluconeogenic and lipogenic enzymes were repressed in the Keap1-hypo livers with concomitant activated Ampk signaling. Primary Keap1-hypo hepatocyte cultures also show increased Ampk signaling and repressed glucose production. In conclusion, increased Keap1/Nrf2 signaling in the liver is accompanied by repressed gluconeogenesis and lipogenesis that can, at least partially, explain the ameliorated diabetic phenotype in the Keap1-hypo mice.
Keywords: Keap1, Nrf2, Ampk, diabetes, gluconeogenesis, lipogenesis
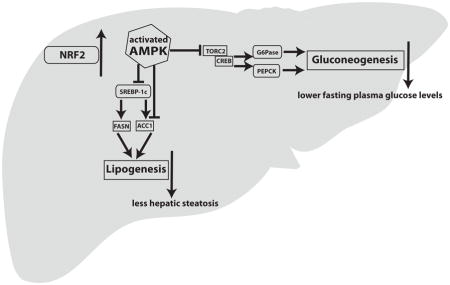
Graphical abstract
1. Introduction
Type 2 diabetes (T2D) or fasting hyperglycemia are features of metabolic syndrome, a public health problem in westernized societies [1]. Metabolic syndrome has also been associated with obesity-related disorders such as fatty liver disease [2]. Peripheral insulin resistance, relative impairment in insulin secretion and dysregulation of endogenous glucose production (hepatic gluconeogenesis) can also contribute to hyperglycemia [3, 4]. Drugs that target gluconeogenesis (metformin) [5] are being used as a first-line therapy to lower circulating glucose levels in T2D. Gluconeogenesis, the process of glucose synthesis from non-carbohydrate substrates, mainly occurs in the liver and to a much lesser degree in the kidney and small intestine. Hepatic lipogenesis (de novo synthesis of fatty acids) is another metabolic pathway which is dysregulated in metabolic syndrome and T2D, and can also contribute to accumulation of fat in the liver that can accompany these disorders [6]. Thus, the regulation of gluconeogenesis and lipogenesis is important not only to understand the pathophysiology of these metabolic diseases but also to identify potential targets for therapeutic interventions.
In this context, our present work describes the role of the Keap1/Nrf2 pathway in hepatic gluconeogenesis and lipogenesis. NFE2-related factor 2 (Nrf2) is a basic leucine zipper transcription factor within the Cap n’ Collar family and is a central mediator of the adaptive response to endogenous and exogenous electrophilic and oxidative stresses [7]. Under non-stressed conditions, Nrf2 is bound by kelch-like ECH-associated protein 1 (Keap1) within the cytoplasm, where Keap1 facilitates the proteasomal degradation of Nrf2 via association with the Cul3/Rbx1 E3 ligase system [8]. Upon exposure to stress or to chemical inducers (triterpenoids, dithiolethiones and isothiocyanates), reactive cysteines of Keap1 are modified [9] causing disruption of the Keap1/Nrf2 complex, allowing for Nrf2 to avoid proteasomal degradation, leading to its accumulation and translocation to the nucleus where it binds to Antioxidant Response Element (ARE) sequences in the regulatory regions of target genes, inducing their transcription. Examples of classic Nrf2 target genes include glutathione S-transferases that regulate detoxication reactions, NADPH quinone oxidoreductase 1 (Nqo1) which plays roles in antioxidative response and proteasome subunits which affect proteasome function [10].
The first studies on the Keap1/Nrf2 pathway in the field of obesity and type 2 diabetes were mainly based on the presumption that activation of this cytoprotective/antioxidant pathway could protect against the detrimental effects of increased oxidative stress present in several tissues in these diseases [11]. This hypothesis was verified in some instances including the case of the pancreas, where activation of the Nrf2 pathway clearly protects against oxidative and nitrosative stress [12]. There is also evidence that Nrf2 can crosstalk with metabolic pathways, increasing the repertoire of its target genes (reviewed in [13], [14]). Examples of such genes are the Peroxisome proliferator-activated receptor gamma (Pparγ) [15], CCAAT/enhancer-binding protein beta (C/ebpβ) [16] and Fibroblast growth factor 21 (Fgf21) [17, 18].
Previous studies using mouse models have shown that activation of the Keap1/Nrf2 pathway through genetic [19] or pharmacologic means (triterpenoids CDDO-Im, CDDO-Me) [20] [21], at least partially, protects mice from diet-induced obesity and T2D leading to a more glucose tolerant phenotype and amelioration of hepatic steatosis. Other studies have suggested that Nrf2 pathway activation is accompanied by activation of the AMP-activated protein kinase (Ampk) pathway in C.elegans and murine lung tissue [22] as well as in mouse liver [23]. Ampk is well characterized as an energy sensor that maintains energy homeostasis and regulates several cellular metabolic pathways including gluconeogenesis and lipogenesis [24]. Our present study employs a genetic mouse model of Nrf2 pathway activation on high-fat diet, describes in depth the phenotype of these mice and focuses on the role of Nrf2 in the hepatic gluconeogenic and lipogenic pathways and their effect on the resulting phenotype of lower fasting glucose levels and ameliorated fatty liver disease.
2. Materials and Methods
2.1 Mice
C57BL6J wild type (WT) mice were purchased from Jackson Laboratories (Bar Harbor, ME). Hypomorphic Keap1 allele mice (Keap1-hypo) were developed previously [25]. The Keap1-hypo mice were developed as Keap1flox/flox mice but found to have lower expression of Keap1 (hypomorphic Keap1 alleles) [26]. The Keap1-hypo mice were utilized as Keap1 knockout mice die before weaning (postnatal day 21) due to malnutrition resulting from hyperkeratosis in the esophagus and the forestomach [27]. Hence, the Keap1-hypo mice provide a functional model of intermediate genetic activation of the Nrf2 pathway. Supplementary Figure 1A shows that Nqo1, a prototypical target gene of Nrf2 showed higher expression in the livers of Keap1-hypo mice than in the WT and Supplementary Figure 1B depicts that the nuclear levels of Nrf2 are markedly increased in the livers of the Keap1-hypo mice, confirming that these mice are a valid model of Keap1/Nrf2 pathway activation.
Male WT and Keap1-hypo mice (2 months old) were fed ad libitum a standard diet (StD) (10 kcal % fat) or a high-fat diet (HFD) (60 kcal % fat) for 90 days. The diets were purchased γ-irradiated from Research Diets (New Brunswick, NJ) (D-12450B; StD, D-12492; HFD). Mice were housed in light-and humidity-controlled rooms with a 12h light/dark cycle and had free access to water. The experiment was repeated twice. The first time 9–10 mice were included per genotype per diet type and the subjects were used for mRNA and protein analysis. The second time 5 mice were included per diet type per genotype and the subjects were used for energy expenditure, insulin sensitivity and in vivo insulin signaling analysis. Animal experiments were approved by the relevant committees of The Johns Hopkins University and The University of Pittsburgh.
2.2 Body composition analysis and indirect calorimetry
Body composition analysis was performed with qNMR utilizing an EchoMRI-100 (Echo Medical System, Houston TX) measuring, in triplicate, in vivo total body fat, lean mass, free water and total body water. Indirect calorimetry studies were performed using an open-flow indirect calorimeter (Oxymax Equal Flow System; Columbus Instruments, Columbus, OH) at the Center for Metabolism and Obesity Research (Johns Hopkins University) on WT and Keap1-hypo mice after having been exposed for 50 days to HFD as previously described [20].
2.3 Evaluation of insulin sensitivity
Blood glucose was measured using a Precision Xtra glucose meter (Abbott, Chicago, IL) in blood collected from the tail of the mouse. Glucose tolerance was assessed by intraperitoneal injection of a single dose of D-glucose (1 g/kg) after 16 h overnight fasting with free access to water. Insulin tolerance was assessed by injecting mice intraperitoneally with 0.75 units/kg insulin (Humalog, Eli Lilly, Indianapolis, IN) after 4h fasting with free access to water. In vivo insulin signaling was assessed by injecting mice intraportally with 10 units/kg insulin (Humalog) after having been exposed for 90 days to HFD as described previously [28]. Briefly, mice were fasted for 16h overnight with free access to water and the next morning under isoflurane anesthesia the abdominal cavity was opened and the portal vein exposed. A surgical biopsy of the liver and of the left gastrocnemius muscle was obtained and was immediately frozen in liquid nitrogen. Surgical hemostasis was performed and 10 IU/kg body weight of insulin was injected in the portal vein using a Hamilton syringe. 5 minutes later, another biopsy of the liver and of the right gastrocnemius muscle was obtained, flash frozen in liquid nitrogen and the mouse euthanized.
2.4 Measurements of metabolites
Measurements were performed following the manufacturer’s instructions for each assay. Enzyme-linked immunosorbent assay was used for insulin (Mercodia, Uppsala, Sweden). Triglycerides, glycerol, cholesterol, β-hydroxybutyrate (β-HB) and glucose were measured using assay kits from Cayman Chemical (Ann Arbor, MI). Nonesterified fatty acids were measured using the NEFA-HR kit (Wako Chemicals, Osaka, Japan).
2.5 Primary hepatocyte culture and in vitro gluconeogenesis
WT and Keap1-hypo male mice were perfused through the heart with 5 mM EGTA in HBSS (Life Technologies) followed by 5 mM CaCl2/0.05% collagenase A (Roche, Indianapolis, IN) in HBSS. Hepatocytes were then plated in collagen-treated 6-well plates at a density of 600,000 cells/well in DMEM supplemented with 10% fetal bovine serum (FBS), penicillin/streptomycin (p/s) and were allowed to settle for 3h at 37°C in a 5% CO2 incubator. They were subsequently washed 3 times with PBS 1X and the medium was changed to phenol-red-and glucose-free DMEM supplemented with 10 mM Hepes pH 7.35, p/s, 20 mM sodium lactate and 2 mM sodium pyruvate (basal state). In half of the wells 1 μM dexamethasone and 300 μM 8-Br-cAMP were added (induced state). After 200 minutes the medium was collected, centrifuged and saved at −80°C for glucose measurement.
2.6 Protein preparation and immunoblot analyses
Immunoblot analyses were performed as described previously [29] using primary and secondary antibodies that are described in detail in Table 1.
Table 1.
Antibodies used in western blot.
| Antibody | Catalog number | Manufacturer |
|---|---|---|
| Anti-p-Akt-Ser473 | 4060 | Cell Signaling |
| Anti-p-Akt-Thr308 | 2965 | Cell Signaling |
| Anti-pan-Akt | 4691 | Cell Signaling |
| Anti-p-Ampkα-Thr172 | 2535 | Cell Signaling |
| Anti-Ampkα | 2603 | Cell Signaling |
| Anti-p-Ampkβ1-Ser108 | 4181 | Cell Signaling |
| Anti-Ampkβ1/2 | 4150 | Cell Signaling |
| Anti-p-Torc2-Ser171 | BS-3415R | Bioss |
| Anti-p-Acc-Ser79 | 3661 | Cell Signaling |
| Anti-Acc | 3676 | Cell Signaling |
| Anti-Gapdh | NB300-221 | Novus Biologicals |
| Anti-Nqo1 | Ab80588 | Abcam |
| Anti-Nrf2 | N/A | Ken Itoh, Hirosaki University |
| Anti-Pepck | sc-74823 | Santa Cruz Biotechnology |
| Anti-Fasn | sc-48357 | Santa Cruz Biotechnology |
2.7 Isolation and purification of total RNA and qRT-PCR
Total RNA was prepared from mouse livers using Trizol (Life Technologies) followed by DNAse digestion and application to the RNeasy kit (Qiagen, Valencia, CA). RNA quality and quantity was evaluated by electrophoresis and spectrophotometry at 260/280 nm prior to reverse transcriptase reaction. cDNA was synthesized with the qScript system (Quanta BioSciences, Gaithersburg, MD). Real-time PCR was performed on an iCycler-MyIQ (Biorad, Hercules, CA) using iQ SYBR green supermix (Biorad) in tetraplicate 20 μl reactions. The PCR efficiency was determined from standard curves and the Pfaffl method was used for calculations of fold changes [30]. Melt curves and agarose gel electrophoresis was utilized to ensure the specificity of the amplified product. Reactions were normalized to both glyceraldehyde-3-phosphate dehydrogenase (Gapdh) and TATA binding protein (Tbp). Primer sequences were obtained from Primer Bank [31] and are shown in Table 2.
Table 2.
Primers used for qRT-PCR.
| Gene | Forward | Reverse |
|---|---|---|
| Pepck | CTGCATAACGGTCTGGACTTC | CAGCAACTGCCCGTACTCC |
| G6pase | CGACTCGCTATCTCCAAGTGA | GTTGAACCAGTCTCCGACCA |
| Fasn | GGAGGTGGTGATAGCCGGTAT | TGGGTAATCCATAGAGCCCAG |
| Gapdh | AGGTCGGTGTGAACGGATTTG | TGTAGACCATGTAGTTGAGGTCA |
| Tbp | AAGAGAGCCACGGACAACTG | TACTGAACTGCTGGTGGGTC |
2.8 Statistical analysis
Data are expressed as mean ± SEM. The number of subjects used in each experiment is described in the relevant figure legends. Student t-test or one-way ANOVA followed by Tukey test were performed using GraphPad Prism 5 (GraphPad Software, La Jolla, CA). ANCOVA was performed using the SPSS 21.0 (IBM, Armonk, NY). P<0.05 was considered significant.
3. Results
3.1 Keap1-hypo mice were partially protected against HFD-induced obesity with lower fasting glucose levels, better glucose tolerance and ameliorated fatty liver disease
Keap1-hypo mice on StD showed no significant difference in weight when compared to WT during the 3-month exposure to the diet (Fig. 1A). However, after HFD exposure the Keap1-hypo mice gained less weight than WT with this difference being statistically significant after about 1 month on HFD (Fig. 1A). After 3 months on HFD the Keap1-hypo mice had significantly lower fasting plasma glucose levels (176.8 ± 8.1 mg/dl) compared to the WT (213.8 ± 10.5 mg/dl) as shown in Fig. 1A and Table 3 and were more glucose tolerant (Fig. 1A). Moreover, the livers of the Keap1-hypo mice accumulated less lipids as demonstrated visually by H&E stained sections (Fig. 1B) and validated by measured hepatic triglyceride levels (Fig. 1C).
Figure 1. Keap1-hypo mice gained less weight, had ameliorated glucose tolerance and developed less hepatic steatosis than the WT after 3 months on HFD.

A. Body weights of WT or Keap1-hypo mice fed either a HFD or a StD are plotted against time. Data show mean ± SEM. n = 9–10 per genotype per diet type. *P<0.05 (WT-HFD vs. Keap1-hypo-HFD).
B. Representative H&E stained liver sections from WT or Keap1-hypo mice fed a StD or a HFD.
C. Hepatic triglycerides (TG) levels normalized to total protein amount. Data show mean ± SEM. n = 9–10 per genotype per diet type. *P<0.05 (WT vs Keap1-hypo).
Table 3.
Plasma metabolic parameters of WT and Keap1-hypo mice fed a StD or HFD for 90 days.
| WT-StD | Keap1-hypo-StD | WT-HFD | Keap1-hypo-HFD | |
|---|---|---|---|---|
|
| ||||
| Cholesterol (mg/dl) | 90.5 ± 3.4 | 82.2 ± 15.6 | 167.7 ± 16.6 | 170.3 ± 12.3 |
| TG (mg/dl) | 48.6 ± 2.8 | 54.0 ± 3.6 | 66.8 ± 5.1 | 99.5 ± 11.0 |
| NEFA (mM) | N/D | N/D | 0.74 ± 0.04 | 0.74 ± 0.13 |
| Glycerol (mg/l) | 21.3 ± 1.6 | 17.2 ± 2.1 | 27.4 ± 6.1 | 41.7 ± 16.4 |
| β-HB (mM) | N/D | N/D | 0.83 ± 0.16 | 0.63 ± 0.14 |
| Glucose (mg/dl) | 95.4 ± 2.5 | 97.0 ± 4.2 | 213.8 ± 10.5 | 176.8 ± 8.1* |
| Insulin (μg/l) | 0.97 ± 0.1 | 0.95 ± 0.1 | 2.9 ± 0.4 | 1.1 ± 0.3* |
Data are mean ± SEM. n=5. Mice were fasted overnight before blood collection.
TG=Triglycerides; NEFA=Non esterified fatty acids; β-HB=beta-hydroxybutyrate;N/D=not done.
P<0.05 compared to WT-HFD.
3.2 Keap1-hypo mice on HFD showed lower expression of key gluconeogenic and lipogenic enzymes in their livers
Based on the lower fasting glucose levels of the Keap1-hypo mice that can potentially be attributed to repressed gluconeogenesis, the mRNA levels of the key gluconeogenic genes phosphoenolpyruvate carboxykinase 1 (Pepck) and glucose-6-phosphatase (G6pase) were assessed by qRT-PCR. Fig. 2A shows the expression of these genes is repressed by about 30% in the Keap1-hypo mice compared to WT on HFD, but no difference can be detected between the two genotypes on StD. The reduced expression of Pepck was also verified at the protein level using western blot (Fig. 2B, 2C). In parallel, as the Keap1-hypo mice show decreased accumulation of lipids in their livers, the expression of Fasn (Fatty acid synthase), a key lipogenic enzyme which catalyzes the synthesis of palmitate from acetyl-CoA and malonyl-CoA, was assessed at the mRNA and protein levels. Fig. 2A shows that Keap1-hypo mice had lower mRNA levels of this enzyme and as depicted in Fig. 2B and 2C the protein levels of Fasn were about 50% lower in the Keap1-hypo mice on HFD. Thus, it is evident that the expression of enzymes that catalyze key reactions in gluconeogenesis and lipogenesis are repressed in the Keap1-hypo mice on HFD.
Figure 2. Keap1-hypo mice show repressed hepatic expression of gluconeogenic and lipogenic enzymes.

A. mRNA levels of Pepck, G6pase and Fasn as assessed by qRT-PCR. Data show mean ± SEM. n = 9–10 per genotype. *P<0.05.
B. Pepck and Fasn expression as assessed by immunoblotting. Coomassie blue staining and Gapdh expression is shown for loading control purposes.
C. Relative quantification of Pepck and Fasn protein levels. Coomassie blue staining intensity was used as loading control. Data show mean ± SEM. n = 5 per genotype. *P<0.05
3.3 In vitro glucose production from primary Keap1-hypo hepatocytes was repressed
To determine whether the repressed expression of key gluconeogenic enzymes in the Keap1-hypo mice influences glucose production from hepatocytes, primary hepatocyte cultures from the Keap1-hypo mice were prepared and in vitro glucose production was measured under basal conditions and after induction of gluconeogenesis by Br-cAMP and dexamethasone. Under basal conditions, glucose production from the WT and the Keap1-hypo hepatocytes appeared to be similar; however, in the induced state, glucose production by the Keap1-hypo hepatocytes was reduced compared to the WT (Fig. 3A). The activation status of the Ampk pathway in hepatocytes was assessed and it was found that both the α and β subunits of Ampk showed increased phosphorylation at Thr172 and Ser108 respectively, denoting increased Ampk activation (Fig. 3B). As the activated Ampk can phosphorylate transducer of regulated Creb activity 2 (Torc2) at Ser171, leading to its increased sequestration in the cytoplasm, inhibiting nuclear entry and the Creb-dependent induction of gluconeogenic genes (Pepck, G6Pase)[32], pTorc2-Ser171 was assessed by western blot and was found to be elevated in the Keap1-hypo hepatocytes (Fig. 3B). All these observations suggest that an activated Ampk pathway in the Keap1-hypo hepatocytes can lead to the repressed glucose production observed in vitro.
Figure 3. Keap1-hypo primary hepatocytes show repressed glucose production and increased Ampk signaling.

A. In vitro gluconeogenesis is repressed in Keap1-hypo primary hepatocytes compared to WT. Glucose production induced by incubation with 1 μM Dexamethasone and 250 μM 8-Br-cAMP is attenuated in the Keap1-hypo primary hepatocytes. Data show mean ± SEM from 4 individual experiments with 6–11 technical replicates in each experiment. *P<0.05 (induced glucose production of WT vs Keap1-hypo primary hepatocytes).
B. Immunoblots of p-Ampkα-Thr172, p-Ampkβ1-Ser108, p-Torc2-Ser171 show that AMPK signaling is activated in primary hepatocytes derived from Keap1-hypo mice compared to WT ones. A representative immunoblot per protein is shown from a total number of n=4 independent experiments.
3.4 Keap1-hypo mice on HFD showed increased hepatic Ampk pathway activation
After 3 months on HFD and an overnight fasting, the Keap1-hypo mice had increased levels of p-Ampkα-Thr172 and p-Ampkβ1-Ser108 compared to the WT (Fig. 4A, 4B). These results are in accordance with the Ampk activation status in the primary Keap1-hypo hepatocytes and with the increased p-Ampkα-Thr172 levels observed in the livers of Keap1-hypo mice on StD (Fig. 4C). The downstream target of Ampk, Torc2 also showed increased phosphorylation at Ser171 that can ultimately have a negative effect on gluconeogenesis. An additional axis of the Ampk pathway that can affect lipogenesis was also examined; acetyl-CoA carboxylase 1 (Acc1), which catalyzes carboxylation of acetyl-CoA to malonyl-CoA, a rate limiting step of fatty acid synthesis and can be inhibited by Ampk by phosphorylation at Ser79. Fig. 4A shows that the total protein levels of Acc1 are reduced in the Keap1-hypo livers leading to a trend towards increased p-Acc1-Ser79/Acc1 ratio (Fig. 4B). These data suggest an activated Ampk pathway in Keap1-hypo livers, potentially leading to repression of gluconeogenic and lipogenic pathways.
Figure 4. Ampk signaling is activated in the Keap1-hypo livers after HFD.

A. Immunoblotting analysis of p-Ampkα-Thr172, total Ampkα, p-Ampkβ1-Ser108, total Ampkβ1 show that Ampk is activated in the Keap1-hypo mice after 90 days on HFD. Downstream targets of Ampk, Torc2 and Acc1 show increased phosphorylation at Ser171 and Ser79 correspondingly. Total Acc1 levels are lower in the Keap1-hypo mice.
B. Relative quantification of p-Ampkα-Thr172, p-Ampkβ1-Ser108, p-Torc2-Ser171, p-Acc1-Ser79 and Acc1. Data show mean ± SEM. n = 5 per genotype. *P<0.05 (WT-HFD vs. Keap1-hypo-HFD).
C. Immunoblotting analysis of p-Ampkα-Thr172 and total Ampkα show that Ampk is activated in the Keap1-hypo mice on StD.
3.5 Keap1-hypo mice tended to have ameliorated insulin signaling in their livers and to show increased energy expenditure
As insulin is known to suppress gluconeogenesis [33], insulin signaling in the livers of the Keap1-hypo mice after HFD was evaluated in vivo by assessing the phosphorylation status of Akt, a downstream target of insulin action. Fig. 5A shows that no difference is found in the phosphorylated levels of Akt at Ser473 between the two genotypes and only a trend (P=0.06) for increased phosphorylation of Akt at Thr308 after stimulation with insulin was revealed. Insulin tolerance tests in mice did not reveal any difference between the two genotypes throughout the 3-month HFD feeding period (Supplementary Figure 2). However, the lower fasting glucose and insulin levels of the Keap1-hypo mice after 3 months on HFD are indicative of enhanced insulin sensitivity (Table 3).
Figure 5. In vivo liver insulin signaling and indirect calorimetry in Keap1-hypo mice.

A. Insulin signaling study. Mice that have been on high-fat diet for 90 days were fasted for 16h overnight and then injected intraportally with 10 units/kg insulin. Liver biopsies were obtained before and five minutes after the insulin injection. Immunoblots show phosphorylation of Akt at Ser473, Thr308 and total Akt in the livers of WT and Keap1-hypo mice before (−) and after (+) intraportal insulin administration. The diagrams show relative protein amount of p-Akt Ser473 and p-Akt Thr308 after normalization to total Akt levels. n = 5 per genotype. *P<0.05 compared to WT-HFD.
B. Raw energy expenditure (EE) values plotted against body weights (BW) or lean body mass (LBM) (as calculated by Echo-MRI) for both WT and Keap1-hypo mice after 50 days on HFD. The diagrams show body weight-normalized and lean body mass-normalized energy expenditure. Data show mean ± SEM. N=5 per genotype. *P<0.05 (WT-HFD vs. Keap1-hypo-HFD).
C. Respiratory exchange ratio (RER) and energy intake (EI) of WT and Keap1-hypo mice after 50 days on HFD.
To further evaluate the phenotype of the Keap1-hypo mice, after 50 days of HFD feeding Keap1-hypo mice and the WT controls underwent indirect calorimetry. Although Keap1-hypo mice showed increased energy expenditure when normalized to body weight or lean body mass (Fig. 5B), after analyzing the data with analysis of covariance (ANCOVA)[34, 35] using body weight as a covariate, neither the genotype nor the covariate effect was statistically significant (F=0.500; p=0.502 and F=2.410; p=0.165 respectively). Similarly, analysis with ANCOVA using the lean body mass as a covariate, revealed a statistically significant covariate effect, (F=7.712; p=0.027) but not a significant genotype effect (F=2.469; p=0.160). This indicates no significant effect of genotype on the energy expenditure beyond the effect of genotype on lean body mass. Last, indirect calorimetry did not reveal any difference in the respiratory exchange ratio (RER) between the two genotypes, indicating no difference in the use of carbohydrate or fat as an energy source, and the cumulative energy intake did not show any difference in the food consumption (Fig. 5C).
4. Discussion
In this study we demonstrated that genetic activation of the Keap1/Nrf2 pathway leads to a repressed gluconeogenic and lipogenic program that is potentially mediated by activated Ampk signaling. Gluconeogenesis is a highly regulated metabolic pathway which is important in the starved state as it produces glucose from non-carbohydrate substrates. In the case of T2D, the gluconeogenesis rate is usually increased [36], contributing to increased circulating glucose levels. Thus, gluconeogenesis is a target for antidiabetic, glucose-lowering drugs, with metformin being the most widely used anti-gluconeogenic drug. The investigation of other factors that potentially affect gluconeogenesis may lead to the development of novel targeted therapies or to the repurposing of already existing drugs. Herein, Nrf2 is proposed as a novel factor that can affect gluconeogenesis as observed in primary hepatocyte cultures as well as mice on HFD. Previous studies have also pointed in this direction by showing that Keap1flox/− (one Keap1 allele hypomorphic, the other knockout) mice in the db/db background (leptin receptor mutants, genetic model of obesity) have decreased expression of G6pase in their livers. These results were verified at the cell culture level using the AML12 hepatocyte cell line treated with CDDO-Im [19]. On the other hand, increased levels of Pepck, another rate limiting enzyme of gluconeogenesis, have been reported in the Nrf2 knockout mice [18, 37]. Hence, our present study, using for the first time an in vitro functional assay (glucose production from primary hepatocytes) along with the in vivo model (Keap1-hypo mice on HFD) accentuates the role of Nrf2 in gluconeogenesis.
However, the mechanism of the Nrf2-mediated repression of gluconeogenesis is not clear. In this study the Ampk pathway is proposed as a possible mediator. Ampk was found to be more activated than WT in the Keap1-hypo primary hepatocytes and in the Keap1-hypo livers. Other studies have also indicated that Nrf2 pathway activation is accompanied with increased Ampk signaling. This has been confirmed using genetic models of Nrf2 pathway activation in lung tissues [22], mouse liver [23] and also using pharmacological inducers of the Nrf2 pathway (CDDO-Me) [21] in mice. Another study using Nrf2 knockout mice showed the Ampk pathway is downregulated when compared to the WT [38]. Ampk can repress gluconeogenesis by suppressing the transcriptional activity of Torc2 and Forkhead box O1 (Foxo1) [39]. Torc2 acts as a coactivator of Creb which binds to the cAMP responsive elements (CRE) and Foxo1 binds to the insulin response element in the regulatory regions of Pepck and G6pase genes, regularly inducing their expression [40]. Nevertheless, the mechanism through which Nrf2 can lead to increased Ampk activation requires further investigation. The study where CDDO-Me was used as an activator of the Nrf2 pathway showed that Ampk is activated by the upstream kinase Lkb1, which has the property of activating Ampk and other Ampk-related kinases [41]. The mechanism of Lkb1 modulation by Nrf2 has not yet been elucidated. An alternative mechanism of Nrf2-mediated repression of gluconeogenesis can be based on the observation that levels of c-AMP response element binding protein (Creb) are lower after Nrf2 pathway activation [19], as decreased levels of Creb will reduce the transcription of both Pepck and G6pase that possess c-AMP response elements (CRE) in their regulatory regions. However, further research is warranted to elucidate how Nrf2 can affect Creb levels. Another study using Nrf2 knockout mice showed that 2/3 of these mice have a congenital intrahepatic shunt (a much higher percentage than what is expected in the C57Bl6 mice [42]) that affects the hepatic oxygen and protein expression gradients [43]. In these mice, Pepck showed a more diffused expression not only confined to the periportal zone but expanding to both periportal and centrilobular areas due to the difference in oxygen tension. This means that at least in Nrf2 knockout mice the expression of this gluconeogenic enzyme can also be regulated in an alternative way.
This study also examined lipogenesis, as Keap1-hypo mice demonstrated ameliorated hepatic steatosis. The levels of Fasn and Acc1, two rate limiting enzymes of lipogenesis, were assessed and found to be reduced when compared to the WT controls. The mRNA levels of these two enzymes had also been found to be downregulated in the livers of mice treated with CDDO-Im and in Keap1flox/−::Albumin-Cre mice [44]. Another study demonstrated that CDDO-Me treatment can also downregulate these enzymes in muscle and liver of mice fed a western diet [21]. The mechanism of the repression of these enzymes by Nrf2 is not clear; herein we suggest that activatation of the Ampk pathway could lead to this repression as functional Ampk can phosphorylate Srebp-1c (sterol regulatory element-binding protein 1c) at Ser372. Srebp-1c phosphorylation at Ser372 suppresses Srebp-1c precursor cleavage and nuclear translocation, thus repressing the expression of downstream lipogenic targets such as Acc1 and Fasn [45]. Moreover Ampk can also directly phosphorylate Acc1 at Ser79, thereby inhibiting its enzymatic activity [46].
The metabolic phenotype of the Keap1-hypo mice after HFD cannot be attributed exclusively to the observed differences in gluconeogenesis and lipogenesis in the liver. Other tissues such as muscle, adipose tissue and pancreas can also contribute to the ameliorated glucose tolerance and to the tendency for increased energy expenditure. For example, the increased energy consumption may be due to increased oxygen consumption by the muscle as previously demonstrated in isolated muscles of Keap1flox/− mice fed a high-calorie diet [19]. In the present study indirect calorimetry in Keap1-hypo mice was performed for the first time and revealed a tendency for increased energy expenditure (Fig. 5B). The high stringency of the statistical method used (ANCOVA) may require a larger cohort to reach statistically significant results. The ameliorated glucose tolerance (Fig. 1A) and the preservation of glucose-stimulated insulin secretion (Supplementary Figure 3) by the pancreas can be attributed to protection of the pancreatic β-cells from oxidative stress by the enhanced Nrf2 pathway [12]. Moreover, increased uptake of glucose by the muscle due to its ameliorated insulin sensitivity (Supplementary Figure 4) could also contribute to the lower glucose levels of the Keap1-hypo mice.
In conclusion, the present study proposes Nrf2 as a potential repressor of hepatic gluconeogenesis and lipogenesis. It is presented for the first time that induced glucose production by Keap1-hypo primary hepatocytes is repressed when compared to WT and that an activated Ampk signaling axis that leads to lower expression of gluconeogenic and lipogenic genes is present in the Keap1-hypo hepatocytes and livers. This effect could explain, at least partially, the ameliorated diabetic phenotype of the Keap1-hypo mice after exposure to HFD. The indirect calorimetry and in vivo insulin signaling data, which complement the description of the metabolic phenotype of the Keap1-hypo mice, also point to new research directions. Further studies such as hyperinsulinemic euglycemic clamps with tracer glucose in mice with genetic or pharmacologic enhancement of the Nrf2 pathway could provide more insights regarding endogenous glucose production in the Keap1-hypo mice. In view of the small molecule inducers of the Keap1/Nrf2 pathway (sulforaphane, CDDO-Me, dimethyl fumarate) that are currently being used in clinical trials [47–49], the present study could have a translational impact for the field of obesity-T2D prevention through Nrf2 signaling.
Supplementary Material
Genetic activation of the Nrf2 pathway leads to ameliorated glucose tolerance in mice on high-fat diet.
Less liver steatosis after high-fat diet is observed in mice with enhanced Nrf2 signaling.
Activated Ampk pathway and repressed hepatic gluconeogenesis and lipogenesis in mice with enhanced Nrf2 signaling.
Acknowledgments
This work was supported by grants CA94076 and CA197222 from the National Institutes of Health to TWK.
DVC is supported by Marie Curie PIOF-GA-2012-329442 (7th European Community Framework Programme).
We thank Dr. Ken Itoh (Hirosaki University) for providing us with the anti-Nrf2 antibody.
Abbreviations
- Acc
acetyl-CoA carboxylase
- Ampk
AMP-activated protein kinase
- C/ebpβ
CCAAT/enhancer-binding protein beta
- CDDO-Im
1[2-Cyano-3,12-dioxooleana-1,9(11)-dien-28-oyl]imidazole
- CDDO-Me
2-cyano-3,12-dioxo-oleana-1,9(11)-dien-28-oic acid, methyl ester
- Fgf21
Fibroblast growth factor 21
- Foxo1
Forkhead box O1
- G6pase
Glucose-6-phosphatase
- HFD
high-fat diet
- Keap1
kelch-like ECH-associated protein 1
- Keap1-hypo
hypomorphic Keap1 allele mouse
- Nqo1
NADPH quinone oxidoreductase 1
- Nrf2
NFE2-related factor 2
- Pepck
Phosphoenolpyruvate carboxykinase 1
- Pparγ
Peroxisome proliferator-activated receptor gamma
- Std
standard diet
- T2D
Type 2 diabetes
- Torc2
transducer of regulated Creb activity 2
- WT
wild-type
Footnotes
Author contributions
SLS, JJS, SA and DVC researched data. SLS, TWK and DVC wrote the manuscript. NW, MY and TWK contributed to discussion and reviewed the manuscript.
Publisher's Disclaimer: This is a PDF file of an unedited manuscript that has been accepted for publication. As a service to our customers we are providing this early version of the manuscript. The manuscript will undergo copyediting, typesetting, and review of the resulting proof before it is published in its final citable form. Please note that during the production process errors may be discovered which could affect the content, and all legal disclaimers that apply to the journal pertain.
References
- 1.Ford ES, Giles WH, Dietz WH. JAMA. 2002;287:356–359. doi: 10.1001/jama.287.3.356. [DOI] [PubMed] [Google Scholar]
- 2.Marchesini G, Brizi M, Bianchi G, Tomassetti S, Bugianesi E, Lenzi M, McCullough AJ, Natale S, Forlani G, Melchionda N. Diabetes. 2001;50:1844–1850. doi: 10.2337/diabetes.50.8.1844. [DOI] [PubMed] [Google Scholar]
- 3.Kahn CR. Diabetes. 1994;43:1066–1084. doi: 10.2337/diab.43.8.1066. [DOI] [PubMed] [Google Scholar]
- 4.Gastaldelli A, Baldi S, Pettiti M, Toschi E, Camastra S, Natali A, Landau BR, Ferrannini E. Diabetes. 2000;49:1367–1373. doi: 10.2337/diabetes.49.8.1367. [DOI] [PubMed] [Google Scholar]
- 5.Foretz M, Hebrard S, Leclerc J, Zarrinpashneh E, Soty M, Mithieux G, Sakamoto K, Andreelli F, Viollet B. J Clin Invest. 2010;120:2355–2369. doi: 10.1172/JCI40671. [DOI] [PMC free article] [PubMed] [Google Scholar]
- 6.Bugianesi E, McCullough AJ, Marchesini G. Hepatology. 2005;42:987–1000. doi: 10.1002/hep.20920. [DOI] [PubMed] [Google Scholar]
- 7.Kensler TW, Wakabayashi N, Biswal S. Annu Rev Pharmacol Toxicol. 2007;47:89–116. doi: 10.1146/annurev.pharmtox.46.120604.141046. [DOI] [PubMed] [Google Scholar]
- 8.Motohashi H, Yamamoto M. Trends Mol Med. 2004;10:549–557. doi: 10.1016/j.molmed.2004.09.003. [DOI] [PubMed] [Google Scholar]
- 9.Wakabayashi N, Dinkova-Kostova AT, Holtzclaw WD, Kang MI, Kobayashi A, Yamamoto M, Kensler TW, Talalay P. Proc Natl Acad Sci U S A. 2004;101:2040–2045. doi: 10.1073/pnas.0307301101. [DOI] [PMC free article] [PubMed] [Google Scholar]
- 10.Kwak MK, Wakabayashi N, Itoh K, Motohashi H, Yamamoto M, Kensler TW. J Biol Chem. 2003;278:8135–8145. doi: 10.1074/jbc.M211898200. [DOI] [PubMed] [Google Scholar]
- 11.Furukawa S, Fujita T, Shimabukuro M, Iwaki M, Yamada Y, Nakajima Y, Nakayama O, Makishima M, Matsuda M, Shimomura I. J Clin Invest. 2004;114:1752–1761. doi: 10.1172/JCI21625. [DOI] [PMC free article] [PubMed] [Google Scholar]
- 12.Yagishita Y, Fukutomi T, Sugawara A, Kawamura H, Takahashi T, Pi J, Uruno A, Yamamoto M. Diabetes. 2014;63:605–618. doi: 10.2337/db13-0909. [DOI] [PubMed] [Google Scholar]
- 13.Chartoumpekis DV, Kensler TW. Curr Diabetes Rev. 2013;9:137–145. doi: 10.2174/1573399811309020005. [DOI] [PMC free article] [PubMed] [Google Scholar]
- 14.Uruno A, Yagishita Y, Yamamoto M. Arch Biochem Biophys. 2015;566:76–84. doi: 10.1016/j.abb.2014.12.012. [DOI] [PubMed] [Google Scholar]
- 15.Pi J, Leung L, Xue P, Wang W, Hou Y, Liu D, Yehuda-Shnaidman E, Lee C, Lau J, Kurtz TW, Chan JY. J Biol Chem. 2010;285:9292–9300. doi: 10.1074/jbc.M109.093955. [DOI] [PMC free article] [PubMed] [Google Scholar]
- 16.Hou Y, Xue P, Bai Y, Liu D, Woods CG, Yarborough K, Fu J, Zhang Q, Sun G, Collins S, Chan JY, Yamamoto M, Andersen ME, Pi J. Free Radic Biol Med. 2012;52:462–472. doi: 10.1016/j.freeradbiomed.2011.10.453. [DOI] [PMC free article] [PubMed] [Google Scholar]
- 17.Furusawa Y, Uruno A, Yagishita Y, Higashi C, Yamamoto M. Genes Cells. 2014;19:864–878. doi: 10.1111/gtc.12186. [DOI] [PubMed] [Google Scholar]
- 18.Chartoumpekis DV, Ziros PG, Psyrogiannis AI, Papavassiliou AG, Kyriazopoulou VE, Sykiotis GP, Habeos IG. Diabetes. 2011;60:2465–2473. doi: 10.2337/db11-0112. [DOI] [PMC free article] [PubMed] [Google Scholar]
- 19.Uruno A, Furusawa Y, Yagishita Y, Fukutomi T, Muramatsu H, Negishi T, Sugawara A, Kensler TW, Yamamoto M. Mol Cell Biol. 2013;33:2996–3010. doi: 10.1128/MCB.00225-13. [DOI] [PMC free article] [PubMed] [Google Scholar]
- 20.Shin S, Wakabayashi J, Yates MS, Wakabayashi N, Dolan PM, Aja S, Liby KT, Sporn MB, Yamamoto M, Kensler TW. Eur J Pharmacol. 2009;620:138–144. doi: 10.1016/j.ejphar.2009.08.022. [DOI] [PMC free article] [PubMed] [Google Scholar]
- 21.Saha PK, Reddy VT, Konopleva M, Andreeff M, Chan L. J Biol Chem. 2010;285:40581–40592. doi: 10.1074/jbc.M110.176545. [DOI] [PMC free article] [PubMed] [Google Scholar]
- 22.Paek J, Lo JY, Narasimhan SD, Nguyen TN, Glover-Cutter K, Robida-Stubbs S, Suzuki T, Yamamoto M, Blackwell TK, Curran SP. Cell Metab. 2012;16:526–537. doi: 10.1016/j.cmet.2012.09.007. [DOI] [PMC free article] [PubMed] [Google Scholar]
- 23.Xu J, Donepudi AC, Moscovitz JE, Slitt AL. PLoS One. 2013;8:e79841. doi: 10.1371/journal.pone.0079841. [DOI] [PMC free article] [PubMed] [Google Scholar]
- 24.Hardie DG, Ross FA, Hawley SA. Nat Rev Mol Cell Biol. 2012;13:251–262. doi: 10.1038/nrm3311. [DOI] [PMC free article] [PubMed] [Google Scholar]
- 25.Okawa H, Motohashi H, Kobayashi A, Aburatani H, Kensler TW, Yamamoto M. Biochem Biophys Res Commun. 2006;339:79–88. doi: 10.1016/j.bbrc.2005.10.185. [DOI] [PubMed] [Google Scholar]
- 26.Taguchi K, Maher JM, Suzuki T, Kawatani Y, Motohashi H, Yamamoto M. Mol Cell Biol. 2010;30:3016–3026. doi: 10.1128/MCB.01591-09. [DOI] [PMC free article] [PubMed] [Google Scholar]
- 27.Wakabayashi N, Itoh K, Wakabayashi J, Motohashi H, Noda S, Takahashi S, Imakado S, Kotsuji T, Otsuka F, Roop DR, Harada T, Engel JD, Yamamoto M. at Genet. 2003;35:238–245. doi: 10.1038/ng1248. [DOI] [PubMed] [Google Scholar]
- 28.Ishizuka T, Klepcyk P, Liu S, Panko L, Liu S, Gibbs EM, Friedman JE. Diabetes. 1999;48:1061–1069. doi: 10.2337/diabetes.48.5.1061. [DOI] [PubMed] [Google Scholar]
- 29.Wakabayashi N, Skoko JJ, Chartoumpekis DV, Kimura S, Slocum SL, Noda K, Palliyaguru DL, Fujimuro M, Boley PA, Tanaka Y, Shigemura N, Biswal S, Yamamoto M, Kensler TW. Mol Cell Biol. 2014;34:653–663. doi: 10.1128/MCB.01408-13. [DOI] [PMC free article] [PubMed] [Google Scholar]
- 30.Pfaffl MW. Nucleic Acids Res. 2001;29:e45. doi: 10.1093/nar/29.9.e45. [DOI] [PMC free article] [PubMed] [Google Scholar]
- 31.Wang X, Spandidos A, Wang H, Seed B. Nucleic Acids Res. 2012;40:D1144–1149. doi: 10.1093/nar/gkr1013. [DOI] [PMC free article] [PubMed] [Google Scholar]
- 32.Koo SH, Flechner L, Qi L, Zhang X, Screaton RA, Jeffries S, Hedrick S, Xu W, Boussouar F, Brindle P, Takemori H, Montminy M. Nature. 2005;437:1109–1111. doi: 10.1038/nature03967. [DOI] [PubMed] [Google Scholar]
- 33.Puigserver P, Rhee J, Donovan J, Walkey CJ, Yoon JC, Oriente F, Kitamura Y, Altomonte J, Dong H, Accili D, Spiegelman BM. Nature. 2003;423:550–555. doi: 10.1038/nature01667. [DOI] [PubMed] [Google Scholar]
- 34.Speakman JR, Fletcher Q, Vaanholt L. Dis Model Mech. 2013;6:293–301. doi: 10.1242/dmm.009860. [DOI] [PMC free article] [PubMed] [Google Scholar]
- 35.Tschop MH, Speakman JR, Arch JR, Auwerx J, Bruning JC, Chan L, Eckel RH, Farese RV, Jr, Galgani JE, Hambly C, Herman MA, Horvath TL, Kahn BB, Kozma SC, Maratos-Flier E, Muller TD, Munzberg H, Pfluger PT, Plum L, Reitman ML, Rahmouni K, Shulman GI, Thomas G, Kahn CR, Ravussin E. Nat Methods. 2012;9:57–63. doi: 10.1038/nmeth.1806. [DOI] [PMC free article] [PubMed] [Google Scholar]
- 36.Magnusson I, Rothman DL, Katz LD, Shulman RG, Shulman GI. J Clin Invest. 1992;90:1323–1327. doi: 10.1172/JCI115997. [DOI] [PMC free article] [PubMed] [Google Scholar]
- 37.Zhang YK, Wu KC, Liu J, Klaassen CD. Toxicol Appl Pharmacol. 2012;264:305–314. doi: 10.1016/j.taap.2012.09.014. [DOI] [PMC free article] [PubMed] [Google Scholar]
- 38.Meakin PJ, Chowdhry S, Sharma RS, Ashford FB, Walsh SV, McCrimmon RJ, Dinkova-Kostova AT, Dillon JF, Hayes JD, Ashford ML. Mol Cell Biol. 2014;34:3305–3320. doi: 10.1128/MCB.00677-14. [DOI] [PMC free article] [PubMed] [Google Scholar]
- 39.Zhang BB, Zhou G, Li C. Cell Metab. 2009;9:407–416. doi: 10.1016/j.cmet.2009.03.012. [DOI] [PubMed] [Google Scholar]
- 40.Liu Y, Dentin R, Chen D, Hedrick S, Ravnskjaer K, Schenk S, Milne J, Meyers DJ, Cole P, Yates J, 3rd, Olefsky J, Guarente L, Montminy M. Nature. 2008;456:269–273. doi: 10.1038/nature07349. [DOI] [PMC free article] [PubMed] [Google Scholar]
- 41.Lizcano JM, Goransson O, Toth R, Deak M, Morrice NA, Boudeau J, Hawley SA, Udd L, Makela TP, Hardie DG, Alessi DR. EMBO J. 2004;23:833–843. doi: 10.1038/sj.emboj.7600110. [DOI] [PMC free article] [PubMed] [Google Scholar]
- 42.Cudalbu C, McLin VA, Lei H, Duarte JM, Rougemont AL, Oldani G, Terraz S, Toso C, Gruetter R. PLoS One. 2013;8:e69782. doi: 10.1371/journal.pone.0069782. [DOI] [PMC free article] [PubMed] [Google Scholar]
- 43.Skoko JJ, Wakabayashi N, Noda K, Kimura S, Tobita K, Shigemura N, Tsujita T, Yamamoto M, Kensler TW. Toxicol Sci. 2014;141:112–119. doi: 10.1093/toxsci/kfu109. [DOI] [PMC free article] [PubMed] [Google Scholar]
- 44.Yates MS, Tran QT, Dolan PM, Osburn WO, Shin S, McCulloch CC, Silkworth JB, Taguchi K, Yamamoto M, Williams CR, Liby KT, Sporn MB, Sutter TR, Kensler TW. Carcinogenesis. 2009;30:1024–1031. doi: 10.1093/carcin/bgp100. [DOI] [PMC free article] [PubMed] [Google Scholar]
- 45.Li Y, Xu S, Mihaylova MM, Zheng B, Hou X, Jiang B, Park O, Luo Z, Lefai E, Shyy JY, Gao B, Wierzbicki M, Verbeuren TJ, Shaw RJ, Cohen RA, Zang M. ell Metab. 2011;13:376–388. doi: 10.1016/j.cmet.2011.03.009. [DOI] [PMC free article] [PubMed] [Google Scholar]
- 46.Ha J, Daniel S, Broyles SS, Kim KH. J Biol Chem. 1994;269:22162–22168. [PubMed] [Google Scholar]
- 47.Kensler TW, Ng D, Carmella SG, Chen M, Jacobson LP, Munoz A, Egner PA, Chen JG, Qian GS, Chen TY, Fahey JW, Talalay P, Groopman JD, Yuan JM, Hecht SS. Carcinogenesis. 2012;33:101–107. doi: 10.1093/carcin/bgr229. [DOI] [PMC free article] [PubMed] [Google Scholar]
- 48.Pergola PE, Raskin P, Toto RD, Meyer CJ, Huff JW, Grossman EB, Krauth M, Ruiz S, Audhya P, Christ-Schmidt H, Wittes J, Warnock DG, Investigators BS. N Engl J Med. 2011;365:327–336. doi: 10.1056/NEJMoa1105351. [DOI] [PubMed] [Google Scholar]
- 49.Gold R, Kappos L, Arnold DL, Bar-Or A, Giovannoni G, Selmaj K, Tornatore C, Sweetser MT, Yang M, Sheikh SI, Dawson KT, Investigators DS. N Engl J Med. 2012;367:1098–1107. doi: 10.1056/NEJMoa1114287. [DOI] [PubMed] [Google Scholar]
Associated Data
This section collects any data citations, data availability statements, or supplementary materials included in this article.