Abstract
The structural organization of the brain is important for normal brain function and is critical to understand in order to evaluate changes that occur during disease processes. Three-dimensional (3D) imaging of the mouse brain is necessary to appreciate the spatial context of structures within the brain. In addition, the small scale of many brain structures necessitates resolution at the ∼10 μm scale. 3D optical imaging techniques, such as optical projection tomography (OPT), have the ability to image intact large specimens (1 cm3) with ∼5 μm resolution. In this work we assessed the potential of autofluorescence optical imaging methods, and specifically OPT, for phenotyping the mouse brain. We found that both specimen size and fixation methods affected the quality of the OPT image. Based on these findings we developed a specimen preparation method to improve the images. Using this method we assessed the potential of optical imaging for phenotyping. Phenotypic differences between wild-type male and female mice were quantified using computer-automated methods. We found that optical imaging of the endogenous autofluorescence in the mouse brain allows for 3D characterization of neuroanatomy and detailed analysis of brain phenotypes. This will be a powerful tool for understanding mouse models of disease and development and is a technology that fits easily within the workflow of biology and neuroscience labs.
Keywords: optical projection tomography, phenotype, whisker barrel, sexual dimorphism
the structural organization of the brain is important for normal brain function, and evaluating its changes is critical in understanding disease progression. The brain and its components are inherently three-dimensional (3D); therefore, 3D visualizations of the brain are needed to appreciate the spatial context of the structures within it. This has led to the use of 3D imaging to monitor the changes that occur in the brain. Magnetic resonance imaging (MRI) and positron emission tomography combined with computed tomography are employed to image on a more macroscopic scale. Although these techniques are capable of imaging the entire brain, they often lack the image contrast or resolution necessary to visualize small structures, such as anatomic nuclei, or to localize signals to individual structures. Microscopic techniques, such as two-photon scanning laser microscopy and confocal microscopy, can achieve cellular and subcellular resolution (12, 24). However, these techniques lack the penetration depth to image the entire brain and are limited to imaging depths of only a few hundred microns. This is insufficient for imaging the complete mouse brain, the mammal most often used in biomedical research. Traditional histological sectioning is able to achieve cellular resolution over arbitrarily large volumes, but obtaining 3D data sets is time-consuming, and alignment of serial sections is notoriously difficult due to distortions that occur when slicing the tissue, making histological sectioning impractical for routine use.
For this reason, the development of 3D imaging methods that operate on a mesoscopic scale, with 5–50 μm resolution, over relatively large fields of view, approximately the size of a mouse brain, is of great interest. These imaging techniques can be used to study mouse brain organization at a critical scale between those offered by macroscopic and microscopic imaging. We have extensively explored the use of ex vivo MRI for this purpose (4, 5, 14, 15). Other alternatives include several 3D optical imaging techniques, which show promise at this scale and have the benefit of achieving cellular or near-cellular resolution with the ability to handle large specimens on the order of 10 mm3 or more. Such optical techniques include optical projection tomography (OPT) (21, 25), light sheet-based fluorescence microscopy (LSFM) (23), including single-plane illumination microscopy (25) and ultramicroscopy (UM) (9), high-resolution episcopic microscopy (HREM) (28), episcopic fluorescence image capture (EFIC) (25), and serial two-photon tomography (16) among others. In principle, these optical methods permit the use of standard immunofluorescent markers to visualize specific cell types in combination with tissue autofluorescence to visualize the neuroanatomy, which allows the distribution of cells to be determined within an anatomical context. A crucial component of these studies is the visualization, identification, and characterization of neuroanatomical differences between sample groups.
In this study we demonstrate the potential and the limitations of autofluorescent imaging at the mesoscopic scale for anatomical phenotyping of the mouse brain. We explored novel visualizations enabled by 3D autofluorescent imaging and tested the potential of computer-automated quantification for identification of subtle neuroanatomical differences. While we anticipate the results will be applicable to studies with other mesoscopic optical imaging methods, in this study we used OPT, which can resolve ∼5 μm (27) in a 3D data set with ∼1 cm3 field of view within an imaging time of ∼15 min. In OPT, optically cleared specimens are rotated 360°, and a series of projection images is collected. The projection images are then reconstructed into a final 3D image. The endogenous autofluorescence in the brain allows many structures to be visualized with optical imaging methods.
For our study, we first developed a protocol to achieve high-quality OPT images of the endogenous autofluorescence of the mouse brain, varying both the size of the samples and the concentration of fixative. Subsequently, we surveyed our brain images to determine the anatomical features that could be visualized. Finally, we used computer-automated methods to identify subtle neuroanatomical differences present between male and female wild-type mice.
METHODS
Specimen Preparation
Animals.
All animal experiments were approved by the animal care committee of the Toronto Centre for Phenogenomics (Toronto, ON, Canada). Animals were maintained in standard housing conditions with five mice per cage (cages 7 in. width × 11 in. depth × 8.5 in. height in size). In preparation for perfusion fixation for all experiments, 8 wk old wild-type C57BL6/J mice (Toronto Centre for Phenogenomics, in-house breeding) were anesthetized with an intraperitoneal injection of 150 mg/kg ketamine and 10 mg/kg xylazine.
Specimen thickness studies.
To examine the effect of specimen thickness on OPT images, male mice were fixed with 4% paraformaldehyde (PFA) as described below. The hemispheres of the fixed specimens were divided and then sectioned using a coronal brain mold (Kent Scientific, Torrington, CT) or a vibratome (Leica). For this study, we used section thicknesses of 0.5 mm (n = 10), 1.0 mm (n = 10), 4.0 mm (n = 3), and 6.0 mm (n = 2).
Fixation studies.
To study the effect of fixation on the image quality, male mice were perfused with 4% PFA (n = 2) or 1% PFA (n = 2). For 1% PFA fixation, 15 ml of 0.1 M PBS containing 10 U/ml heparin (Sigma, Oakville, ON, Canada) was intracardially perfused followed by 15 ml of 1% PFA. The brains were removed from the skull and soaked in 1% PFA for 2 h, washed, and stored in 0.1 M PBS until imaging. For 4% PFA fixation, mice were perfused with 30 ml of 0.1 M PBS containing 10 U/ml heparin (Sigma) followed by 30 ml 4% PFA. The brains were soaked in the skull overnight in 4% PFA, washed, and stored in 0.1 M PBS until imaging. All perfusions were performed with a Pharmacia minipump at a rate of ∼1 ml/min. Specimens were sectioned 6 mm thick using the coronal brain mold, and the hemispheres were divided.
Sexual dimorphism studies.
To investigate the potential for optical imaging to be used to evaluate subtle phenotypic differences, mice were perfused with 1% PFA (n = 9 male, n = 9 female) as described above and subsequently sectioned to 6 mm thick samples using the coronal brain mold.
OPT preparation.
For all components of the study, specimens were embedded in 1% agarose (Fisher Scientific, Ottawa, ON, Canada) and then dehydrated stepwise to 100% ethanol over the course of 3 days. They were subsequently cleared in BABB (1:2 benzyl alcohol, benzyl benzoate) for 2–3 days.
OPT Imaging
Image acquisition.
All images were acquired using a custom-built OPT scanner. We took 1,200 projection views over 360° using a λ = 425 ± 15 nm excitation filter and λ = 473 nm long-pass emission filter and a 1,024 × 1,024 field of view. Projection images were captured on a cooled charge-coupled device camera (QImaging, Surrey, BC, Canada). The microscope zoom was held constant for comparisons of different specimen preparation protocols. Images were reconstructed using SkyScan software, NRECON (Kontich, Belgium).
Visualization.
One of the key benefits of 3D imaging is the ability to visualize structures of complex shape in their native 3D configuration. To visualize the cortex in this fashion, we segmented the cortex and computed curved lines traversing it according to Laplace's equation with methods described in detail elsewhere (13). These lines intersect the edges of the cortex perpendicularly. Selection of a 3D surface at increments throughout the cortex then allows different layers in the cortex to be visualized. From the outer surface, layer 4 was identified as lying 30–40% of the distance through the cortex. We used this method to highlight the features of cortical layer 4 by mapping the OPT intensities onto the surface defined in this fashion.
Registration Analysis
Anatomical differences between the male and female brains were detected through a process of automated computer registration. The registration procedure included linear and iterative nonlinear stages (1, 10). At completion, we obtained individual transforms for each sample that brought all brain structures into alignment in an unbiased average position. After transformation of all images into this space, a mean of all image signal intensities produced a population average for the study sample. We used the deformations that transformed images into the average space for volumetric analyses by computing the determinant of the Jacobian matrix, which represents the volume change at each voxel as a multiplicative scale factor. For voxel-wise analyses, the logarithm of this scale factor was compared statistically across all samples. We also computed volumes of segmented structures. For this purpose a segmented anatomical atlas of 36 structures was registered to the population average, and then voxel-wise volume changes were integrated over the regions defined by each segmented structure to obtain the volume measurements.
Statistical Analysis
In computational analyses of differences in the male and female brains, statistical tests for volume changes were performed after correction of volume based on a mouse-specific scale factor intended to account for biological and preparation-induced variability of sample size. To obtain the mouse-specific scale factor, all structure volumes for each mouse were normalized by the sex-specific structure mean. Subsequently, the average of these normalized volumes was computed for each mouse and used as the mouse-specific scale factor to correct the volumes globally. The differences in the logarithm of the Jacobian determinants were evaluated voxel-wise with a Wilcoxon test, accounting for multiple comparisons using a 10% false discovery rate (7). Similarly, we statistically compared the corrected volumes of male and female mouse brain structures with a Wilcoxon test, accounting for multiple comparisons using a 5% false discovery rate.
RESULTS
Autofluorescent Imaging: Specimen Size and Fixation Protocol Considerations
We first assessed the contribution of brain specimen size and fixation protocol on our ability to image the mouse brain with optical methods, and specifically with OPT. To assess the influence of size on overall image quality, we used OPT to image sections of the mouse brain that varied in thickness (0.5–6 mm). We observed a greater amount of detail in 0.5 mm sections compared with thicker sections (Fig. 1). Histograms of the image signal intensities in cortical regions of interest (ROIs), for example, confirm that there is more distinct contrast in thin sections (0.5 mm) than in thick sections (6 mm). Thus, there is a trade-off between specimen size and image quality. Selection of a specimen as small as is feasible while maintaining the 3D nature of the data for a given application will produce the best results.
Fig. 1.
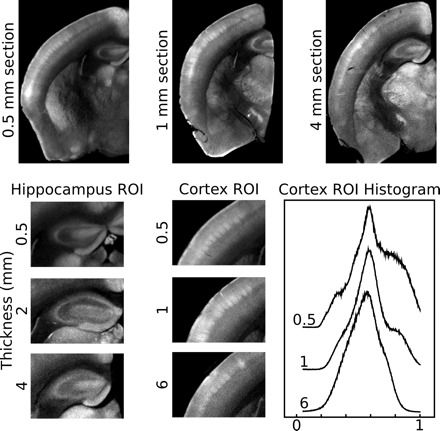
Effect of specimen size on image quality. Optical projection tomography (OPT) images of half-brains that were sectioned to be 0.5, 1, 4, or 6 mm thick are shown. With increasing sample thickness, the images are more blurred and the details are less resolved. This is highlighted in the both hippocampal and cortical regions of interest (ROI). In the hippocampal ROI there is a decrease in apparent image contrast with increasing thickness. This is also apparent in the cortical ROI, where the barrel field in layer 4 is less defined in the 6 mm sample compared with the 0.5 mm sample. This is further demonstrated in the cortical ROI histogram, where more at distinct intensities are observed in thinner samples.
We also looked at the effects of the fixation protocol on the autofluorescent images as it has been reported that fixatives affect the fluorescence of cells and tissue (11). We compared our standard 4% PFA fixation to a 1% PFA fixation (Fig. 2). We found that there is a substantial improvement in the OPT image contrast after a 1% PFA fixation compared with a 4% PFA fixation. For example, with a 1% PFA fixation, the layering in the cortex and the striations in the caudate/putamen are more clearly defined and thalamic nuclei can be identified.
Fig. 2.
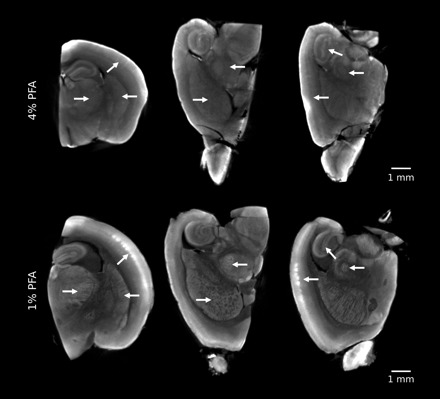
Effect of fixation on image quality. OPT images after a 4% paraformaldehyde (PFA) fixation and 1% PFA fixation are shown. The 1% PFA fixation shows a greater amount of detail compared with the 4% PFA fixation (arrows). The histograms of these 2 images were normalized, and the windowing and leveling are identical.
In quantitative phenotyping based on structural volume, it is important that there is consistency between samples and between groups of mice. In OPT sample preparation, the brains are first removed from the skulls, dehydrated, and then optically cleared. We expected that this processing might increase variability among samples. Therefore, we compared the variability in OPT brain specimens with the variability typical of fixed-brain MRI specimens, which can be imaged within the skull with minimal processing. Using our standard fixed brain protocol and MR imaging (21), we measured the standard deviation of 63 structure volumes (normalized to the structure size) of the individual structures in the mouse brain. In MRI, where the brain is left in the skull, the standard deviation of the structure volumes (normalized to the mean) ranged from 2 to 16% (n = 10 male C57BL/6J mice, 8 wk old). For OPT samples of the brain (excluding the cerebellum and olfactory bulbs), the normalized standard deviation of the 36 structure volumes was larger and ranged from 6 to 28% (n = 9 male C57BL/6J mice, 8 wk old). Taking the 35 structures common to both the OPT and the MRI atlas, we found that the normalized standard deviation of the OPT samples approximately doubled that of the MRI (based on a linear fit), suggesting the OPT sample preparation does increase variability in structural volume measurements (Fig. 3). To account for this variability in statistical analysis, we computed a scale factor for each specimen and then compared corrected structure volumes. After correction with this scale factor, the normalized standard deviation of OPT brain structure volume was reduced to the range of 2–20% (n = 9 male C57BL/6J mice, 8 wk old). The normalized standard deviation of the corrected structure volumes was comparable to those obtained with MRI (Fig. 3). Therefore, this scale factor was used for detailed volume measurements for phenotyping the male-female mouse brains to follow.
Fig. 3.
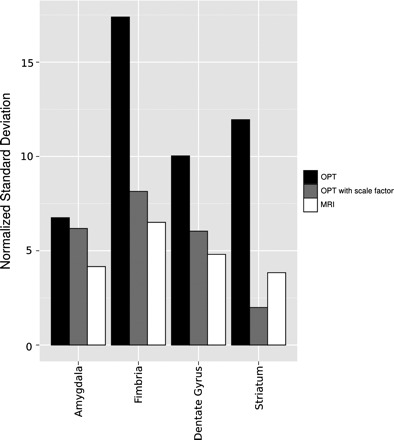
Variability in volume measurements. The variability in the volume measurements for a subset of structures is shown. The normalized standard deviation of the MRI volumes measurements (white bars) are consistently lower than that of the OPT volume measurements (black bars). With use of a common scale factor to correct for the variability introduced by sample processing, the normalized standard deviation of the OPT volume measurements is reduced (gray bars).
Visualizing Neuroanatomy With Autofluorescence
We used specimen sizes of ∼4 mm × 4 mm × 6 mm and a 1% PFA fixation to investigate which mouse brain structures could be visualized with 3D optical imaging of autofluorescence. Although our results indicate smaller sections of the brain would result in better image quality, we sought to identify structures in larger specimens to view them with the maximal spatial context as a survey of brain anatomy. Our results show excellent detail throughout the brain, and many discrete structures can be identified, some of which are highlighted in Fig. 4. Of note is the detail that is seen in the midbrain where the zona incerta, thalamic nuclei, and the lateral geniculate nucleus are distinguished (Fig. 4A). In a 4 mm × 4 mm × 3 mm section with a 1% PFA fixation, the thalamic barreloids in the posteriomedial nucleus of the thalamus are identified on an oblique 2D slice (Fig. 4B).
Fig. 4.
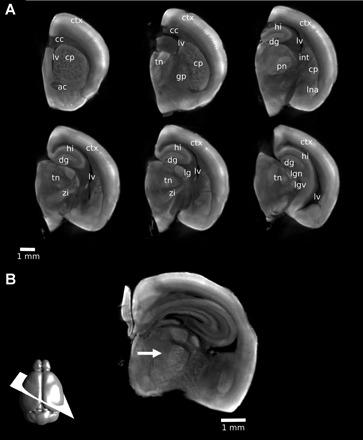
Visualizing neuroanatomy with autofluorescence. With a 1% PFA fixation, a number of structures can be identified in the mouse brain. Two-dimensional (2D) slices were extracted from a three-dimensional (3D) OPT image of a single hemisphere. Structures identified are labeled on multiple coronal slices (A) to indicate the 3D nature of the dataset: ctx, cortex; cc, corpus callosum; lv, lateral ventricle; cp, caudate/putamen; ac, anterior commissure; tn, thalamic nuclei; gp, globus pallidus; dg, dentate gyrus; hi, hippocampus; int, internal capsule; pn, posteriomedial nucleus; lna, lateral nucleus of the amygdala; zi, zona incerta; lg, lateral geniculate nucleus; lgd, dorsal lateral geniculate nucleus; lgv, ventral lateral geniculate nucleus. With 3D imaging, 2D slices at arbitrary orientations can be generated retrospectively. In B, the thalamic barreloids are visible on a 2D oblique slice through a 3D OPT image of a 3 mm section of the brain (arrow). The orientation of the slice is shown schematically at the bottom left.
Of the structures we identified with this method, one of the most beneficial to observe with 3D imaging was layer 4 of the cortex (Fig. 5). Traditionally, the whisker barrel field is studied by removing the cortex, flattening it, and then sectioning for histology (13). Imaging in 3D allows image planes through the cortex to be identified to visualize the large and small whisker barrel fields (Fig. 5A). Furthermore, with 3D imaging, the signal intensities can be mapped onto a curved surface running through layer 4 of the cortex, so that the whisker barrel fields can be represented in their native configuration. This provides a more complete representation of layer 4 in situ and allows for visualization of not only the large and small whisker barrel fields, but also other cortical fields (Fig. 5B). This demonstrates one of the clear advantages of mesoscopic 3D optical imaging over other 2D imaging modalities.
Fig. 5.
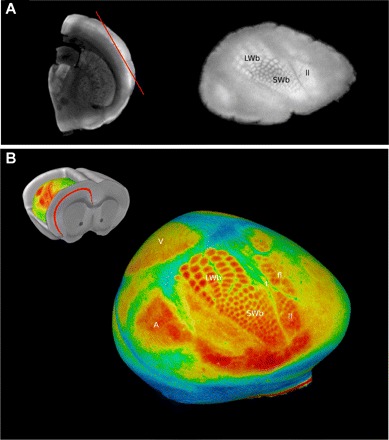
Visualizing the cortical barrel fields with autofluorescence. The barrel fields are found in layer 4 of the cerebral cortex and can be visualized on an oblique slice through the cortex (red line). The large and small whisker barrels and the lower lip are seen on this slice (A). A 3D surface through the cortex allows for a more complete visualization of layer 4 including additional cortical fields (B). LWb, large whisker barrels; SWb, small whisker barrels; V, visual cortex; A, auditory cortex; t, tail; fl, forelimb; ll, lower lip.
Comparison of Male and Female Brain Anatomy by Autofluorescent OPT Imaging
We sought to identify subtle phenotypic differences in brain morphology using computer-automated analyses of 3D optical images. We first assessed volume differences in the male and female brains by computing the effect size resulting from volumetric comparisons at each voxel (Fig. 6). We found that areas in some structures, such as the basal forebrain and cortex, were larger in females than males, while others, such as areas in the hypothalamus, amygdala, and bed nucleus of the stria terminalis, were larger in males than females. These regions are mapped with separate color-maps in Fig. 6.
Fig. 6.
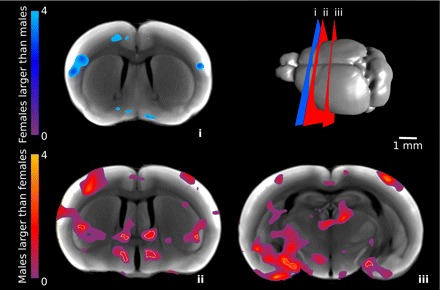
Volume differences in male and female brains. Per-voxel volume differences of neuroanatomical structures in male and female mice are shown by effect size differences of Jacobian statistical maps between male and female mice. Cold colors indicate regions where males are smaller than females, and hot colors indicate where males are larger than females. Outlined in white are voxels that are significant to a 10% false discovery rate. Slice locations (i–iii) are shown schematically at the top right.
In addition to identifying voxel-wise changes, we further evaluated segmented structure volumes in male and female mice. We compared the volumes of 36 different brain regions in the hemispheres of wild-type male (n = 9) and female mice (n = 9). Statistical comparison of structure volumes between sexes after correction by scale factors shows that the bed nucleus of the stria terminalis, globus pallidus, internal capsule, midbrain, stria medullaris, stria terminalis, striatum, thalamus, and zona incerta are all significantly larger in male mice compared with age-matched female mice (Fig. 7). The cerebellum and olfactory bulb were not analyzed for this study.
Fig. 7.
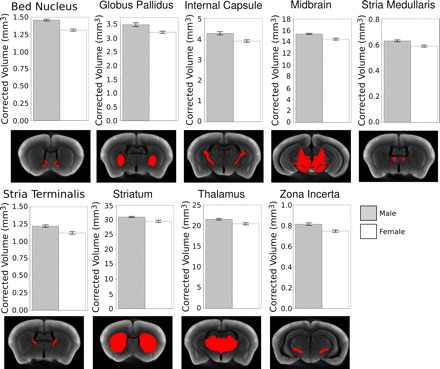
Structure volume differences in male and female brains. Subtle phenotypic differences in structure volumes between male (gray bars) and female (white bars) C57BL/6J mice were assessed. The volumes of the structures were corrected by a common scale factor for each mouse to account for the variability introduced by sample processing. The structures are highlighted in red beneath each graph on a consensus average of both the male and female mice. False discovery rate < 0.05, bar graphs show means ± SE.
DISCUSSION
Characterization of the structural organization of the brain requires 3D imaging of the mouse brain at high resolution. Mesoscopic optical imaging techniques, including OPT, allow large specimens to be imaged with ∼5 μm resolution. In this study, we demonstrated the use of autofluorescent imaging in the mouse brain for detection of brain morphology phenotypes. These, and other optical methods, will be powerful tools for assessing the structural organization of the brain and alterations that occur during development or as a result of disease.
Our results indicate that specimen preparation is an important step that affects the quality of 3D autofluorescent images. We found thinner sections provided higher-quality images and improved structural detail. Larger specimens, of course, allowed for more complete coverage of the tissue. This creates a trade-off between specimen size and image quality that is an important consideration in phenotyping studies. This trade-off is likely to be apparent in OPT and LSFM but may be less significant in block-face methods, such as HREM, EFIC, and serial two-photon tomography (16).
The fixation method also affects the quality of autofluorescent images. We found that lighter fixation, with 1% PFA, provided greater detail in the mouse brain images than standard 4% PFA fixation. It is possible that other fixatives would also produce a greater autofluorescent signal and improved images. Formalin and glutaraldehyde, for example, have been reported to produce greater autofluorescence than PFA (11) and may be advantageous for retaining autofluorescence. Of course, too little fixation may compromise specimen quality and increases fragility. This trade-off will be a consideration for all forms of autofluorescence based 3D imaging.
In our study, we used ethanol for the dehydration and BABB for the optical clearing of the specimens. Alternative clearing methods have recently been published. Scale is an aqueous-based clearing reagent that may be compatible with OPT (8). A tetrahydrofuran-based clearing method has also been reported recently for UM imaging (6). Both of these clearing methods will likely be applicable to various forms of 3D optical imaging.
Optical imaging using the autofluorescent signal in the mouse brain provides a unique contrast to structures in the mouse brain. We demonstrated visualization of small discrete structures, including, as an example, the thalamic nuclei. This capability enables phenotyping studies in mouse models where these nuclei may be affected. We also demonstrated a unique visualization of the whisker barrel fields in 3D. When the autofluorescent intensities are represented on a 3D surface through layer 4 of the cortex, the whisker barrel fields, as well as other cortical fields, can be appreciated in their native configuration. This will allow for changes in the whisker barrel fields due to genotype or environmental factors to be assessed quantitatively.
We expect that the autofluorescent OPT imaging results that we present here could also be obtained with alternative 3D fluorescent imaging modalities (LSFM, HREM, and EFIC). In fact, a view of the whisker barrel field on a 2D optical slice has been demonstrated previously with UM in the mouse brain at postnatal day 10 (3). Each of these alternative optical methods has their own relative advantages. Higher-resolution images may be obtained by block-face imaging methods, in which limited optical penetration is overcome by successive sectioning of the tissue (as opposed to optical clearing). OPT is an option that is relatively time efficient, requiring only ∼15 min for images at 5–10 μm resolution. This makes OPT an attractive option for high-throughput neuroanatomical phenotyping, as images can be acquired quickly.
A number of mouse models of human disease will have subtle phenotypic differences. To determine if OPT autofluorescent imaging could identify such differences, we examined, as an example, sexual dimorphism in wild-type male and female mouse brains that have previously shown differences using both histology (19) and MRI (21). We found statistically significant differences between male and female mouse brain structures consistent with previous reports: the bed nucleus of the stria terminalis (18), striatum (21), and thalamus (21). We also found the globus pallidus, internal capsule, midbrain, stria medullaris, stria terminalis, and zona incerta to be larger in male mice than female mice. Further investigation of these structures will be of interest. For example, Parkinson's disease, which results from degeneration of dopaminergic neurons in the midbrain and involves the basal ganglia, is more prevalent in males than females (22); therefore, further studies into the causes of sexual dimorphism seen in the globus pallidus, midbrain, and zona incerta may have relevance to this disease. The globus pallidus has also been reported to be larger in males than in females in human studies (17). We did not observe volumetric differences in the structure volumes of the amygdala and hypothalamus, which have been previously reported to be sexually dimorphic (2). This may be because only a small portion of these structures differ between males and females, while we assessed the volumes of whole structures only. This is supported by our data in Fig. 6, which shows significant changes in discrete regions of the hypothalamus and amygdala by voxel-wise analysis.
The increase in resolution of the OPT and the unique autofluorescent contrast allow for different structures to be visualized with OPT than with other imaging tools, such as MRI, which is also used regularly in our laboratory. The voxel size of our standard ex vivo MRI images is 56 μm, and the voxel size of the OPT images in our sexual dimorphism study is ∼10 μm. However, we do observe that the variability is increased with OPT due to the more significant sample processing. This needs to be taken into account when undertaking anatomical phenotyping studies. We found that the volume variability in OPT imaging is approximately double that of the variability in fixed brain MRI imaging, where brains can be imaged within the skull and retain their native configuration. To account for the variability in the sample processing, we determined a scale factor for each mouse that was applied to every structure, resulting in a corrected volume measurement. However, in future studies, it would be better to measure the volume of the whole mouse brain, the volume of the portion being imaged prior to sample processing and the volume of the portion being imaged after processing, to better account for sample processing effects separately from biological variability in overall size. We expect this would help to reduce the variability in OPT data. Despite this correction, it is likely that increased variability due to specimen preparation will require an increase in the number of specimens imaged for phenotyping based on optical methods in which extensive sample processing is necessary. Indeed, we found that the cerebellum is a difficult brain structure to image with these methods because the folding of the arbor vita is easily distorted or damaged during processing. This is likely to be less of a problem with optical imaging methods that do not require dehydration and clearing of the brain, such as block-face methods. Nonetheless, 3D optical imaging, including OPT, enables visualization of neuroanatomy with remarkable detail including anatomic nuclei and structural layers, shows potential for systematic phenotyping, and fits conveniently in the workflow of many research laboratories.
Another advantage of optical imaging, in principle, is the possibility of using fluorescent antibodies or proteins to image specific cell types. Antibody-based imaging has been used in the adult mouse brain (3); however, penetration of antibodies is difficult due to the large size. Antibody imaging has been successfully applied to embryo imaging (20, 26) and in lymph node imaging (9). The addition of antibody imaging and/or fluorescent protein imaging will allow the underlying causes of anatomical differences to be probed. This stands to provide tremendous improvements to our ability to characterize brain structure phenotypes and their underlying cellular compositions.
In this study, we have shown that 3D optical imaging methods provide a powerful approach to anatomical phenotyping, allowing adult mouse brain anatomy to be visualized over large ROIs and in fine detail. Taking advantage of this, we were able to examine subtle changes in the adult mouse brain, which is useful for neuroanatomical phenotyping mouse models of human disease. This technique can also be applied to study neurodevelopment and plasticity where changes in the brain can be monitored in cross-sectional studies. Optical imaging will provide new insights into the organization of the mouse brain through the process of development and in circumstances of disease, thereby providing new opportunities in a broad range of research disciplines that impact brain health.
GRANTS
This study was conducted with the support of the Ontario Institute for Cancer Research through funding provided by the Government of Ontario.
DISCLOSURES
No conflicts of interest, financial or otherwise, are declared by the author(s).
AUTHOR CONTRIBUTIONS
Author contributions: J.A.G., M.D.W., J.D., R.M.H., J.P.L., and B.J.N. conception and design of research; J.A.G. and M.A. performed experiments; J.A.G., M.A., J.P.L., and B.J.N. analyzed data; J.A.G. interpreted results of experiments; J.A.G. prepared figures; J.A.G. drafted manuscript; J.A.G., J.P.L., and B.J.N. edited and revised manuscript; J.A.G., J.P.L., and B.J.N. approved final version of manuscript.
REFERENCES
- 1. Chen XJ, Kovacevic N, Lobaugh NJ, Sled JG, Henkelman RM, Henderson JT. Neuroanatomical differences between mouse strains as shown by high-resolution 3D MRI. Neuroimage 29: 99–105, 2006. [DOI] [PubMed] [Google Scholar]
- 2. Cooke B, Hegstrom CD, Villeneuve LS, Breedlove SM. Sexual differentiation of the vertebrate brain: principles and mechanisms. Front Neuroendocrinol 19: 323–362, 1998. [DOI] [PubMed] [Google Scholar]
- 3. Dodt HU, Leischner U, Schierloh A, Jahrling N, Mauch CP, Deininger K, Deussing JM, Eder M, Zieglgansberger W, Becker K. Ultramicroscopy: three-dimensional visualization of neuronal networks in the whole mouse brain. Nat Meth 4: 331–336, 2007. [DOI] [PubMed] [Google Scholar]
- 4. Ellegood J, Lerch JP, Henkelman RM. Brain abnormalities in a Neuroligin3 R451C knockin mouse model associated with autism. Autism Res 4: 368–376, 2011. [DOI] [PubMed] [Google Scholar]
- 5. Ellegood J, Pacey LK, Hampson DR, Lerch JP, Henkelman RM. Anatomical phenotyping in a mouse model of fragile X syndrome with magnetic resonance imaging. Neuroimage 53: 1023–1029, 2010. [DOI] [PubMed] [Google Scholar]
- 6. Erturk A, Mauch CP, Hellal F, Forstner F, Keck T, Becker K, Jahrling N, Steffens H, Richter M, Hubener M, Kramer E, Kirchhoff F, Dodt HU, Bradke F. Three-dimensional imaging of the unsectioned adult spinal cord to assess axon regeneration and glial responses after injury. Nat Med 18: 166–171, 2012. [DOI] [PubMed] [Google Scholar]
- 7. Genovese CR, Lazar NA, Nichols T. Thresholding of statistical maps in functional neuroimaging using the false discovery rate. Neuroimage 15: 870–878, 2002. [DOI] [PubMed] [Google Scholar]
- 8. Hama H, Kurokawa H, Kawano H, Ando R, Shimogori T, Noda H, Fukami K, Sakaue-Sawano A, Miyawaki A. Scale: a chemical approach for fluorescence imaging and reconstruction of transparent mouse brain. Nat Neurosci 14: 1481–1488, 2011. [DOI] [PubMed] [Google Scholar]
- 9. Jahrling N, Becker K, Dodt HU. 3D-reconstruction of blood vessels by ultramicroscopy. Organogenesis 5: 145–148, 2009. [DOI] [PMC free article] [PubMed] [Google Scholar]
- 10. Kovacevic N, Henderson JT, Chan E, Lifshitz N, Bishop J, Evans AC, Henkelman RM, Chen XJ. A three-dimensional MRI atlas of the mouse brain with estimates of the average and variability. Cereb Cortex 15: 639–645, 2005. [DOI] [PubMed] [Google Scholar]
- 11. Leischner U, Schierloh A, Zieglgansberger W, Dodt HU. Formalin-induced fluorescence reveals cell shape and morphology in biological tissue samples. PLoS One 5: e10391, 2010. [DOI] [PMC free article] [PubMed] [Google Scholar]
- 12. Lemmens MA, Steinbusch HW, Rutten BP, Schmitz C. Advanced microscopy techniques for quantitative analysis in neuromorphology and neuropathology research: current status and requirements for the future. J Chem Neuroanat 40: 199–209, 2010. [DOI] [PubMed] [Google Scholar]
- 13. Lerch JP, Carroll JB, Dorr A, Spring S, Evans AC, Hayden MR, Sled JG, Henkelman RM. Cortical thickness measured from MRI in the YAC128 mouse model of Huntington's disease. Neuroimage 41: 243–251, 2008. [DOI] [PubMed] [Google Scholar]
- 14. Nieman BJ, Flenniken AM, Adamson SL, Henkelman RM, Sled JG. Anatomical phenotyping in the brain and skull of a mutant mouse by magnetic resonance imaging and computed tomography. Physiol Genomics 24: 154–162, 2006. [DOI] [PubMed] [Google Scholar]
- 15. Nieman BJ, Lerch JP, Bock NA, Chen XJ, Sled JG, Henkelman RM. Mouse behavioral mutants have neuroimaging abnormalities. Hum Brain Mapp 28: 567–575, 2007. [DOI] [PMC free article] [PubMed] [Google Scholar]
- 16. Ragan T, Kadiri LR, Venkataraju KU, Bahlmann K, Sutin J, Taranda J, Arganda-Carreras I, Kim Y, Seung HS, Osten P. Serial two-photon tomography for automated ex vivo mouse brain imaging. Nat Meth 9: 255–258, 2012. [DOI] [PMC free article] [PubMed] [Google Scholar]
- 17. Rijpkema M, Everaerd D, van der Pol C, Franke B, Tendolkar I, Fernandez G. Normal sexual dimorphism in the human basal ganglia. Hum Brain Mapp 33: 1246–1252, 2012. [DOI] [PMC free article] [PubMed] [Google Scholar]
- 18. Segovia S, Guillamon A. Sexual dimorphism in the vomeronasal pathway and sex differences in reproductive behaviors. Brain Res Brain Res Rev 18: 51–74, 1993. [DOI] [PubMed] [Google Scholar]
- 19. Shah NM, Pisapia DJ, Maniatis S, Mendelsohn MM, Nemes A, Axel R. Visualizing sexual dimorphism in the brain. Neuron 43: 313–319, 2004. [DOI] [PubMed] [Google Scholar]
- 20. Sharpe J, Ahlgren U, Perry P, Hill B, Ross A, Hecksher-Sorensen J, Baldock R, Davidson D. Optical projection tomography as a tool for 3D microscopy and gene expression studies. Science 296: 541–545, 2002. [DOI] [PubMed] [Google Scholar]
- 21. Spring S, Lerch JP, Henkelman RM. Sexual dimorphism revealed in the structure of the mouse brain using three-dimensional magnetic resonance imaging. Neuroimage 35: 1424–1433, 2007. [DOI] [PubMed] [Google Scholar]
- 22. Tanida T, Warita K, Mitsuhashi T, Ishihara K, Yokoyama T, Kitagawa H, Hoshi N. Morphological analyses of sex differences and age-related changes in C3H mouse midbrain. J Vet Med Sci 71: 855–863, 2009. [DOI] [PubMed] [Google Scholar]
- 23. Tomer R, Khairy K, Keller PJ. Shedding light on the system: studying embryonic development with light sheet microscopy. Curr Opin Genet Dev 21: 558–565, 2011. [DOI] [PubMed] [Google Scholar]
- 24. Truong TV, Supatto W, Koos DS, Choi JM, Fraser SE. Deep and fast live imaging with two-photon scanned light-sheet microscopy. Nat Meth 8: 757–760, 2011. [DOI] [PubMed] [Google Scholar]
- 25. Verveer PJ, Swoger J, Pampaloni F, Greger K, Marcello M, Stelzer EH. High-resolution three-dimensional imaging of large specimens with light sheet-based microscopy. Nat Meth 4: 311–313, 2007. [DOI] [PubMed] [Google Scholar]
- 26. Walls JR, Coultas L, Rossant J, Henkelman RM. Three-dimensional analysis of vascular development in the mouse embryo. PLoS One 3: e2853, 2008. [DOI] [PMC free article] [PubMed] [Google Scholar]
- 27. Walls JR, Sled JG, Sharpe J, Henkelman RM. Resolution improvement in emission optical projection tomography. Phys Med Biol 52: 2775–2790, 2007. [DOI] [PubMed] [Google Scholar]
- 28. Weninger WJ, Geyer SH, Mohun TJ, Rasskin-Gutman D, Matsui T, Ribeiro I, Costa Lda F, Izpisua-Belmonte JC, Muller GB. High-resolution episcopic microscopy: a rapid technique for high detailed 3D analysis of gene activity in the context of tissue architecture and morphology. Anat Embryol (Berl) 211: 213–221, 2006. [DOI] [PubMed] [Google Scholar]


