

Baseline retinochoroidal images from the macula to the periphery are presented using a montaging technique of spectral domain optical coherence tomography. The scan length is approximately three times than that provided by conventional posterior scanning and provides novel spectral domain optical coherence tomography images of normal extramacular vitreoretinal and choroidal anatomy.
Key words: montaged images, normal retinochoroidal structure, spectral domain optical coherence tomography
Abstract
Purpose:
To present baseline images of the vitreous, retina, and choroid from the macula to the periphery in normal patients using a novel montaging technique of spectral domain optical coherence tomography.
Methods:
Twenty-six normal eyes of 22 healthy volunteers were enrolled in this study. Montaged images of four radial optical coherence tomography scans through the fovea were obtained from each subject.
Results:
In the macula, there were six identifiable retinal layers as well as four bands in the outer retina. In the periphery, the ganglion cell layer was not identifiable. The external limiting membrane, the second band, and the retinal pigment epithelium were continuously delineated from the macula to the periphery. The third band was not visible in the periphery.
Conclusion:
Spectral domain optical coherence tomography montaged images provide wide-angle images of the vitreous, retina, and choroid, allowing for evaluation of peripheral findings and examination of relationships between peripheral and posterior disease. The maximum scan length achieved here was 36 mm. The scan length is approximately three times than that provided by conventional posterior scanning and is consistent with known dimensions of the eye. This method is achievable with current commercially available devices and may contribute to decision making in clinical practice.
Optical coherence tomography (OCT) provides high-resolution tomographic images of the posterior vitreous, retina, and choroid.1 Evolving developments in spectral domain OCT (SD-OCT) technology have increased the axial resolution, signal/noise ratio, and scan rates leading to dramatic improvements in the visualization of vitreoretinal morphologic features.2–5 As compared with time domain OCT, SD-OCT significantly increases the amount of information acquired in each session and also reduces motion artifact.6 The individual scan lengths in SD-OCT image acquisition is also longer than that of time domain OCT. Historically, application of OCT has been limited to the macular region with the OCT findings of the macula in various diseases now being well defined. At the present time, however, there is little OCT information describing the morphologic features of the vitreous, vitreoretinal interface, retina, and choroid as it extends to the periphery. The implications of such findings in common and uncommon vitreoretinal disease are therefore not known.
Our group has recently reported a novel imaging strategy and method that uses a montage of SD-OCT images of the vitreoretinal interface to examine peripheral findings that may be pertinent to the development and progression of idiopathic macular holes.7 Broader application of these montage imaging techniques to other disease states requires baseline studies in normal patients for comparative purposes. In this study, we have obtained montage images that describe the normal anatomy of the vitreous, retina, and choroid from the macula to the periphery. Also new in this report is demonstration of the feasibility of montaging SD-OCT enhanced depth imaging (EDI) to show detailed images of the choroid beyond the posterior pole. The presentation of these findings and detailed methods for acquiring images further demonstrates the feasibility of clinical application. Further studies using this imaging technique will allow an assessment of the potential and validity of wide-field imaging of the choroid.8,9
Methods
Patients and Study Design
This is a prospective observational case series. Twenty-six eyes of 22 healthy volunteers, 6 eyes of 3 patients with a clinical diagnosis of diabetic retinopathy and 2 eyes of a case with Vogt–Koyanagi–Harada disease were enrolled into this study. The composition of the normal subjects was 15 women and 7 men, ranging in age from 22 years to 75 years (49.7 ± 19.8, mean ± SD). All healthy normal subjects had best-corrected visual acuity of 20/20 or better, refractive error from −1.5 diopters to +1.5 diopters without any fundus diseases, and abnormal intraocular pressure. All investigations adhered to the tenets of the Declaration of Helsinki. This study was approved by the Institutional Review Board of the Saitama Medical University. All subjects received full informed consent before participating in this study. All subjects were examined by indirect ophthalmoscopy, contact lens slit-lamp biomicroscopic examination, fundus photography, and visual acuity testing. Data included identification of the study eye, refraction, best-corrected visual acuity, and the montage of OCT images.
Montage Images of Spectral Domain Optical Coherence Tomography
The OCT examinations were performed using SD-OCT (Spectralis; Heidelberg Engineering, Vista, CA). The OCT images were taken through a dilated pupil by a single trained examiner (J.K.) without previous knowledge of clinical findings. To obtain the wide-angle montaged images from the macula to the periphery, the mid-peripheral fundus was visualized simply by using the planimetric fixation points approximately 15° apart from the central fixation in the superior, inferior, nasal, and temporal directions, and 21° apart in superonasal, superotemporal, inferonasal, and inferotemporal directions (Figure 1). To visualize the far peripheral retina out of the field that can be observed by planimetric fixation points, the SD-OCT device was tilted in conjunction with a corresponding counter fixation of the eye. The montaging of acquired images was then conducted by applying a matching algorithm in picture editing software (Photoshop version 5.5; Adobe, San Jose, CA) according to the manufacture's manual (http://www.adobe.com/uk/aboutadobe/pressroom/pressmaterials/pdfs/photoshop55/ps55revg.pdf#search='photoshop+5.5+manual'). After acquisition of the predetermined OCT images from the macula to the periphery, the conventional posterior single scan image was placed in the central foreground. Then, the mid-peripheral image was rotated to fit the curvature of the retinal surface and the retinal pigment epithelium (RPE) line to the posterior scan image. These images were merged using the landmarks of the large retinal vessels and the major choroidal vascular structures. The peripheral images were then merged to the previously merged posterior to mid-peripheral image using the same alignment techniques. Montages were similarly created from choroidal EDI-OCT scans. The method of obtaining EDI-OCT images has been previously described.7 Standardized horizontal, vertical, and two oblique (superotemporal to inferonasal, superonasal to inferotemporal) vitreoretinal sections through the fovea were routinely collected with two exceptions in which only the horizontal scans were acquired.
Fig. 1.

Mid-peripheral (A–D and F–I) and central (E) scans of OCT visualized simply by using the planimetric fixation points approximately 15° apart from the central fixation in the superior (B), inferior (H), nasal (D), temporal (F) directions, and 21° apart in superonasal (A), superotemporal (C), inferonasal (G), and inferotemporal (I) directions. These images were simply merged in accordance with the following landmarks: larger retinal vessels and major choroidal vascular patterns; curvature of the retinal surface and pigment patterning created by the RPE.
The total scan length of montage images in normal subjects was determined by using the combined OCT scan lengths of the scans used to create the montage image. To measure the total scan length of montage images, the scan length of each scan used in the montage was first calibrated using the planimetric software in the instrument. The measurements were summed as the total scan length for each individual. The full scan length was compared with the scan length of the posterior single scan, and the mean ratios between these scans were calculated.
The morphology of the macula and peripheral retina was precisely observed using side-by-side positioning of the images at retinal regions 0, 1, 3, 6, 9, 12 mm from the foveola in the superior, inferior, nasal, and temporal directions. The range of the discernible third band was similarly measured. The range of distances where the third band was detectable was statistically compared in the four scan directions (superior, inferior, nasal, and temporal) with a Bonferroni correction applied. The observable third band range was then evaluated for association with age, using a Spearman rank correlation.
Results
Montaged Images of Normal Retina
In all 26 normal eyes, montaged OCT images delineated the vitreoretinal interface, retina, and choroid from the macula to the periphery. Perifoveal retina was the thickest region of the retina. The entire retinochoroidal images possessed a smooth and continuous curvature. The thickness of the retina and choroid decreased toward the periphery (Figure 2). A highly magnified retinal structure was precisely observed using a side-by-side arrangement of OCT images at various distances from the foveola (Figure 3). In the macular region, there were six clearly distinguishable retinal layers: the nerve fiber layer, ganglion cell layer, inner plexiform layer, inner nuclear layer, outer plexiform layer, and outer nuclear layer. There are four distinguishable bands in the outer retina: external limiting membrane (ELM, the first innermost band), the second innermost band (second band), the third innermost band (third band), and the RPE (the fourth outermost band). Each layer narrowed as the scans became increasingly peripheral. In the peripheral retina as well as in the macula, most layers were visible, the exception being the absence of a discernable ganglion cell layer in the periphery. The ganglion cell layer was thickest in the perifoveal region (1 mm from the foveola) as compared with the other 5 regions examined (0, 3, 6, 9, and 12 mm from the foveola). The ganglion cell layer remained delineated in the macular region at 3 mm in most cases (in 100% of superior, 96% of inferior, and 92% of nasal and temporal directions), but became indistinguishable from nerve fiber layer and inner plexiform layer in the regions beyond 3 mm, with 1 exception in each of the superior and the nasal scans (Figure 3, Table 1). The nerve fiber layer was also less visible in the periphery especially in the temporal scan.
Fig. 2.

Montage images of infrared fundus photographs (A and C) and OCT scans (B and D) in a normal subject. A long transverse line (arrows) in A and a long longitudinal line (arrows) in (C) correspond to the scanning line for the horizontal (B) and vertical (D) cross-sections, respectively. Insets in (A) and (B) indicate the posterior single scan. Both retinal and choroidal thicknesses decrease toward the periphery.
Fig. 3.
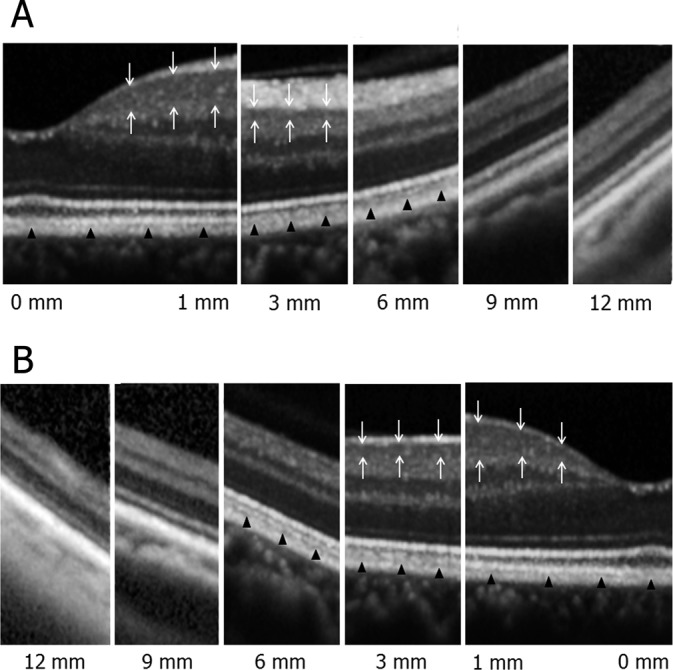
Highly magnified images of the normal retina from the macula to the periphery in nasal (A) and temporal (B) directions. In the macular region, there were six retinal layers and four bands in the outer retina that were distinguishable. Each layer became thinner as the scans became increasingly peripheral. In the peripheral retina as well as in the macula, most layers but the ganglion cell layer were visible. The ganglion cell layer (white arrows) was delineated in the macular region at 3 mm from the foveola but became undistinguishable from nerve fiber layer and inner plexiform layer in regions further than 3 mm eccentric from the fovea. The ELM, the second band, and the RPE were continuously delineated from the macula to the periphery, but the third band (black arrowheads) became indiscernible in the periphery.
Table 1.
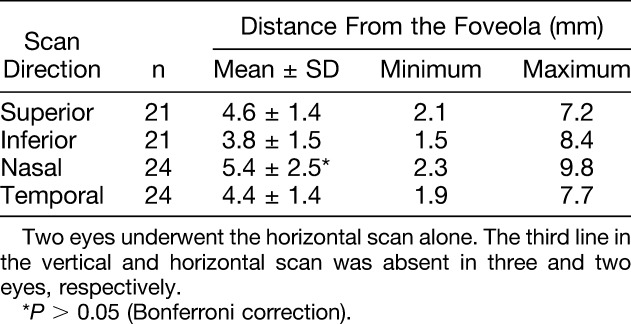
The Discernable Ganglion Cell Layer and the Third Band

The ELM, the second band, and the RPE were continuously delineated from the macula to the periphery, but the third band was not discernible in the periphery. There was variation among normal subjects at which the third band became undetectable (Tables 1 and 2). There was also variation in the observable third band in accordance with scan direction. The third band remained discernable in the nasal direction for the longest mean range (5.4 ± 2.5 mm, mean ± SD), followed by the superior, temporal, and inferior directions, but these differences did not reach statistical significance (Table 2). There was no significant correlation between age and the range in which the third band was observable.
Table 2.
The Extent of the Observable Third Band
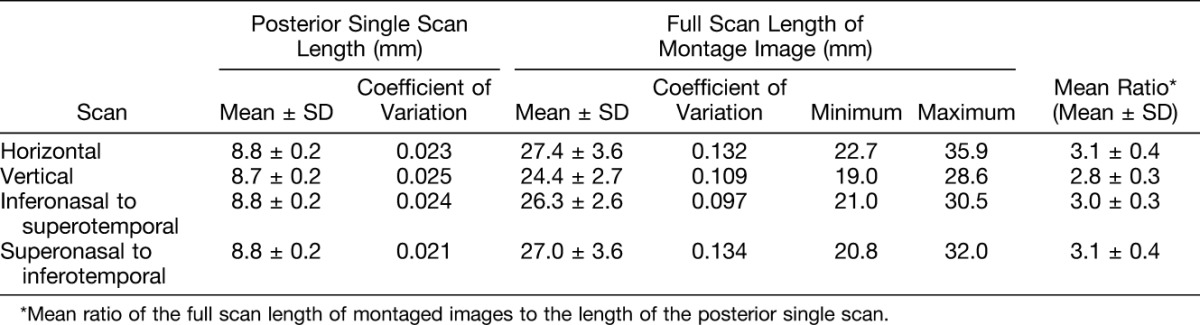
The mean scan length of the posterior single scan was between 8.7 mm and 8.8 mm averaged over all scans. The coefficient of variation was 0.025 or less. The full scan length of montaged images had variation that depended in part on the subject's fixation, orientation, and ability to cooperate. The coefficient of variation ranged from 0.073 to 0.099. The maximum scan length achieved was 35.9 mm from the horizontal scan and the minimum was 19.0 mm from the vertical scan. The mean full scan length of montaged images ranged from 24.4 mm to 27.4 mm among all scan directions. The mean ratio of the full scan length to the posterior single scan length was approximately 3 (Table 3).
Table 3.
Scan Length of the Posterior Single and Montage Images
Montaged Images of Normal Choroid
The EDI-OCT images obtained from normal volunteers were montaged to create wide-angle cross-sectional images of the choroid. The full-thickness choroidal images clearly displayed classic morphologic features from the macula to the periphery. The RPE–Bruch membrane interface had a smooth and continuous curvature. The posterior border of the choroid was also clearly delineated, and the choroidal thickness was noted to decrease toward the periphery (Figure 4).
Fig. 4.

Montages images of horizontal (A and B) and vertical (C and D) vitreous-retina-choroid cross-sectional images in a normal subject. Images of (A and C) were obtained from conventional OCT scans. Images of (B and D) were from the use of EDI technique. Choroidal cross-sectional images clearly depict anatomy from the macula to the periphery (B and D). In the more peripheral scans, the curvature of the eye appears diminished because of typical peripheral optical aberration (C).
Diabetic Retinopathy
To demonstrate that pathology as well as normal anatomy is evident in peripheral scans, montaged OCT images were obtained from 6 eyes of 3 patients with diabetic retinopathy aged 41, 64, and 72 years (1 female and 2 males). In one case, we were able to demonstrate clear images of a traction retinal detachment located near the superior equator as well as in the inferonasal mid-periphery. There was no difficulty capturing and presenting either of these findings using montaged OCT images. For the purposes of this study, there is therefore direct evidence that the montaging technique is capable of differentiating fundus lesions located near the equator from normal retina, that the lesions can be delineated by the OCT image, and that such lesions would not be detected by conventional OCT imaging procedures (Figure 5).
Fig. 5.

Montage images of fundus photographs (A) and OCT scans (B and C) in an eye with tractional retinal detachment in proliferative diabetic retinopathy. Long transverse and longitudinal arrows in (A) indicate the scanning lines for horizontal (B) and vertical (C) OCT images, respectively. Arrowheads in (C) indicate the OCT image of tractional retinal detachments at the superior equator and inferonasal mid-periphery. Discontinuity of the montaged scan in (C) is because of optical shadowing caused by the fibrovascular proliferation and not the montage technique.
Vogt–Koyanagi–Harada Disease
To test the potential utility of montaged imaging of EDI-OCT scans in delineating choroidal pathology from the macula to the periphery, montaged EDI-OCT images were created from both the eyes of a 51-year-old female with acute active Vogt–Koyanagi–Harada disease. Both eyes demonstrated significant thickening of the choroid as well as suprachoroidal exudative fluid accumulation from the macula to the periphery. Montaged images of EDI-OCT clearly delineated an overview of undulations and bumps on the RPE surface as well as irregular thickening of the choroid. Although serous retinal detachment was located in the macula, choroidal pathology was not limited to the macula (Figure 6).
Fig. 6.

Fundus photograph (A), a late phase (10 minutes and 55 seconds) image of fluorescein angiography (B), and montaged images of horizontal (C) and vertical (D) EDI-OCT scans in the right eye with acute Vogt–Koyanagi–Harada disease. Dramatic choroidal thickening in the area of macular serous retinal detachment obscures the chorioscleral boundary (asterisk in C and D). Choroidal thickening is also noted in the periphery in the absence of overlying retinal edema. The wide dark zone, possibly indicating exudative fluid accumulation, is delineated in the suprachoroidal space in the temporal periphery (arrows in C). A notable finding is the undulations and bumps on the RPE surface associated with the irregular thickening of the choroid when compared with a normal choroidal configuration in Figure 4. The multiple small undulations (or folds) of the RPE surface are evident in the vertical scan (D) and correspond to the horizontal folds seen in the fundus photograph (black arrows in A). Although serous retinal detachment is clearly located in the macula, choroidal pathology is also evident in the periphery.
Discussion
In this study, we present montaged SD-OCT images that extend from the macula to the periphery in patients without clinically evident vitreoretinal disease. EDI-SD-OCT images of normal patients are also presented. In clinically normal patients, the macular region contained six clearly distinguishable retinal layers with four bands in the outer retina. Each layer became progressively thinner as the imaging became increasingly remote from the macula. In the peripheral retina, the ganglion cell layer was no longer clearly distinguishable from the nerve fiber layer and the inner plexiform layer. Histologically, the peripheral limit of the macula (approximately 3 mm from the foveola) occurs where the ganglion cells are reduced to a single layer. The ganglion cells become discontinuous in the mid-peripheral retina, 4.5 mm to 7.5 mm from the foveola. The far periphery is 9 mm to 10 mm from the foveola on the temporal side, where the ganglion cells are spaced even more widely.10 The ganglion cell layer has a maximum thickness at 0.8 mm to 1.0 mm of eccentricity (60–70 μm) and decreases from 13.8 μm to 19.6 μm at 3 mm eccentricity.11 Since the theoretical axial resolution of the Spectralis SD-OCT device is 7 μm,12 our observations and image measurement as they relate to the range of eccentricity in which the ganglion cell layer is detectable within the macular region is in good agreement with both known ocular anatomy and the resolution of the current OCT device. In addition, the nerve fiber layer was also less visible in the periphery. This was most notable in the temporal scan because of asymmetric distribution on the horizontal axis.10,13
The ELM, the second band, and the RPE were continuously delineated from the macula to the periphery, whereas the third band visible in the macula became indiscernible in the periphery along with the ganglion cell layer. As compared with the ganglion cell layer, there was more individual variation in the range of eccentricity at which the third band was detectable. The mean range over which the third band was observable also varied in accordance with scan direction; the range over which the third band was detectable appeared greatest in the nasal scans but when compared quantitatively, there was no statistically significant difference in this group of 26 patients.
The third band has been commonly referred to as Verhoeff membrane representing cone outer segment tips.14,15 Anatomically what Verhoeff described is currently known as junctional complexes between RPE cells. Logically, a reflective band that is separated from the RPE layer is not consistent with being the Verhoeff membrane.16,17 Recently, Spaide and Curcio indicated that the third band corresponds to an ensheathment of the cone outer segments by apical processes of RPE in a structure known as the contact cylinder. This conclusion was based on a detailed analysis of images and a comprehensive review of the literature.18 At this time, it remains to be determined whether the third band refers to cone outer segment tips or the contact cylinder of cone outer segments.18 There is consensus in both works, however, that the extent of the third band corresponds to the distribution of cones. Anatomically, the average human retina contains 4.6 million cones with the variation of 4.08 to 5.29 million. Peak foveal cone density is also highly variable between individuals (100,000–324,000 cones/mm2). Cone density falls off steeply with increasing eccentricity and superimposed on this gradient is a streak of high cone density along the horizontal meridian. At equivalent eccentricities, cone density is 40% to 45% higher in the nasal as compared with the temporal retina.19 Our OCT observations here, indicating interindividual and scan direction variability in the observable third band distribution, are not therefore in conflict with the known, histologically demonstrated cone density distribution.
While the conventional posterior scan length is less than 9 mm, the minimum, mean, and maximum full scan lengths of the montaged images were approximately 19, 24 to 27, and 36 mm, respectively. The mean ratio of the full scan length of montage images to the posterior single scan length was approximately 3. Due in part to the process of montaging, the full montaged image had a small increase in variability of the signal as compared with the single posterior scan. Variability also depended on the examiner's skill and the subject's fixation, orientation, and ability to cooperate. With each of these potential sources of variability considered, the montaged OCT image was of more than sufficient quality to allow delineation of relevant anatomy from the macular region to the equator in all normal cases examined. In a diabetic case with traction retinal detachments located at the equator, the montaged OCT images effectively delineated the pathology. This represents proof of principle for the potential utility of this technique applied to the examination of pathologic fundus lesions occurring outside of the macula.
Additionally, we have successfully created montaged images of EDI-OCT that allow wide-angle full-thickness images of the choroid to be constructed. In normal subjects, the RPE–Bruch membrane appeared as a smooth and continuous signal and the posterior border of the choroid was clearly delineated in all subjects. In a case with acute Vogt–Koyanagi–Harada disease, montaged images of EDI-OCT clearly delineated an overview of undulations and bumps on the RPE surface with irregular thickening of the choroid. Although serous retinal detachment was located in the macula, choroidal pathology was not limited to the macula when the periphery was examined. With normal anatomy now able to be clearly delineated, imaging of patients with pathology of the choroid is a logical next step in future studies.
A present limitation of this technique is that it is labor intensive. This may or may not hinder widespread application of the technique in its present form. Work to automate the montaging algorithm for OCT data sets has recently been presented for nine cases of X-linked retinoschisis and continues.20,21 An alternative approach has been the development of a swept source OCT device with 12 × 12 mm raster scans.22,23 These emerging methodologies are promising and serve as further evidence of the advancing interest in detailed morphologic study of extramacular pathology. Another limitation of this technique is distortion of the far peripheral images. Macular scan images are rarely flattened, but in the more peripheral scans the curvature of the eye tends to be lost and the scans occasionally appear to be angled straight lines (Figure 4C). Quantitative or comparative analyses of peripheral images must therefore adjust for this and other optically predictable phenomena.
The present montaging technique has several advantages; the first of which is that it can be obtained with current commercially available devices that may be in place in many practices. A second advantage is that it is capable of providing images that are approximately 36 mm wide at the maximum. This is substantially wider than the current generation swept source OCT with a scan length of 12 mm. As posterior OCT examination techniques have added substantially to our understanding of macular disease, it is reasonable to predict that SD-OCT montaging techniques or wide-field swept source OCT techniques will provide diagnostic, therapeutic, and anatomical insights into peripheral diseases, of the vitreous, retina, and choroid. This observation is supported by our group and the work of others.7,21,24,25
In conclusion, SD-OCT montaged images provide wide-angle cross-sectional images of the vitreous, retina, and choroid with a mean scan length of 24 mm to 27 mm. The information provided is approximately three times greater than that provided by conventional posterior scanning techniques available at this time. The morphologic observations resulting from this scanning technique have produced findings that are in good agreement with known ocular anatomy. This method is simple, cost-effective, and achievable with commercially available devices. It allows for the evaluation of peripheral vitreoretinal and choroidal findings and begins to establish their relationship to peripheral and posterior disease.
Footnotes
Supported in part by NIH, RO1 EY021540 to 01A1, Research to Prevent Blindness, The J. Willard and Alice S. Marriott Foundation, The Gale Trust, The Ehler's Family Foundation; generous gifts from Mr. Bill Wilbur, and Paul and Mary Ellen Keck (P.L.G.); and a grant-in-aid for scientific research (24592641) from the Ministry of Education, Culture and Science in Japan (K.M.).
None of the authors have any conflicting interests to disclose.
References
- 1.Huang D, Swanson EA, Lin CP, et al. Optical coherence tomography. Science 1991;254:1178–1181. [DOI] [PMC free article] [PubMed] [Google Scholar]
- 2.Drexler W, Sattmann H, Hermann B, et al. Enhanced visualization of macular pathology with the use of ultrahigh-resolution optical coherence tomography. Arch Ophthalmol 2003;121:695–706. [DOI] [PubMed] [Google Scholar]
- 3.Nassif N, Cense B, Park B, et al. In vivo high-resolution video-rate spectral-domain optical coherence tomography of the human retina and optic nerve. Opt Express 2004;12:367–376. [DOI] [PubMed] [Google Scholar]
- 4.Wojtkowski M, Srinivasan V, Ko T, et al. Ultrahigh-resolution, high-speed, Fourier domain optical coherence tomography and methods for dispersion compensation. Opt Express 2004;12:2404–2422. [DOI] [PubMed] [Google Scholar]
- 5.Hangai M, Ojima Y, Gotoh N, et al. Three-dimensional imaging of macular holes with high-speed optical coherence tomography. Ophthalmology 2007;114:763–773. [DOI] [PubMed] [Google Scholar]
- 6.Mirza RG, Johnson MW, Jampol LM. Optical coherence tomography use in evaluation of the vitreoretinal interface: a review. Surv Ophthalmol 2007;52:397–421. [DOI] [PubMed] [Google Scholar]
- 7.Mori K, Kanno J, Gehlbach PL, Yoneya S. Montage images of spectral-domain optical coherence tomography in eyes with idiopathic macular holes. Ophthalmology 2012;119:2600–2608. [DOI] [PubMed] [Google Scholar]
- 8.Spaide RF, Koizumi H, Pozzoni MC. Enhanced depth imaging spectral-domain optical coherence tomography. Am J Ophthalmol 2008;146:496–500. [DOI] [PubMed] [Google Scholar]
- 9.Margolis R, Spaide RF. A pilot study of enhanced depth imaging optical coherence tomography of the choroid in normal eyes. Am J Ophthalmol 2009;147:811–815. [DOI] [PubMed] [Google Scholar]
- 10.Hogan MJ, Alvarado JA, Weddell JE. Histology of the Human Eye. An Atlas and Textbook. Philadelphia, PA: WB Saunders; 1971. [Google Scholar]
- 11.Curcio CA, Messinger JD, Sloan KR, et al. Human chorioretinal layer thicknesses measured in macula-wide, high-resolution histologic sections. Invest Ophthalmol Vis Sci 2011;52:3943–3954. [DOI] [PMC free article] [PubMed] [Google Scholar]
- 12.Kiernan DF, Mieler WF, Hariprasad SM. Spectral-domain optical coherence tomography: a comparison of modern high-resolution retinal imaging systems. Am J Ophthalmol 2010;149:18–31. [DOI] [PubMed] [Google Scholar]
- 13.Ooto S, Hangai M, Tomidokoro A, et al. Effects of age, sex, and axial length on the three-dimensional profile of normal macular layer structures. Invest Ophthalmol Vis Sci 2011;52:8769–8779. [DOI] [PubMed] [Google Scholar]
- 14.Zawadzki RJ, Jones SM, Olivier SS, et al. Adaptive-optics optical coherence tomography for high-resolution and high-speed 3D retinal in vivo imaging. Opt Express 2005;13:8532–8546. [DOI] [PMC free article] [PubMed] [Google Scholar]
- 15.Srinivasan VJ, Monson BK, Wojtkowski M, et al. Characterization of outer retinal morphology with high-speed, ultrahigh-resolution optical coherence tomography. Invest Ophthalmol Vis Sci 2008;49:1571–1579. [DOI] [PMC free article] [PubMed] [Google Scholar]
- 16.Wolff E. The external limiting membrane of the retina and its relation to Verhoeff's membrane. Trans Ophthalmol Soc U K 1950;60:61–67. [Google Scholar]
- 17.Bron AJ, Tripathi RC, Tripathi BJ. Wolff's Anatomy of the Eye and Orbit. 8th ed London, United Kingdom: Chapman & Hill; 1997:460–464. [Google Scholar]
- 18.Spaide RF, Curcio CA. Anatomical correlates to the bands seen in the outer retina by optical coherence tomography: literature review and model. Retina 2011;31:1609–1619. [DOI] [PMC free article] [PubMed] [Google Scholar]
- 19.Curcio CA, Sloan KR, Kalina RE, Hendrickson AE. Human photoreceptor topography. J Comp Neurol 1990;292:497–523. [DOI] [PubMed] [Google Scholar]
- 20.Li Y, Gregori G, Lam BL, Rosenfeld PJ. Automatic montage of SD-OCT data sets. Opt Express 2011;19:26239–26248. [DOI] [PMC free article] [PubMed] [Google Scholar]
- 21.Gregori NZ, Lam BL, Gregori G, et al. Wide-field spectral-domain optical coherence tomography in patients and carriers of X-linked retinoschisis. Ophthalmology 2013;120:169–174. [DOI] [PMC free article] [PubMed] [Google Scholar]
- 22.Potsaid B, Baumann B, Huang D, et al. Ultrahigh speed 1050nm swept source/Fourier domain OCT retinal and anterior segment imaging at 100,000 to 400,000 axial scans per second. Opt Express 2010;18:20029–20048. [DOI] [PMC free article] [PubMed] [Google Scholar]
- 23.Klein T, Wieser W, Eigenwillig CM, et al. Megahertz OCT for ultrawide-field retinal imaging with a 1050nm Fourier domain mode-locked laser. Opt Express 2011;19:3044–3062. [DOI] [PubMed] [Google Scholar]
- 24.Choi W, Mohler KJ, Potsaid B, et al. Choriocapillaris and choroidal microvasculature imaging with ultrahigh speed OCT angiography. PLoS One 2013;8:e81499. [DOI] [PMC free article] [PubMed] [Google Scholar]
- 25.Liu JJ, Witkin AJ, Adhi M, et al. Enhanced vitreous imaging in healthy eyes using swept source optical coherence tomography. PLoS One 2014;9:e102950. [DOI] [PMC free article] [PubMed] [Google Scholar]