

Abstract
Objectives
The aim of this study was to evaluate Gd retention in the deep cerebellar nuclei (DCN) of linear gadolinium-based contrast agents (GBCAs) compared with a macrocyclic contrast agent.
Materials and Methods
The brain tissue retention of Gd of 3 linear GBCAs (gadobenate dimeglumine, gadopentetate dimeglumine, and gadodiamide) and a macrocyclic GBCA (gadoterate meglumine) was compared in healthy rats (n = 8 per group) that received 20 intravenous injections of 0.6 mmol Gd/kg (4 injections per week for 5 weeks). An additional control group with saline was included. T1-weighted magnetic resonance imaging was performed before injection and once a week during the 5 weeks of injections and for another 4 additional weeks after contrast period. Total gadolinium concentration was measured with inductively coupled plasma mass spectrometry. Blinded qualitative and quantitative evaluations of the T1 signal intensity in DCN were performed, as well as a statistical analysis on quantitative data.
Results
At completion of the injection period, all the linear contrast agents (gadobenate dimeglumine, gadopentetate dimeglumine, and gadodiamide) induced a significant increase in signal intensity in DCN, unlike the macrocyclic GBCA (gadoterate meglumine) or saline. The T1 hypersignal enhancement kinetic was fast for gadodiamide. Total Gd concentrations for the 3 linear GBCAs groups at week 10 were significantly higher in the cerebellum (1.21 ± 0.48, 1.67 ± 0.17, and 3.75 ± 0.18 nmol/g for gadobenate dimeglumine, gadopentetate dimeglumine, and gadodiamide, respectively) than with the gadoterate meglumine (0.27 ± 0.16 nmol/g, P < 0.05) and saline (0.09 ± 0.12 nmol/g, P < 0.05). No significant difference was observed between the macrocyclic agent and saline.
Conclusions
Repeated administrations of the linear GBCAs gadodiamide, gadobenate dimeglumine, and gadopentetate dimeglumine to healthy rats were associated with progressive and significant T1 signal hyperintensity in the DCN, along with Gd deposition in the cerebellum. This is in contrast with the macrocyclic GBCA gadoterate meglumine for which no effect was observed.
Key Words: dentate nucleus, deep cerebellar nuclei, magnetic resonance, cumulative doses, gadolinium contrast agent, gadoterate meglumine, gadodiamide, gadobenate dimeglumine, gadopentetate dimeglumine
T1 hypersignal associated with cumulated administration of some but not all gadolinium-based contrast agents or GBCAs has been reported in numerous retrospective clinical studies since the seminal article by Kanda et al in 2014.1–15 It is now widely recognized that the T1 hypersignal observed in the dentate nucleus and globus pallidus after repeated administration of some GBCAs is associated with Gd accumulation in these areas.3,6 It has been suggested that the molecular structure of the GBCA may play a role in brain retention.5,9,15–19 Studies in rodents,20,21 human serum,22 and bone specimens23 are consistent with gradual linear GBCA dissociation in decreasing order according to chelate stability. Macrocyclic chelates are more stable than ionic linear chelates, which are more stable than nonionic linear chelates. Stojanov et al12 recently reported on 56 patients with a significant increase in the signal intensity ratios for globus pallidus/thalamus and dentate nucleus/pons after multiple administrations of the macrocyclic GBCA gadobutrol. However, this study has methodological limitations12,24,25 and was not confirmed by a recent study performed in 30 patients (no T1 signal increases in the dentate nucleus or in the globus pallidus after serial administrations of gadobutrol).15 As in the case of nephrogenic systemic fibrosis, the hypothesis of a relationship between the molecular structure and the effect is emerging,18,19 and requires in-depth studies.
In a recent nonclinical study,16,26 healthy rats received 20 intravenous injections of 0.6 mmol of gadolinium (Gd) per kilogram (ie, a cumulated dose of 12 mmol Gd/kg over 5 weeks) of gadodiamide (Omniscan), gadoterate meglumine (Dotarem), or hyperosmolar saline (control group, iso-osmolar to the gadoterate solution). Brain T1-weighted magnetic resonance imaging (MRI) was performed before and once a week during the 5 weeks of injections and for 5 additional weeks (treatment-free period). In this study, significant and persistent T1 signal hyperintensity in deep cerebellar nuclei (DCN) was observed only in gadodiamide-treated rats. In addition, while no Gd was found in the plasma of rats at completion of the treatment-free period, the total Gd concentration was significantly higher (in the cerebral cortex, subcortical brain, and cerebellum) in gadodiamide-treated rats than gadoterate-treated rats (where only traces of Gd were found). McDonald et al6 reported that, in the globus pallidus, thalamus, dentate nucleus, and pons of autopsy specimens, a cumulated gadodiamide dose correlated with (a) total Gd concentration and (b) the percentage of change in the precontrast T1 signal. Kanda et al3 found total Gd in brain tissues (obtained at autopsy) of 5 subjects who received a linear GBCA (+ gadoteridol in two cases).3 The concentration of total Gd was higher in the dentate nucleus and globus pallidus (ie, regions associated with T1 hypersignal) than that in other brain regions. Taken together, these results are consistent with the accumulation of Gd in selected brain areas, which are associated with T1-weighted hypersignal both in patients and in rats.
The study of the various molecular categories of GBCAs,20,27,28 including variable not necessary stabilities (kinetic and thermodynamic) and systemic biodistribution (protein binding and/or hepatic uptake) in rigorous and similar experimental conditions, is a crucial prerequisite for further mechanistic investigations of GBCA-induced T1 hypersignal. The aim of the present study was therefore to compare the effect of 2 linear and ionic GBCAs, gadopentetate dimeglumine (Magnevist®) and gadobenate dimeglumine (MultiHance®) (the latter being characterized by a weak binding to proteins28), the linear and nonionic GBCA gadodiamide (Omniscan®), and the ionic and macrocyclic GBCA gadoterate meglumine (Dotarem®) on the T1 signal in DCN (including the dentate nucleus) of rats.
MATERIALS AND METHODS
The method applied was previously described by Robert et al,26 with additional quantitative R1 mapping. All animal experiments were conducted in accordance with French regulations and in compliance with the European Union Directive 2010/63/EU. The studies were performed in the Guerbet research laboratories by Guerbet employees except for the qualitative MRI scan analysis, which was performed by 2 certified neuroradiologists (S.L., S.G.). Statistical analysis was performed by Soladis (Lyon, France). All experiments (injections, MRI, image analysis, and dosage) were conducted blindly. Group allocation of animals was randomized.
Animal Model and Contrast Agents Injection Protocols
All injections were performed under general anesthesia (3%–3.5% isoflurane; IsoFlo, Axience, Pantin, France). Healthy female Sprague Dawley rats (SPF/OFA female rats from Charles River, L'Arbresle, France), weighing 227.7 ± 17.8 g at the beginning of the study, received 20 intravenous injections of 0.6 mmol Gd/kg (1.2 mL/kg) over a period of 5 weeks (4 daily and sequential injections per week). The daily dose of 0.6 mmol Gd/kg is equivalent to the usual human dose of GBCA (0.1 mmol Gd/kg) after adjusting for body surface area as recommended by the Food and Drug Administration.29 For the comparison of the contrast agents with the reference injection protocol (Fig. 1A), 5 groups (8 rats per group) were used: gadodiamide (linear and nonionic GBCA, Omniscan, 500 mM; GE Healthcare, Chalfont St Giles, United Kingdom, batch 12538837), gadopentetate dimeglumine (linear and ionic GBCA, Magnevist, 500 mM; Bayer Healthcare (linear and ionic GBCA, Magnevist, 500 mM; Bayer Healthcare, Berlin, Germany, batches 33150F and 32553C), gadobenate dimeglumine (linear and ionic GBCA, MultiHance, 500 mM; Bracco Imaging, Milan, Italy, batch S4P267B), gadoterate meglumine (macrocyclic and ionic GBCA, Dotarem; 500 mM, Guerbet, Roissy CDG, France, batch 14GD057A), and saline as a control group (300 mOsm/kg H2O). A behavioral examination was performed daily. In addition, 2 simplified gadodiamide injection protocols were evaluated with n = 4 rats per group: 2 injections of 1.2 mmol of Gd per kilogram per week were performed for 5 weeks (Fig. 1B) and 1 injection of 2.4 mmol of Gd per kilogram of bodyweight per week was performed for 5 weeks (Fig. 1C).
FIGURE 1.
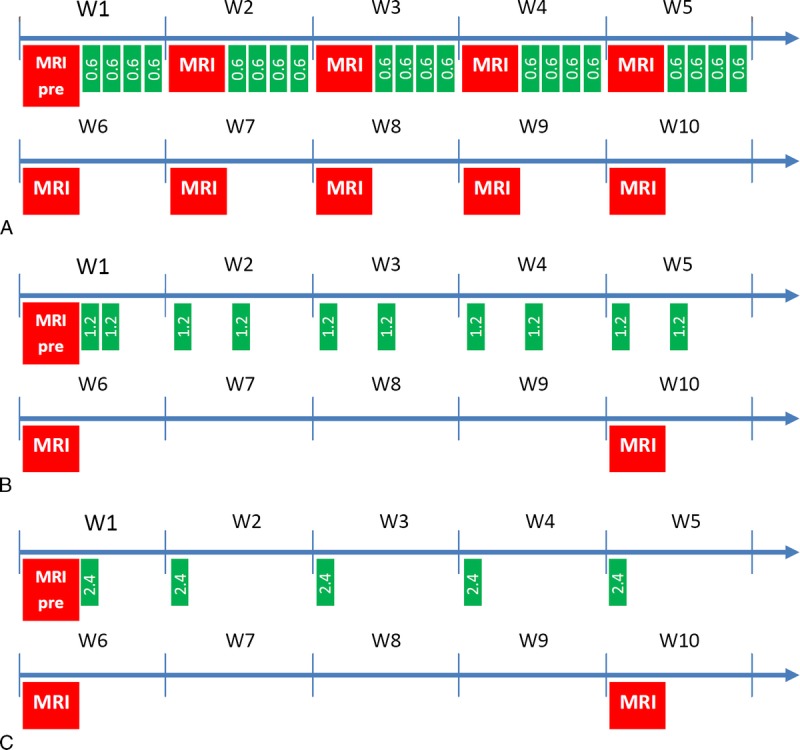
Injection and MRI schemes. A, Comparative study with 5 groups of n = 8 rats and 4 injections of 0.6 mmol of Gd per kilogram per week over a period of 5 weeks. B and C, Simplified injection protocols (n = 4 gadodiamide-treated rats/group): 2 injections of 1.2 mmol of Gd per kilogram per week for 5 weeks (B) and 1 injection of 2.4 mmol of Gd per kilogram per week for 5 weeks (C).
MRI Protocol
T1-weighted MRI was performed under general anesthesia (3%–3.5% isoflurane) before the first GBCA administration and once a week during the treatment period (ie, after the fourth, eighth, 12th, 16th, and 20th injections) and for an additional 4-week treatment-free period (Fig. 1). During the administration period, MRI examination was performed 3 days after the last administration, corresponding to a minimal 72-hour clearance period. Magnetic resonance imaging was performed with a dedicated quadrature brain coil (RAPID Biomedical GmbH, Rimpar, Germany) on a 2.35-T preclinical magnet (BioSpec 24/40; Bruker, Ettlingen, Germany) using a T1-weighted multi spin echo RARE sequence: TR/TE = 525 ms/10 ms; 36 averages; in-plane resolution, 156 × 156 μm2; slice thickness, 800 μm; acquisition time, 15 minutes 8 seconds. The scan range of the MRI sequence covered the cerebellum only (10 slices).
R1 mapping on the slice containing the DCN was added during the final MRI examination. Spin echo imaging TR/TE = 2000 ms/57.2 ms; TI = 0, 200, 400, 700, 1000, 2000 ms; 3 averages; in-plane resolution, 153 × 195 μm2; slice thickness, 1000 μm; multi spin echo RARE factor 8.
After the final MRI examination, all animals were killed by exsanguination under anesthesia, and the brains were harvested to determine total gadolinium.
Image Analysis
All image analysis was performed under blinded and randomized conditions. Qualitative and quantitative evaluations of DCN T1 signal intensity were performed.
Qualitative Analysis
Randomized qualitative evaluation of DCN enhancement was performed by 2 independent and board-certified neuroradiologists (S.L. and S.G.) with no conflict of interest. Readers were blinded to both the group and the time points. Variable window and level settings were used when reviewing MRI scans. A 3-point scoring scale of DCN relative to adjacent cerebellar cortex high signal intensity was applied: score = 0 for no detectable signal enhancement, score = 1 for doubtful enhancement, and score = 2 for definite enhancement. The mean score per group was then plotted for each reader.
Quantitative Analysis
Randomized quantitative evaluation of the signal was performed by positioning a region of interest over the more visible of the 2 DCN zones and over a reference zone in the adjacent cerebellar cortex (Fig. 2). Region of interest positioning was performed blindly for the groups and time points. The signal intensity ratio was calculated as the ratio of the max DCN signal to the cerebellar cortex signal: DCN/cerebellar cortex ratio.
FIGURE 2.
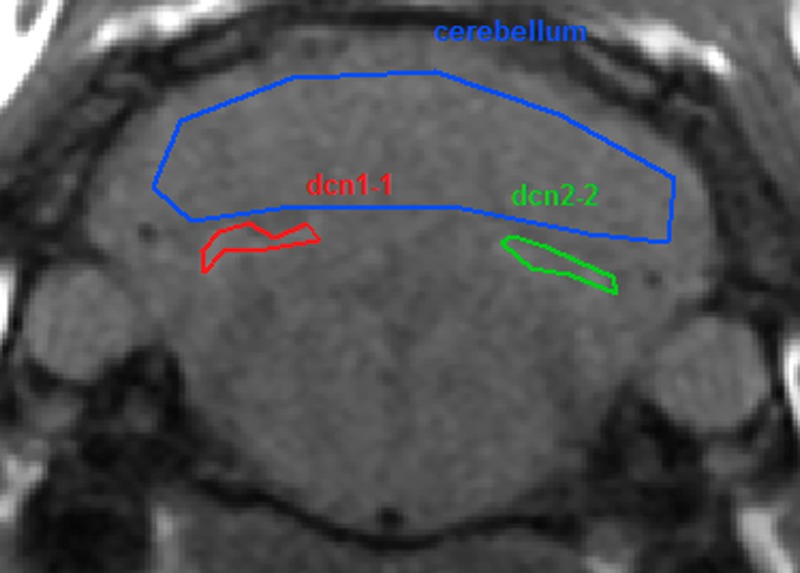
Region of interest positioning.
R1 Mapping
R1 mapping was calculated on a pixel-by-pixel basis with a homemade software coded in MATLAB (The Mathworks Inc. Natick, MA, USA) with the following formula: Mz(TI) = Mz,eq (1 – 2.e-TI/T1).
Determination of Brain and Plasma Total Gadolinium Concentrations
Rats were euthanized under isoflurane anesthesia by exsanguination at the end of the treatment-free period. All the rat brains were removed and dissected to sample cerebellum and blood. Total Gd concentrations were measured in biological samples with inductively coupled plasma mass spectrometry (7700x, Agilent Technologies, Santa Clara, CA) after mineralization in 65% nitric acid at 80°C for 8 hours followed by dilution in water. A standard curve of inorganic Gd (0.05–100 μg/L) in 6.5% HNO3 was used by monitoring the response of the 158Gd isotope. The lower limit of quantification with our inductively coupled plasma mass spectrometry instrument is 0.32 nmol/L in HNO3 matrix, that is, 0.02 nmol/g for the cerebellum and 0.02 nmol/mL for plasma after taking into account the sample preparation. The acceptance limits (total error) were set at ±14%. Results are expressed in nanomole Gd per gram of wet tissue weight (tissue samples) or micromole Gd per liter of plasma.
Statistical Analysis
Differences between the 5 contrast agents were tested at each time point using an analysis of variance model with 2 factors for the DCN/cerebellar cortex ratio. The time course of this ratio was evaluated by analyzing the potential progressive increase of the signal ratio during the injection phase and the all follow-up period by means of a regression test and a lack-of-fit test. Lastly, differences in tissue Gd content and R1 values were tested with an analysis of variance or Kruskal-Wallis test after checking the normal distribution. All analyses were performed with SAS v9.2 (SAS Institute Inc, Cary, NC). A P value below 0.05 was considered to indicate significant difference.
A box plot graph was used to identify unusual data, and then a Dixon test was performed to detect outlier values.
RESULTS
Thirty-eight rats completed the protocol: 7 in the control and gadoterate meglumine groups and 8 in the gadopentetate dimeglumine, gadobenate dimeglumine, and gadodiamide groups. The death of the 2 remaining rats was ascribed to anesthetic complication.
Qualitative Analysis
Reference Injection Protocol, Comparison of the 5 Contrast Agents
Figure 3, A to E shows typical examples of brain MRIs during both the injection and the treatment-free periods for all 5 tested compounds; only the linear GBCAs induced detectable T1 hypersignal intensity in the DCN. Arrows on positive DCN are shown only in the cases where consensus on scoring 2 was reached between the 2 readers. Figure 4 displays DCN T1-weighted MRIs for all animals upon completion of the 10-week study period. Deep cerebellar nuclei signal enhancement was obvious for all the 3 linear GBCAs, but not for the macrocyclic gadoterate meglumine and saline. Qualitatively, after a randomized reading of the 380 images (38 rats × 10 weeks) by the 2 blinded neuroradiologists, an increase in signal intensity was detected only with linear GBCAs by both readers (Fig. 5). For both readers, T1 signal hyperintensity in the gadodiamide group increased very rapidly, reaching its maximum value after 12 injections and remaining stable during the treatment-free period. No difference was detected between gadoterate meglumine and saline regardless of the time point. The gadopentetate dimeglumine and gadobenate dimeglumine groups had different profiles. The number of positive rats progressively increased during the treatment period and continued to grow after completion of the injection period. At week 10, nearly all the rats in the gadopentetate dimeglumine and gadobenate dimeglumine groups displayed a DCN T1 hypersignal, as did the gadodiamide group, at completion of the follow-up period.
FIGURE 3.
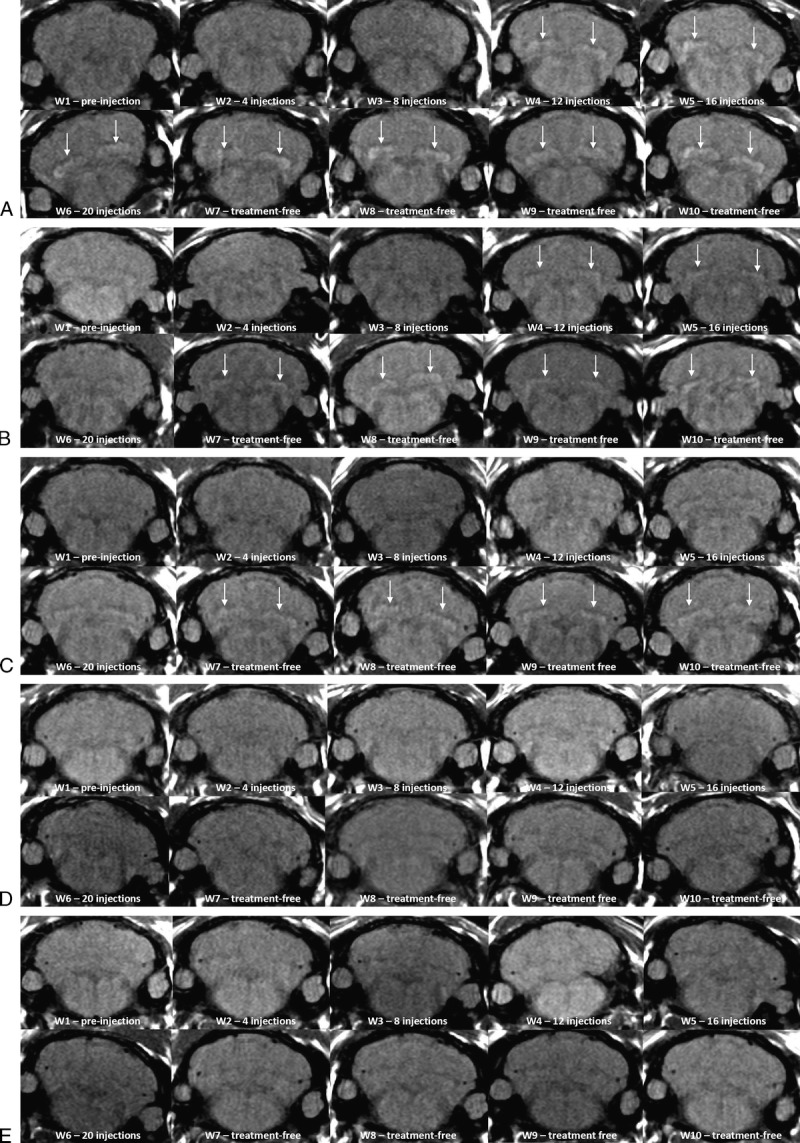
A–E, Representative T1-weighted MRI follow-up. A, Representative T1-weighted MRI follow-up in the gadodiamide group (rat 18) revealed significant T1 signal hyperintensity in the DCN from week 4. Arrows on positive DCN are shown only in the cases where consensus on scoring 2 was reached between the 2 readers. B, Representative T1-weighted MRI follow-up in the gadobenate dimeglumine group (rat 39) revealed significant T1 signal hyperintensity in the DCN from week 4. Arrows on positive DCN are shown only in the cases where consensus on scoring 2 was reached between the 2 readers. C, Representative T1-weighted MRI follow-up in the gadopentetate dimeglumine group (rat 25) revealed significant T1 signal hyperintensity in the DCN from week 7. Arrows on positive DCN are shown only in the cases where consensus on scoring 2 was reached between the 2 readers. D, Representative T1-weighted MRI follow-up in the gadoterate meglumine group (rat 5) did not reveal any T1 signal increase in DCN. E, Representative T1-weighted MRI follow-up in the control group (saline, rat 15) did not reveal any T1 signal increase in DCN.
FIGURE 4.
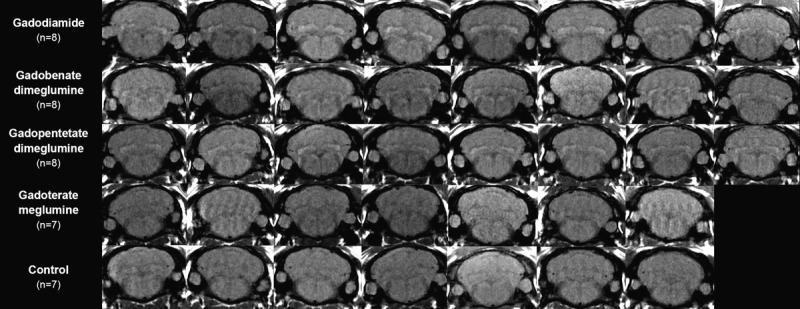
T1-weighted MRI at week 10 (completion of the treatment-free period, all rats).
FIGURE 5.
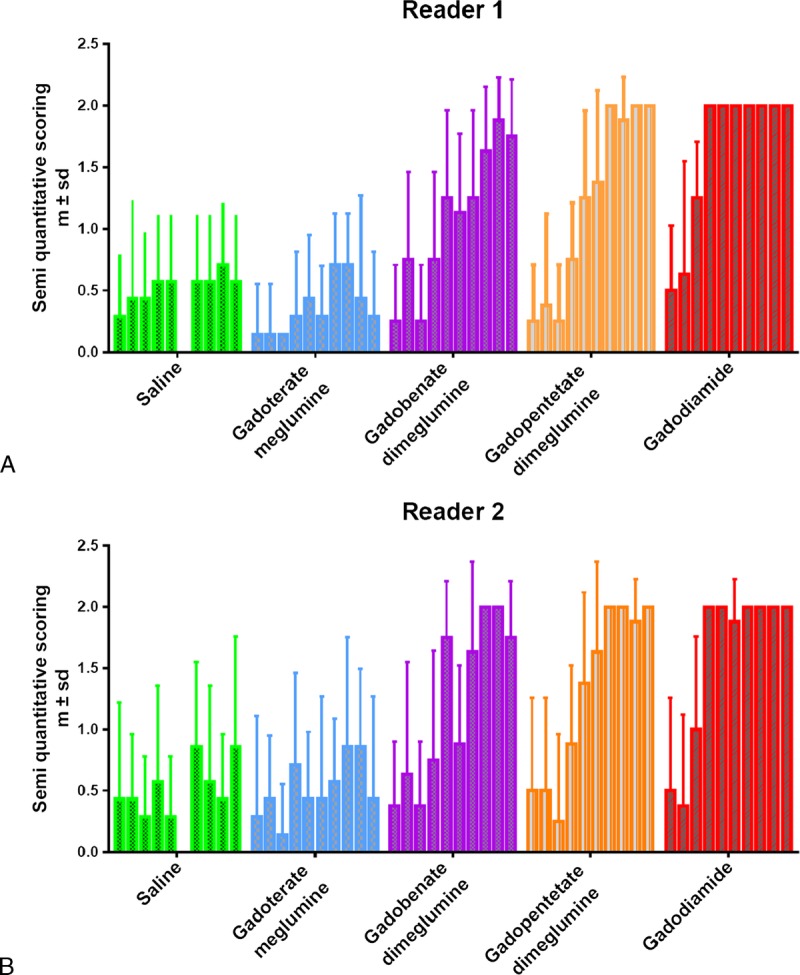
Temporal changes in qualitative blinded evaluation of the T1-weighted signal hyperintensity between the DCN area and cerebellar cortex (mean ± SD). Each box plot represents 1 week of follow-up (10 box plots per product).
Simplified Injection Protocol With Gadodiamide
Figure 6 shows the images of all rats after the 2 injections a week (A) and 1 injection a week injection protocols (B) at week 1 (preinjection), week 6 (end of the injection period), and week 10 (after the treatment-free period). All the rats were classified as positive at both weeks 6 and 10 (arrows). No quantitative analysis was performed on these images.
FIGURE 6.
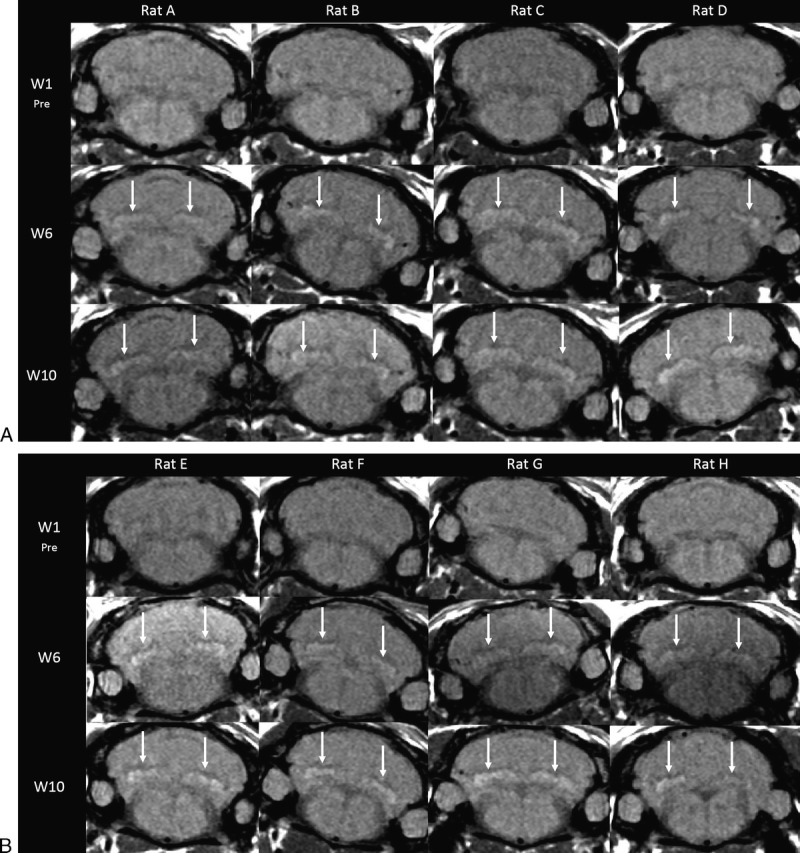
Modified injection protocols with (A) 2 × 1.2 mmol/kg and (B) 1 × 2.4 mmol/kg gadodiamide injections per week for 5 weeks.
Quantitative Analysis
DCN/Cerebellum Signal Ratio
Rapid T1 hypersignal between DCN and the surrounding cerebellum was observed after gadodiamide administration. Enhancement after gadobenate dimeglumine or gadopentetate dimeglumine appeared more progressively during the 10 weeks of imaging as compared with gadodiamide (Fig. 7). No such enhancement was observed with gadoterate meglumine or saline, which remained at baseline levels. At week 10, the DCN/cerebellum ratio was significantly different for gadodiamide (P = 0.003) and gadopentetate dimeglumine (P = 0.007) compared with saline. For gadobenate dimeglumine, the difference versus saline was not significant (P = 0.06), and no difference was observed for gadoterate meglumine (P = 0.78) versus saline.
FIGURE 7.
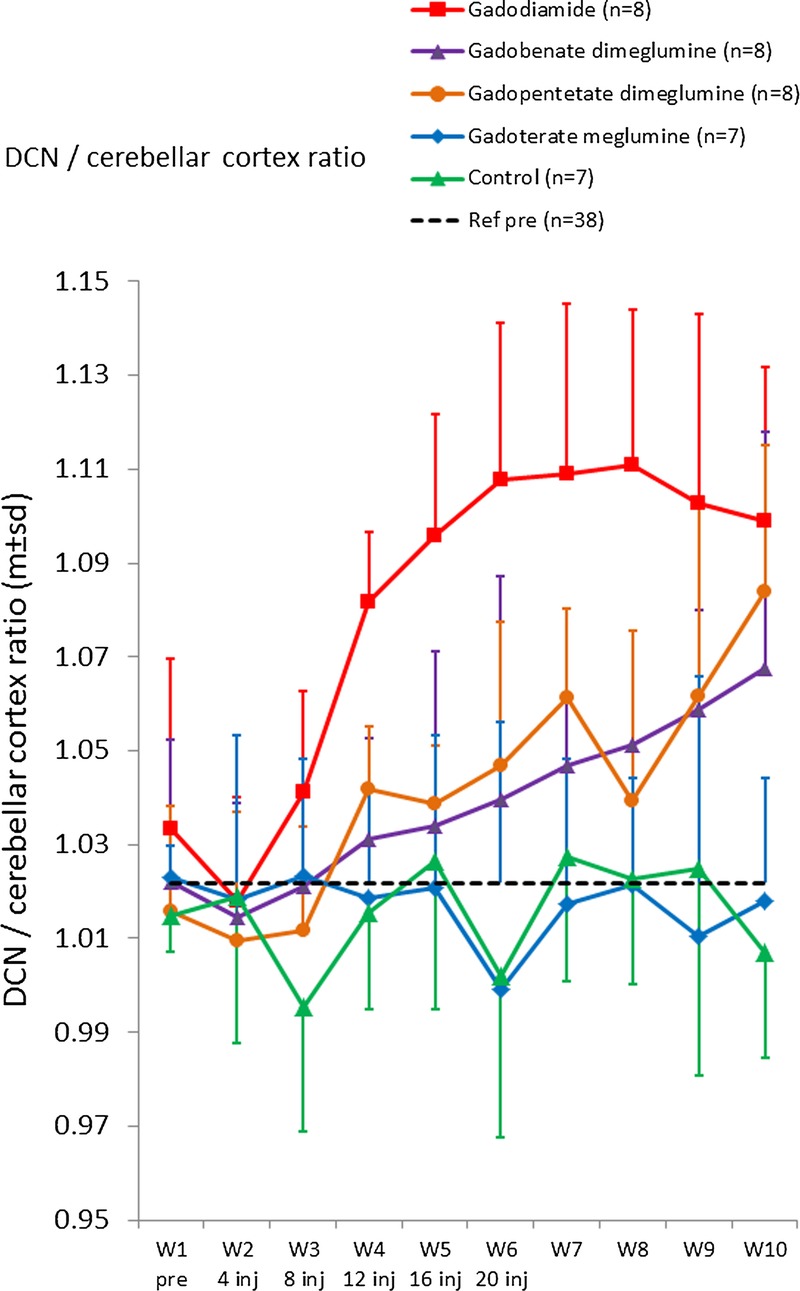
Quantitative analysis. Temporal changes in DCN/cerebellar cortex T1-weighted signal ratio (mean ± SD). The dashed line corresponds to the mean ratio pre-injection for all rats (n = 38).
The progressive increase of ratio was studied by measuring the gradients during the injection phase (week 1 to 6) and during the entire follow-up period (week 1 to week 10) (Fig. 8). Significant positive slopes were observed during the follow-up period for all the linear contrast agents, as opposed to the macrocyclic gadoterate meglumine and saline groups. Slopes between week 1 and 10 were higher for gadodiamide (0.0098 ± 0.0013 week−1, P < 0.0001), gadopentetate dimeglumine (0.0072 ± 0.0011 week−1, P < 0.0001), and gadobenate dimeglumine (0.0056 ± 0.0012 week−1, P < 0.0001) compared with gadoterate meglumine (−0.0008 ± 0.0011 week−1, P = 0.47, not significant) and saline (0.0007 ± 0.0014 week−1, P = 0.61 not significant). Ranking of the products was the same during the injection period, between week 1 and 6: gadodiamide (0.0185 ± 0.0024 week−1, P < 0.0001), gadopentetate dimeglumine (0.0078 ± 0.0019 week−1, P = 0.0002), gadobenate dimeglumine (0.0045 ± 0.0026 week−1, P = 0.09) as compared with gadoterate meglumine (−0.0034 ± 0.0024 week−1, P = 0.1660), and control saline (−0.0007 ± 0.0034 week−1, P = 0.85, not significant). No significant difference was observed between the macrocyclic agent gadoterate meglumine and saline.
FIGURE 8.
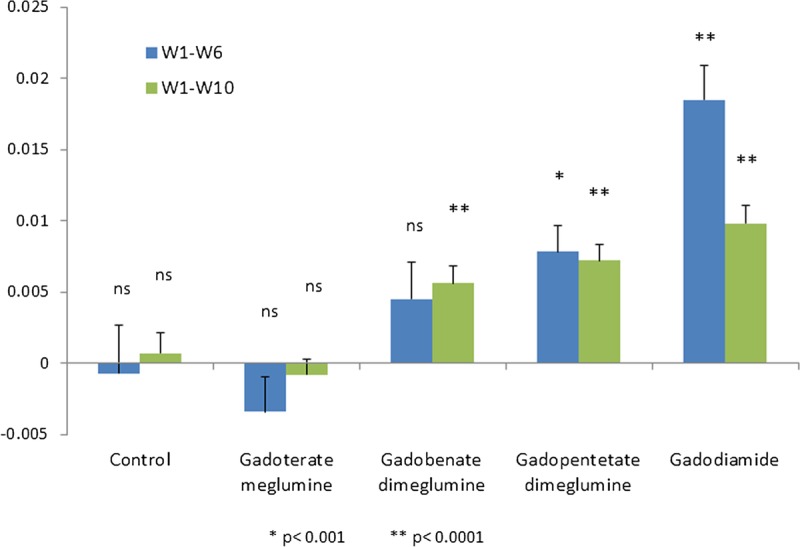
Slope of the temporal changes in DCN/cerebellar cortex T1-weighted signal ratio (mean ± SD).
R1 Maps
Typical R1 maps of the brain and the R1 mean ± SD in the cerebellum and DCN for all rats at completion of the protocol are shown in Figure 9. Higher R1 is observed on the color maps for the 3 linear GBCAs tested. Relaxation rates of the products were as follows for the relaxation rates of the DCN: gadodiamide (1.44 ± 0.05 s−1), gadobenate dimeglumine (1.41 ± 0.03 s−1), gadopentetate dimeglumine (1.40 ± 0.06 s−1), compared with control saline (1.37 ± 0.03 s−1) and gadoterate meglumine (1.36 ± 0.04 s−1). The cerebellar R1 value was significantly higher for gadodiamide as compared with that of gadoterate meglumine (P < 0.05). The DCN R1 value was significantly higher for gadodiamide as compared with those of saline (P < 0.01) and gadoterate meglumine (P < 0.001).
FIGURE 9.
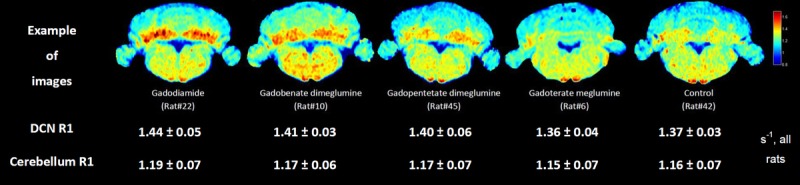
Mean R1 values for the five groups (mean ± SD) and representative R1 maps for 5 rats at week 10. Unit: sec-1
Total Gadolinium Concentrations in the Cerebellum
The total gadolinium concentration in the cerebellum was 4 to 14 times higher after linear chelate injections compared with gadoterate meglumine, and 13 to 42 times higher compared with the control group (Fig. 10A).
FIGURE 10.
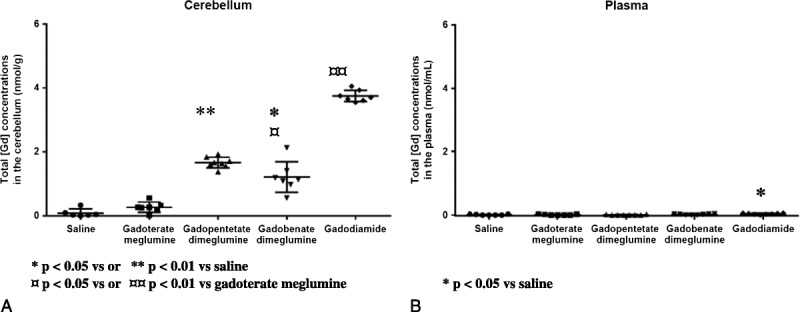
Total gadolinium concentration in nanomole Gd per gram of tissue for cerebellum and nmol/mL of plasma. Individual values, mean, and SD are given.
In the cerebellum, the highest concentration and percentage of injected dose (%ID) were observed with gadodiamide (3.75 ± 0.18 nmol/g, n = 7 corresponding to 0.128 ± 0.008 × 10⁻³ %ID/g) then the concentrations of gadopentetate dimeglumine (1.67 ± 0.17 nmol/g, n = 8 corresponding to 0.056 ± 0.005 × 10⁻³ %ID/g) and gadobenate dimeglumine (1.21 ± 0.48 nmol/g, n = 7 corresponding to 0.040 ± 0.015 × 10⁻³ %ID/g) and finally the lowest concentration for gadoterate meglumine (0.27 ± 0.16 nmol/g, n = 7 corresponding to 0.010 ± 0.005 × 10⁻³ %ID/g) and saline (0.09 ± 0.12 nmol/g, n = 6). The cerebellar total Gd concentration of all linear contrast agents was significantly greater than that measured in the gadoterate meglumine and saline groups. No significant difference was observed between the macrocyclic agent and saline.
Total plasma concentrations were very low and inferior to the limit of quantification for all GBCAs except for gadodiamide with a concentration of 0.04 ± 0.02 nmol/mL (Fig. 10B). Only the total plasma concentration of Gd after gadodiamide was significantly different from saline (P < 0.05).
DISCUSSION
The present study reveals the presence of a T1 hypersignal in DCN of healthy rats after injection of 3 linear GBCAs: gadodiamide, gadobenate dimeglumine, and gadopentetate dimeglumine. The results after repeated injections of gadodiamide are consistent with previously published data26 and are consistent with a simplified injection protocol. No T1 hyperintensity was observed in rats treated with the macrocyclic gadoterate meglumine or saline. Half-lives of GBCAs in rat are approximately 20 minutes30 and 1.2 to 2 hours in healthy humans. If we consider the ratio of half-lives between humans and rats,4–6 our protocol involving 4 injections per week would correspond to 4 injections to patients in a period of 1 to 6 months. For comparison, Radbruch et al9 have included patients who underwent 5 to 15 MRI scans in a period of 11 to 17 weeks.
The T1 signal intensity measured after administration of gadobenate dimeglumine and gadopentetate dimeglumine progressively increased during the 10 weeks of follow-up, not only during the injection period (W1–W5) but also during the 5 subsequent treatment-free weeks (W6–W10). Two hypotheses might explain this prolonged increase of T1 contrast even after stopping the injection of linear GBCAs even though no more Gd was detected in the plasma at week 10. The first hypothesis could be that the increase in signal intensity is due to a progressive change of the Gd form, from a low-relaxivity (eg, Gd under a chelated form) to a high-relaxivity molecule (eg, dissociated Gd bound to a macromolecule). A second hypothesis is that some organs, such as bones, can be a reservoir for gadolinium and may slowly release enough metal back into extracellular space to gradually reach the brain, as suggested by Hirano and Suzuki.31
At week 10, the cerebellum retention of gadolinium was confirmed for the linear GBCA groups, with a significantly higher gadolinium concentration (factor of 4 to 14) than that of the macrocyclic GBCA or control groups. Nevertheless, a very low but not significant (0.010 ± 0.00510−3 %ID/g) quantifiable Gd concentration was measured after gadoterate meglumine in cerebellum compared with saline (0.27 ± 0.16 nmol/g vs 0.09 ± 0.12 nmol/g, respectively, not significant, P = 0.16). Previous studies performed in mice treated with a much lower dose (single intravenous administration of 0.48 mmol/kg of 153Gd-labeled GBCAs) have shown a rapid disappearance of Gd in the brain Gd (<limit of detection at 1 day after administration), even with macrocyclic GBCAs.20 The injection protocol we applied resulted in a high cumulated dose at completion of the 5 treatment weeks (ie, 12 mmol/kg). We therefore hypothesize that when a very high dose is applied to rats, remaining macrocyclic product content in tissues can be evidenced even with the high-stability GBCA gadoterate meglumine. Moreover, as recently shown by Birka et al32 in the case of the macrocyclic chelate gadoteridol, the GBCA can be stored during a long period while remaining chelated.
T1 signal hyperintensity was observed exclusively in the case of linear GBCAs. Both the thermodynamic stability constant (log Kcond at physiological pH) and the kinetic dissociation rate must be taken into account to describe their behavior.22,28 It has been shown that at a pH of 1.0 and at 25°C, the half-life of chelate dissociation is lower than 5 seconds for all linear GBCAs.28 In human serum at pH 7.4 and 37°C, the Gd release from the chelate was found to be in the descending order: gadodiamide > gadopentetate dimeglumine = gadobenate dimeglumine. For macrocyclic GBCAs, no Gd dissociation was evidenced for 15 days.22 The log Kcond values (pH 7.4) are higher with gadopentetate dimeglumine (17.7) and gadobenate dimeglumine (18.4) than with gadodiamide (14.9).28 Interestingly, in our study, the rate of the T1 signal DCN/cerebellar cortex ratios increases were higher for gadodiamide than for ionic and linear GBCAs. No significant T1 hyperintensity was observed for gadoterate meglumine. Gadoterate meglumine is characterized by both high thermodynamic and kinetic stabilities.28,33 In the case of macrocyclic chelates, the relevance of the thermodynamic stability remains debated while that of the kinetic stability is well agreed upon.28,34 Our data support the assumption that the gradual T1 hypersignal is associated with the gradual dechelation of the linear chelates characterized by a low kinetic stability and for which the thermodynamic component also plays a substantial role, as demonstrated by the difference between gadopentetate dimeglumine and gadobenate dimeglumine.
In this work, we performed quantitative R1 mapping to investigate the pure T1 effect of gadolinium accumulation on DCN. At week 10, R1 of DCN is clearly increased with linear contrast agents as compared with gadoterate meglumine or saline. The concentrations found in the cerebellum are in the micromolar range (eg, for gadodiamide: 3.75 ± 0.18 nmol/g ∼ 3.8 μM assuming a tissue density of 1 g/L). If we hypothesize that the Gd dosed is mainly located in the DCN, representing only a few percentage of the total volume of cerebellum, this would corresponds to a concentration higher than 10 μM, which is in the level of MRI sensitivity for contrast detection. In addition, with such R1 maps, if we were able to know with precision the DCN Gd concentration by any other technic, we could estimate the local relaxivities of the Gd, and therefore investigate the form in which the Gd is in the brain tissue.
Basically, the T1 hypersignal observed in our study can be ascribed either to the uptake of the still-chelated linear GBCAs, trapped in its soluble form in the interstitial space of the DCN, or dissociated Gd from accumulated GBCA and present in soluble form, probably bound to a macromolecule. In addition, both possibilities can coexist in the DCN. The recent discovery of still-chelated macrocyclic GBCA (gadoteridol) in the skin of a nephrogenic systemic fibrosis patient 8 years after the last administration may favor the first hypothesis.32 Noteworthy, in the same patient, a linear GBCA (gadopentetate dimeglumine) also administered to this patient was not found in the chelated form.
At present numerous questions remain. It may be speculated that the dissociated Gd is bound to a macromolecule, the nature of which is unknown. This process might involve another metal (transmetallation). Of interest, a substantial and age-dependent concentration of iron has been measured in the human dentate nucleus.35–38 The thermodynamic stability of Fe chelates is often higher than that of Gd chelates (eg, for gadodiamide, the log Ktherm value of Fe-DTPA-BMA is 21.9, while it is 16.9 for Gd-DTPA-BMA).28,39 In the DCN of one gadodiamide-treated rat, the Fe concentration estimated by the particle x-ray–induced emission technique was found to be 30 to 160 nmol/g (according to the subarea tested) (unpublished data, Professor Richard Ortega, CNRS, Bordeaux, France), that is, greater than the total Gd concentration measured in our study. Lastly, the presence of dissociated and insoluble Gd would be consistent with the Gd deposits reported in humans by McDonald et al6 in the capillary endothelium and interstitium of the dentate nucleus. Taken together, these data may favor the GBCA dissociation hypothesis.
In the case of gadobenate dimeglumine, the hepatobiliary excretion in rats (55%) is far greater than in humans (3%–5%).40 Since our rats had normal renal and liver functions and since T1/2β excretion half-lives are similar in healthy rats for all GBCAs including gadobenate dimeglumine (∼20 minutes),41,42 it is worth noting that Gd accumulation still occurred with gadobenate dimeglumine despite that its substantial hepatobiliary excretion in this species.
In our study, no obvious behavioral abnormalities were detected in rats, regardless of the GBCA administered. It is likely that if Gd accumulation in the DCN has toxicological or functional consequences, these will be subtle and may occur at a later time point. Lesions of dentate nucleus (including from iatrogenic origin) are typically associated with ataxia,43,44 which needs highly sensitive nonclinical models to be detected. They may also lead to dysarthria,43 which, of course, cannot be explored in this experimental model. Dedicated experimental models are therefore needed for in-depth analysis of the potential deleterious consequences of Gd accumulation in the dentate nucleus.
So far, there are no available data on our animal model with respect to 5 of the marketed GBCAs: the nonionic macrocyclic GBCAs gadobutrol (Gadovist/Gadavist, Bayer) and gadoteridol (ProHance, Bracco), the nonionic linear GBCA gadoversetamide (OptiMARK, Mallinckrodt), and the ionic and linear gadoxetic acid (Eovist/Primovist, Bayer) and gadofosveset trisodium (Ablavar, Lantheus).
In conclusion, cerebellar retention of gadolinium was observed for all 3 linear contrast agents tested gadobenate dimeglumine, gadopentetate dimeglumine, and gadodiamide. The T1 hypersignal in the DCN was highly consistent and observed regardless of the injection protocol. This animal model opens new perspectives for potentially comparing all the GBCAs and to investigate the mechanism underlying the accumulation of Gd in the brain.
ACKNOWLEDGMENTS
The authors thank Miguel Soares, Veronique Vives, Jean-Philippe Roquecave, Robin Santus, Cécile Factor, Gaëlle Jestin-Mayer, Simon Bourgery, and Solenne Vaillant for their contribution in experiments and data analysis. The authors also thank Elizabeth Palmer and Charles Stanley for their precious help in the manuscript writing and to Soladis for statistical analysis.
Footnotes
SG and SL report no conflict of interest.
REFERENCES
- 1. Adin ME, Kleinberg L, Vaidya D, et al. Hyperintense dentate nuclei on T1-weighted MRI: relation to repeat gadolinium administration. AJNR Am J Neuroradiol. 2015; 36: 1859– 1865. [DOI] [PMC free article] [PubMed] [Google Scholar]
- 2. Errante Y, Cirimele V, Mallio CA, et al. Progressive increase of T1 signal intensity of the dentate nucleus on unenhanced magnetic resonance images is associated with cumulative doses of intravenously administered gadodiamide in patients with normal renal function, suggesting dechelation. Invest Radiol. 2014; 49: 685– 690. [DOI] [PubMed] [Google Scholar]
- 3. Kanda T, Fukusato T, Matsuda M, et al. Gadolinium-based contrast agent accumulates in the brain even in subjects without severe renal dysfunction: evaluation of autopsy brain specimens with inductively coupled plasma mass spectroscopy. Radiology. 2015; 276: 228– 232. [DOI] [PubMed] [Google Scholar]
- 4. Kanda T, Ishii K, Kawaguchi H, et al. High signal intensity in the dentate nucleus and globus pallidus on unenhanced T1-weighted MR images: relationship with increasing cumulative dose of a gadolinium-based contrast material. Radiology. 2014; 270: 834– 841. [DOI] [PubMed] [Google Scholar]
- 5. Kanda T, Osawa M, Oba H, et al. High signal intensity in dentate nucleus on unenhanced T1-weighted MR images: association with linear versus macrocyclic gadolinium chelate administration. Radiology. 2015; 275: 803– 809. [DOI] [PubMed] [Google Scholar]
- 6. McDonald RJ, McDonald JS, Kallmes DF, et al. Intracranial gadolinium deposition after contrast-enhanced MR imaging. Radiology. 2015; 275: 772– 782. [DOI] [PubMed] [Google Scholar]
- 7. Quattrocchi CC, Mallio CA, Errante Y, et al. High T1 signal intensity in dentate nucleus after multiple injections of linear gadolinium chelates. Radiology. 2015; 276: 616– 617. [DOI] [PubMed] [Google Scholar]
- 8. Quattrocchi CC, Mallio CA, Errante Y, et al. Gadodiamide and dentate nucleus T1 hyperintensity in patients with meningioma evaluated by multiple follow-up contrast-enhanced magnetic resonance examinations with no systemic interval therapy. Invest Radiol. 2015; 50: 470– 472. [DOI] [PubMed] [Google Scholar]
- 9. Radbruch A, Weberling LD, Kieslich PJ, et al. Gadolinium retention in the dentate nucleus and globus pallidus is dependent on the class of contrast agent. Radiology. 2015; 275: 783– 791. [DOI] [PubMed] [Google Scholar]
- 10. Ramalho J, Castillo M, AlObaidy M, et al. High signal intensity in globus pallidus and dentate nucleus on unenhanced T1-weighted MR images: evaluation of two linear gadolinium-based contrast agents. Radiology. 2015; 276: 836– 844. [DOI] [PubMed] [Google Scholar]
- 11. Roberts DR, Holden KR. Progressive increase of T1 signal intensity in the dentate nucleus and globus pallidus on unenhanced T1-weighted MR images in the pediatric brain exposed to multiple doses of gadolinium contrast. Brain Dev. 2015. [Epub ahead of print]. [DOI] [PubMed] [Google Scholar]
- 12. Stojanov DA, Aracki-Trenkic A, Vojinovic S, et al. Increasing signal intensity within the dentate nucleus and globus pallidus on unenhanced T1W magnetic resonance images in patients with relapsing-remitting multiple sclerosis: correlation with cumulative dose of a macrocyclic gadolinium-based contrast agent, gadobutrol. Eur Radiol. 2015. [Epub ahead of print]. [DOI] [PubMed] [Google Scholar]
- 13. Weberling LD, Kieslich PJ, Kickingereder P, et al. Increased signal intensity in the dentate nucleus on unenhanced T1-weighted images after gadobenate dimeglumine administration. Invest Radiol. 2015; 50: 743– 748. [DOI] [PubMed] [Google Scholar]
- 14. Kanda T, Oba H, Toyoda K, et al. Recent advances in understanding gadolinium retention in the brain. AJNR Am J Neuroradiol. 2015. [Epub ahead of print]. [DOI] [PMC free article] [PubMed] [Google Scholar]
- 15. Radbruch A, Weberling LD, Kieslich PJ, et al. High-signal intensity in the dentate nucleus and globus pallidus on unenhanced T1-weighted images: evaluation of the macrocyclic gadolinium-based contrast agent gadobutrol. Invest Radiol. 2015; 50: 805– 810. [DOI] [PubMed] [Google Scholar]
- 16. Runge VM. Commentary on T1-weighted hypersignal in the deep cerebellar nuclei after repeated administrations of gadolinium-based contrast agents in healthy rats: difference between linear and macrocyclic agents. Invest Radiol. 2015; 50: 481– 482. [DOI] [PubMed] [Google Scholar]
- 17. Kanal E, Tweedle MF. Residual or retained gadolinium: practical implications for radiologists and our patients. Radiology. 2015; 275: 630– 634. [DOI] [PubMed] [Google Scholar]
- 18. Runge VM. Macrocyclic versus linear gadolinium chelates. Invest Radiol. 2015; 50: 811. [DOI] [PubMed] [Google Scholar]
- 19. Montagne A, Toga AW, Zlokovic BV. Blood-brain barrier permeability and gadolinium: benefits and potential pitfalls in research. JAMA Neurol. 2015: 1– 2. [DOI] [PMC free article] [PubMed] [Google Scholar]
- 20. Tweedle MF, Wedeking P, Kumar K. Biodistribution of radiolabeled, formulated gadopentetate, gadoteridol, gadoterate, and gadodiamide in mice and rats. Invest Radiol. 1995; 30: 372– 380. [DOI] [PubMed] [Google Scholar]
- 21. Fretellier N, Idee JM, Dencausse A, et al. Comparative in vivo dissociation of gadolinium chelates in renally impaired rats: a relaxometry study. Invest Radiol. 2011; 46: 292– 300. [DOI] [PubMed] [Google Scholar]
- 22. Frenzel T, Lengsfeld P, Schirmer H, et al. Stability of gadolinium-based magnetic resonance imaging contrast agents in human serum at 37 degrees C. Invest Radiol. 2008; 43: 817– 828. [DOI] [PubMed] [Google Scholar]
- 23. White GW, Gibby WA, Tweedle MF. Comparison of Gd(DTPA-BMA) (Omniscan) versus Gd(HP-DO3A) (ProHance) relative to gadolinium retention in human bone tissue by inductively coupled plasma mass spectroscopy. Invest Radiol. 2006; 41: 272– 278. [DOI] [PubMed] [Google Scholar]
- 24. Agris J, Pietsch H, Balzer T. What evidence is there that gadobutrol causes increasing signal intensity within the dentate nucleus and globus pallidus on unenhanced T1W MRI in patients with RRMS? Eur Radiol. 2015. [Epub ahead of print]. [DOI] [PMC free article] [PubMed] [Google Scholar]
- 25. Stojanov DA. Reply to letter to the editor re: increasing signal intensity within the dentate nucleus and globus pallidus on unenhanced T1W magnetic resonance images in patients with relapsing-remitting multiple sclerosis: correlation with cumulative dose of a macrocyclic gadolinium-based contrast agent, gadobutrol. Eur Radiol. 2015. [Epub ahead of print]. [DOI] [PubMed] [Google Scholar]
- 26. Robert P, Lehericy S, Grand S, et al. T1-weighted hypersignal in the deep cerebellar nuclei after repeated administrations of gadolinium-based contrast agents in healthy rats: difference between linear and macrocyclic agents. Invest Radiol. 2015; 50: 473– 480. [DOI] [PMC free article] [PubMed] [Google Scholar]
- 27. Tweedle MF, Hagan JJ, Kumar K, et al. Reaction of gadolinium chelates with endogenously available ions. Magn Reson Imaging. 1991; 9: 409– 415. [DOI] [PubMed] [Google Scholar]
- 28. Port M, Idee JM, Medina C, et al. Efficiency, thermodynamic and kinetic stability of marketed gadolinium chelates and their possible clinical consequences: a critical review. Biometals. 2008; 21: 469– 490. [DOI] [PubMed] [Google Scholar]
- 29.CfDEaR UFaDA. Guidance for Industry. Estimating the maximum safe starting dose in initial clinical trials for therapeutics in adult healthy volunteers. In: FDA, ed; 2005. Available at: http://www.fda.gov/downloads/Drugs/GuidanceComplianceRegulatoryInformation/Guidances/ucm078932.pdf Accessed July 6, 2005.
- 30. Oksendal AN, Hals PA. Biodistribution and toxicity of MR imaging contrast media. J Magn Reson Imaging. 1993; 3: 157– 165. [DOI] [PubMed] [Google Scholar]
- 31. Hirano S, Suzuki KT. Exposure, metabolism, and toxicity of rare earths and related compounds. Environ Health Perspect. 1996; 104 (suppl 1): 85– 95. [DOI] [PMC free article] [PubMed] [Google Scholar]
- 32. Birka M, Wentker KS, Lusmoller E, et al. Diagnosis of nephrogenic systemic fibrosis by means of elemental bioimaging and speciation analysis. Anal Chem. 2015; 87: 3321– 3328. [DOI] [PubMed] [Google Scholar]
- 33. Idee JM, Port M, Raynal I, et al. Clinical and biological consequences of transmetallation induced by contrast agents for magnetic resonance imaging: a review. Fundam Clin Pharmacol. 2006; 20: 563– 576. [DOI] [PubMed] [Google Scholar]
- 34. Schmitt-Willich H. Stability of linear and macrocyclic gadolinium based contrast agents. Br J Radiol. 2007; 80: 581– 582; author reply 4–5. [DOI] [PubMed] [Google Scholar]
- 35. Diedrichsen J, Balsters JH, Flavell J, et al. A probabilistic MR atlas of the human cerebellum. Neuroimage. 2009; 46: 39– 46. [DOI] [PubMed] [Google Scholar]
- 36. Maschke M, Weber J, Dimitrova A, et al. Age-related changes of the dentate nuclei in normal adults as revealed by 3D fast low angle shot (FLASH) echo sequence magnetic resonance imaging. J Neurol. 2004; 251: 740– 746. [DOI] [PubMed] [Google Scholar]
- 37. Popescu BF, Robinson CA, Rajput A, et al. Iron, copper, and zinc distribution of the cerebellum. Cerebellum. 2009; 8: 74– 79. [DOI] [PubMed] [Google Scholar]
- 38. Rajan MT, Jagannatha Rao KS, Mamatha BM, et al. Quantification of trace elements in normal human brain by inductively coupled plasma atomic emission spectrometry. J Neurol Sci. 1997; 146: 153– 166. [DOI] [PubMed] [Google Scholar]
- 39. Swaminathan S, Shah SV. New insights into nephrogenic systemic fibrosis. J Am Soc Nephrol. 2007; 18: 2636– 2643. [DOI] [PubMed] [Google Scholar]
- 40. Kirchin MA, Pirovano GP, Spinazzi A. Gadobenate dimeglumine (Gd-BOPTA). An overview. Invest Radiol. 1998; 33: 798– 809. [DOI] [PubMed] [Google Scholar]
- 41. Bousquet JC, Saini S, Stark DD, et al. Gd-DOTA: characterization of a new paramagnetic complex. Radiology. 1988; 166: 693– 698. [DOI] [PubMed] [Google Scholar]
- 42. Lorusso V, Arbughi T, Tirone P, et al. Pharmacokinetics and tissue distribution in animals of gadobenate ion, the magnetic resonance imaging contrast enhancing component of gadobenate dimeglumine 0.5 M solution for injection (MultiHance). J Comput Assist Tomogr. 1999; 23 (suppl 1): S181– S194. [DOI] [PubMed] [Google Scholar]
- 43. Dietrichs E. Clinical manifestation of focal cerebellar disease as related to the organization of neural pathways. Acta Neurol Scand Suppl. 2008; 188: 6– 11. [DOI] [PubMed] [Google Scholar]
- 44. Woodruff BK, Wijdicks EF, Marshall WF. Reversible metronidazole-induced lesions of the cerebellar dentate nuclei. N Engl J Med. 2002; 346: 68– 69. [DOI] [PubMed] [Google Scholar]