Abstract
Purpose:
Physical inactivity in Indians is leading to an increase in noncommunicable disorders at an early age in life. Early identification and quantification of the lack of physical activity using simple and reliable exercise testing is the need of the hour. The incremental shuttle walk test (ISWT) is an externally paced walk test widely used for the evaluation of exercise capacity. Currently the normative values available for clinical reference are generated from Western populations. Hence, the study was conducted to find normative values for the ISWT in healthy Indian adults (17-75 years).
Materials and Methods:
A convenience sample of 862 subjects was recruited after ethical approval was obtained. All subjects were divided into groups as per age and gender. For age, the grouping was as follows: Group 1: Young adulthood (17-40 years), group 2: Middle adulthood (40-65 years), and group 3: Old adulthood (>65 years). The ISWT was performed as per standard protocol by Sally Singh.
Results:
The average distance walked were 709.2m,556.4m and 441.3m in females and 807.9 m, 639.6 m and 478.2 m in males in the three respective age groups. Stepwise regression analysis revealed age and gender as key variables correlating with incremental shuttle walk distance (ISWD). The derived predictive equations for males and females may be given as follows: 740.351 - (5.676 × age) + (99.007 × gender).
Conclusion:
Reference values were generated for healthy Indian adults. Physiological response to the ISWT was shown to be affected by gender and increasing age. Easily measurable variables explained 68% of the variance seen in the test, making the reference equation a relevant part of the evaluation of the ISWT.
KEY WORDS: Incremental shuttle walk test, Indian, reference values
INTRODUCTION AND PURPOSE
Inactive lifestyles due to urbanization have caused lifestyle disorders such as diabetes mellitus, hypertension, obesity, and low functional capacity, ultimately leading to cardiovascular disorders at a young age.[1] There is an urgent need for early detection and for the initiation of lifestyle changes. Exercise testing can help in identifying these risk factors at an early stage of the development of noncommunicable disease.
Exercise testing is an important clinical assessment tool that provides complete assessment of the respiratory, cardiac, and metabolic systems. The current gold standard for the evaluation of functional capacity is cardiopulmonary exercise testing, which measures exercise capacity and provides information about physical limitation, disease prognosis, and responsiveness to treatment. Exercise capacity measurement using a simple walk test is well established.[2,3,4] A walk test measures the distance covered over a defined period of time.
The six-minute walk test is a commonly utilized self-paced walking test as it is a simple, objective, reliable, valid, and sensitive tool that provides a reproducible measurement of functional capacity. Its principal advantages are its operational simplicity, cost-effectivity, and relevance to functional activities.[5] However, its disadvantages are that it allows the individual to set the speed of walking[6] and is affected by a variety of factors unrelated to cardiopulmonary status, such as motivation, age, gender, height, and weight.[7] The incremental shuttle walk test (ISWT) overcomes these disadvantages of the six-minute walk test, diminishes the effect of the operator's influence, and improves the standardization of walking tests.
A shuttle walk test guides an individual to walk at a progressively faster pace every minute, achieved by prerecorded signals, and correlates more strongly with maximal oxygen uptake than the six-minute walk distance.[7] It has proved to be simple, valid, reliable, reproducible, and safe when performed appropriately, and has been used in patients with heart disease, lung disease, rheumatoid arthritis, intermittent claudication, and advanced cancer.[8,9,10,11,12,13,14]
Currently, reference values for incremental shuttle walk distance (ISWD) are based on data obtained from countries like Brazil and Britain Population-specific predictive equations estimating walking distances using easily obtainable variables such as age, height, weight, and body mass index (BMI) value are available for those aged 31-90 years.[15,16,17,18] The primary objective of the current study was to generate reference values for healthy Indian adults aged 17 years and above. The secondary aim was to study physiological response to ISWT in various age groups and to analyze the effects of age and gender on the cardiopulmonary load placed by ISWT.
MATERIALS AND METHODS
The study was approved by Institutional Ethical Review Board of MGM Institute of Health Sciences, Navi Mumbai, India. Informed consent was sought from all participants.
A convenient sample of 862 healthy subjects, who well represented geographical, socioeconomic, and physical variations across India, was recruited from urban and rural localities around the MGM Institute of Health Sciences and hospitals of the MGM Trust in Navi Mumbai. Four hundred thirty-one (431) each were males and females, in the age group of 17-75 years. Participants were classified into age groups as per Erickson's classification: Group 1: 17-40 years (males = 288, females = 289), group 2: 41-65 years (males = 98, females = 97), and group 3: >65 years (males = 45, females = 45).[18]
It may be argued that a convenience sample is not the best type of sample to generate normative reference values for a population because of a possibility of sampling error, which may occur due to over- or underrepresentation of subjects from a particular state in India. However, it needs to be emphasized that the sample was cosmopolitan in nature because people from various states of India reside in Navi Mumbai.[19] While the influence of diverse climatic conditions and diet, which exist across various states in India, on cardiovascular endurance cannot be ruled out, the sample studied was considered to be representative of the general Indian population.
Each participant was scrutinized using the American College of Sports Medicine (ACSM) risk profile, the Physical Activity Readiness Questionnaire (PAR-Q), and the Health History Questionnaire. Subjects excluded were those diagnosed with hypertension; diabetes mellitus; cardiac disorders; pulmonary disorders such as chronic obstructive pulmonary disease (COPD) and bronchial asthma; musculoskeletal problems such as osteoarthritis; neurological conditions such as cerebrovascular accidents; developmental problems including cerebral palsy, spina bifida, and learning disorders; and smokers. Peak expiratory flow rate (PEFR) was carried out to rule out any obstructive respiratory diseases. Spirometry not performed as the equipment was not available. Subjects with low risk profiles as per ACSM guidelines were included. None were involved in formal, regular physical training.
All participants were instructed to wear loose, comfortable clothing, wear shoes appropriate for walking, consume a light meal 2 h prior to testing, and avoid vigorous exercise within 2 h of beginning the test. Demographic and anthropometric details such as age, gender, height, weight, and BMI value were recorded.
Functional capacity was evaluated using a standard protocol of ISWT by Sally Singh.[3,5] The total number of shuttles was recorded and the distance was calculated as follows: (distance = number of shuttles × 10). No encouragement was given. The only verbal contact was the direction given each minute to increase the walking speed slightly. The test was determined to end either when the subject was too breathless to maintain the required speed or when the subject failed to complete the shuttle in the time allowed. The parameters of pulse rate, respiratory rate, blood pressure, and rate of perceived exertion (RPE) using a modified Borg scale were noted at baseline and after the test. A practice test was given half an hour prior to the actual test.[20]
RESULTS
Statistical analysis was performed using SPSS software version 16.0 IBM. Descriptive statistics were used to present central tendency, spread of data, and position of dataset using mean, standard deviation, and percentiles. Data were checked for normality. All the variables except pretest diastolic blood pressure fulfilled the assumptions for normality. Males and females were compared using an independent t-test. The three age groups of males and females respectively were compared using one-way analysis of variance (ANOVA). Diastolic blood pressure was compared using the Kruskal-Wallis test. Pearson's correlation coefficients were calculated, and a model of stepwise linear regression was applied.
Demographic details are presented in Table 1. The mean ISWDs covered by females in the three groups were 709.2 m, 556.4 m, and 441.3 m respectively [Table 1], whereas males covered distances of 807.9 m, 639.6 m, and 478.2 m respectively [Table 2]. The distance walked ranged 300-1010 m. Males covered 10-30% longer distances than females (P = 0.000). A significant decline was noted in ISWD in both genders with advancing age (P = 0.000).
Table 1.
Demographics and clinical parameters of 431 females who underwent ISWT
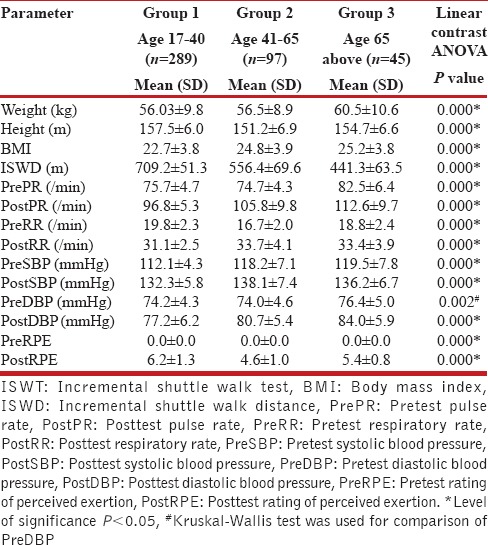
Table 2.
Demographics and clinical parameters of 431 males who underwent ISWT
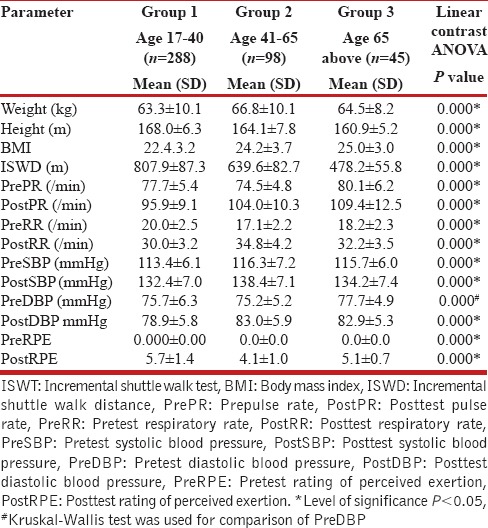
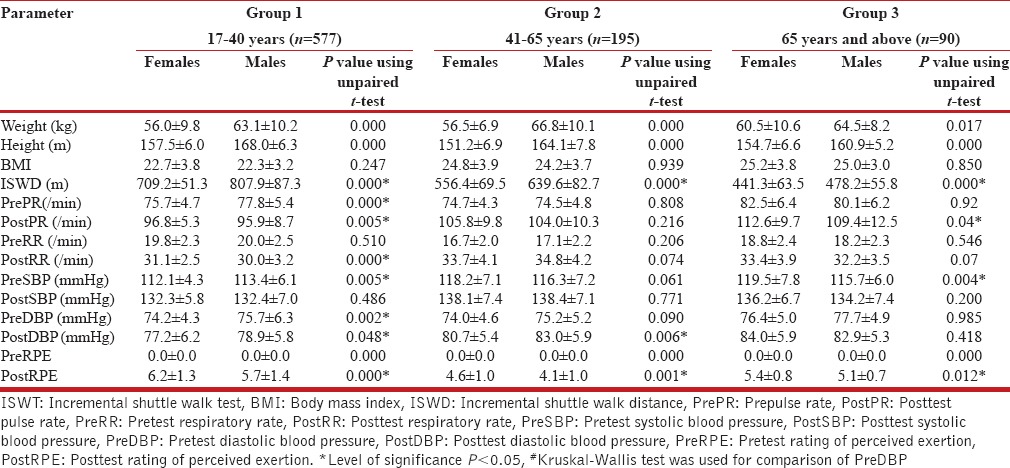
Intergroup comparison using the ANOVA test revealed significant differences in the posttest heart rate, respiratory rate, and systolic blood pressure between the three age groups in males and females [Tables 1 and 2]. Females in young adulthood demonstrated lower pretest pulse rate and diastolic blood pressure; higher posttest pulse rate, respiratory rate, and RPE; and lower posttest diastolic blood pressure compared to males. Females in the mid-adulthood group demonstrated lower posttest diastolic blood pressure and posttest RPE compared to males. Females in the old adulthood group demonstrated higher pretest systolic blood pressure, posttest pulse rate, posttest respiratory rate, posttest systolic blood pressure, and posttest RPE compared to males. Females in the young adult group demonstrated higher posttest values compared to males for all test variables [Table 3].
Table 3.
Comparison of parameters between females and males in different age groups
A model of stepwise linear regression analysis using age, height, weight, and gender was applied with ISWD as a dependent variable. There were significant correlations with age (r = 0.73, P = 0.000), height (r = 0.412, P = 0.000), gender (r = 0.342, P = 0.000), and BMI (r = -0.219, P = 0.000). The age- and gender-based model explained 68% of variability in ISWD. (r2 = 0.682). The following reference equation was obtained where the gender value for females is 0 and for males is 1:
ISWD meters - 740.351 - (5.676 × age) + (99.007 × gender).
DISCUSSION
The present study provides reference values for ISWT in Indians aged 17-75 years, which is needed because the existing reference values and predictive equations for ISWT for healthy adults are generated based on data from South American and European populations.
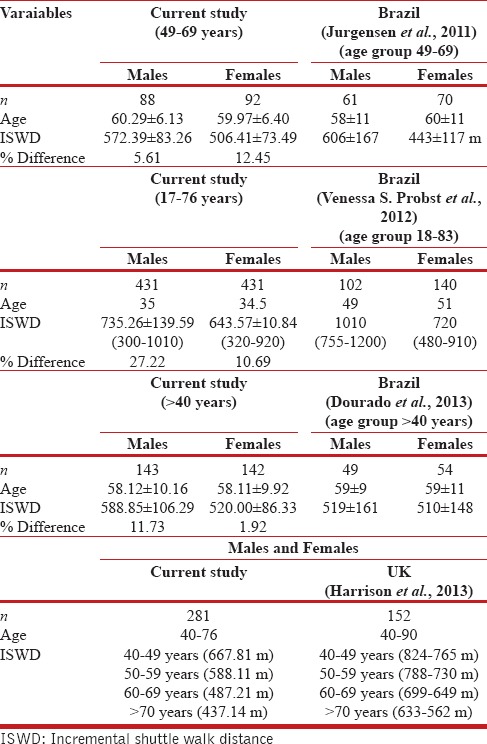
The comparison of our findings with previously reported ISWT values revealed 10-30% difference in age-matched groups.[14,15,16,17] The difference (27%) was greater in younger individuals (17-40 years). Males demonstrated consistently lower values compared to other countries, whereas females demonstrated greater values only in comparison with Brazilian females, which could be due to lower BMI in Indian females.
Earlier studies of ISWT values are largely based on data from individuals >40 years old, effectively excluding data from younger adults aged 17-40 years in a healthy population. Our study includes a wider range of ages, 17-75 years, to provide reference values for the complete adult population. Only one report has presented ISWT values from 18 years of age, including smokers and subjects with comorbidities. ISWDs walked by our age-matched adults were of lower values despite excluding smokers and subjects with comorbidities[17] [Table 4].
Table 4.
Comparison of reference values of ISWD across different countries
The differences observed may be attributed to variations in demographic, anthropometric, lifestyle, nutrition, racial, environmental, and socioeconomic status among different ethnicities.[1,21,22] The difference in ISWD was more prominent in younger subjects and could reflect on the fact that younger people in India have lower levels of fitness compared to their age-matched counterparts in other countries, which could be one of the risk factors for the early development of lifestyle disorders in India.[1,21,22,23]
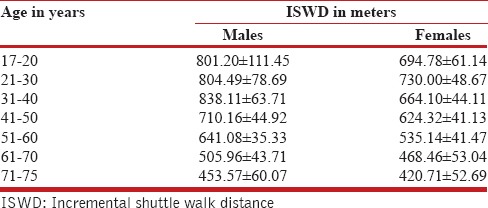
Comparing physiological parameters among different age groups revealed that ISWT placed an increasing load on cardiovascular and ventilatory systems with increasing age, demonstrated by the rise in posttest heart rate and respiratory rate. Earlier studies have reported a maximal posttest heart rate in the range 78-99%; however, in the current study model, posttest heart rates ranged 50-80%, with higher heart rates being recorded for older individuals. This finding could probably be attributed to low physical capacity or lack of motivation in our subjects. The decade-wise evaluation of walking distance revealed that it peaked between 20 years and 30 years of age in females and between 30 years and 40 years in males. A steady decline in both genders was noted, which is in concurrence with earlier findings[16,17,24,25] [Table 5]. The difference between genders continued to decrease with each decade after 40 years.
Table 5.
Values of ISWD in males and females aged 17-75 years in the various decades
The influence of gender on distance walked can be explained by the greater absolute muscle strength, muscle mass, and height of men in comparison with women [Table 1]. Postmenopausal women (>48 years) presented with 29% lower ISWD compared to premenopausal women, suggesting the likelihood of decline in physical capacity following menopause.[25,26]
The RPE was higher in females than males. ISWT may place greater stress on females as it induced higher heart rate, respiratory rate, and systolic blood pressure than in age-matched males. This finding could indicate the need for stringent monitoring while performing the test in females with compromised cardiopulmonary status. Studies have shown that there is a linear increase in heart rate and a curvilinear change in dyspnea, with an increase in exercise intensity during ISWT making it more likely to reveal symptoms during the ISWT.[6]
Stepwise linear regression revealed that ISWD had strong positive correlation with age (r 0.739), weak positive correlation with height (r = 0.412) and gender (r = 0.342). These parameters explain 68% of the variance seen in ISWD. Vanessa et al. (2012) and Jurgensen et al. (2010) have observed stronger correlation with BMI, which was not observed in our model. This may reflect the fact that fitness is considered to be independent of fatness, though low levels of fitness and high levels of fatness increase mortality from all causes.[27] Recent evidence suggests no further increase in the predictive value of equations utilizing lean body mass.[15]
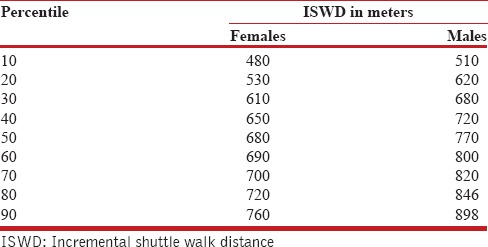
The clinical relevance of our study is evident, as increasing the utilization of ISWT makes it necessary to establish reference values. The strength of the study lies in the large sample size (862 subjects) and wide age group (17-75 years), which allow for a major percentage of subjects who might suffer from cardiopulmonary disorders.[28] An understanding of the physiological responses demonstrated by healthy people in different age groups would aid in evaluating responses in age-matched afflicted people. The performance of afflicted people can be presented as percentiles or absolute values, or compared with predicted values using the reference equation [Tables 5 and 6].
Table 6.
Percentile values of ISWD walked by 862 subjects aged 17-75 years
Easily measurable variables such as age and gender explained 68% of the variance seen in ISWT, making the reference equation a relevant part of the evaluation of ISWT. Normative values for subjects aged less than 17 years are lacking, which necessitates and points to the scope for further work in this field.
CONCLUSION
In conclusion, reference values were generated for healthy Indian adults >17 years of age.
Physiological response to ISWT was affected by gender and increasing age. The generation of reference values makes this simple clinical tool appropriate for the evaluation of exercise capacity in healthy Indian individuals.
Financial support and sponsorship
Nil.
Conflicts of interest
There are no conflicts of interest.
Acknowledgment
We would like to thank all the participants from the MGM School of Physiotherapy, MGM College of Physiotherapy, and MGM College of Engineering. They have formed the backbone of our study throughout this project, which it would not have been possible to complete without their support and interest.
REFERENCES
- 1.Misra A, Chowbey P, Makkar BM, Vikram NK, Wasir JS, Chadha D, et al. Concensus Group. Consensus statement for diagnosis of obesity, abdominal obesity and the metabolic syndrome for Asian Indians and recommendations for physical activity, medical and surgical management. J Assoc Physicians India. 2009;57:163–70. [PubMed] [Google Scholar]
- 2.ATS Committee on Proficiency Standards for Clinical Pulmonary Function Laboratories. ATS statement: Guidelines for the six-minute walk test. Am J Respir Crit Care Med. 2002;166:111–7. doi: 10.1164/ajrccm.166.1.at1102. [DOI] [PubMed] [Google Scholar]
- 3.Noonan V, Dean E. Sub maximal exercise testing: Clinical application and interpretation. Physical therapy journal. 2012:80. [PubMed] [Google Scholar]
- 4.6th ed. Philadelphia: Lippincott Williams and Wilkins; 2000. American College of Sports Medicine. Guidelines for exercise testing and prescription; pp. 73–80. [Google Scholar]
- 5.Singh SJ, Morgan MD, Scott S, Walters D, Hardman AE. Development of a shuttle walking test of disability in patients with chronic airways obstruction. Thorax. 1992;47:1019–24. doi: 10.1136/thx.47.12.1019. [DOI] [PMC free article] [PubMed] [Google Scholar]
- 6.Dechman G. Research Corner. Outcome measures in cardiopulmonary physical therapy: Focus on the shuttle walk test. Cardiopulm Phys Ther J. 2005;16:21. [PMC free article] [PubMed] [Google Scholar]
- 7.Solway S, Brooks D, Lacasse Y, Thomas S. A qualitative systematic overview of the measurement properties of functional walk tests used in the cardiorespiratory domain. Chest. 2001;119:256–70. doi: 10.1378/chest.119.1.256. [DOI] [PubMed] [Google Scholar]
- 8.Lewis ME, Newall C, Townsend JN, Hill SL, Bonster RS. Incremental Shuttle walk test in the assessment of patients for heart transplantation. Heart. 2001;86:183–7. doi: 10.1136/heart.86.2.183. [DOI] [PMC free article] [PubMed] [Google Scholar]
- 9.Win T, Jackson A, Groves AM, Sharples LD, Charman SC, Laroche CM. Comparison of shuttle walk with measured peak oxygen consumption in patients with operable lung cancer. Thorax. 2006;61:57–60. doi: 10.1136/thx.2005.043547. [DOI] [PMC free article] [PubMed] [Google Scholar]
- 10.Macsween A, Johnson NJ, Armstrong G, Bonn J. A validation of 10- meter incremental shuttle walk test as a measure of aerobic power in cardiac and rheumatoid arthritis patients. Arch Phys Med Rehabil. 2001;82:807–10. doi: 10.1053/apmr.2001.23185. [DOI] [PubMed] [Google Scholar]
- 11.Jolly K, Taylor RS, Lip GY, Singh S BRUM Steering Committee. Reproducibility and safety of the incremental shuttle walking test for cardiac rehabilitation. Int J Cardiol. 2008;125:144–5. doi: 10.1016/j.ijcard.2007.01.037. [DOI] [PubMed] [Google Scholar]
- 12.Billings CG, Aung T, Renshaw SA, Bianchi SM. Incremental shuttle walk test in the assessment of patients with obstructive sleep apnea-hypopnea syndrome. J Sleep Res. 2013;22:471–7. doi: 10.1111/jsr.12037. [DOI] [PubMed] [Google Scholar]
- 13.Benzo RP, Sciurba FC. Oxygen consumption, shuttle walking test and the evaluation of lung resection. Respiration. 2010;80:19–23. doi: 10.1159/000235543. [DOI] [PMC free article] [PubMed] [Google Scholar]
- 14.Dourado VZ, Guerra RL, Tanni SE, Antunes LC, Godoy I. Reference values for the incremental shuttle walk test in healthy subjects: From the walk to the physiological responses. J Bras Pneumol. 2013;39:190–7. doi: 10.1590/S1806-37132013000200010. [DOI] [PMC free article] [PubMed] [Google Scholar]
- 15.Jurgensen SP, Antunes LC, Tanni SE, Banov MC, Lucheta PA, Bucceroni AF, et al. The Incremental Shuttle walk test in older Brazilian adults. Respiration. 2011;81:223–8. doi: 10.1159/000319037. [DOI] [PubMed] [Google Scholar]
- 16.Probst VS, Hernandes NA, Teixeira DC, Felcar JM, Mesquita RB, Gonçalves CG, et al. Reference values for the incremental shuttle walk test. Respir Med. 2012;106:243–8. doi: 10.1016/j.rmed.2011.07.023. [DOI] [PubMed] [Google Scholar]
- 17.Harrison SL, Greening NJ, Houchen-Wolloff L, Bankart J, Morgan MD, Steiner MC, et al. Age-specific normal values for the incremental shuttle walk test in a healthy British population. J Cardiopulm Rehabil Prev. 2013;33:309–13. doi: 10.1097/HCR.0b013e3182a0297e. [DOI] [PubMed] [Google Scholar]
- 18.Hoffman CP. Fort Bening, Georgia: Martin Army Community Hospital; 2001. Age Specific Competency-Review and Testing - Erikson. [Google Scholar]
- 19.Migration to Mumbai. Data Highlights. Table D1, D2 and D3. Census of India. 2001 [Google Scholar]
- 20.Dyer F, Marriner P, Cheema K, Bott J. Is a practice incremental shuttle walk test really necessary? Chron Respir Dis. 2011;8:201–5. doi: 10.1177/1479972311415128. [DOI] [PubMed] [Google Scholar]
- 21.Deurenberg P, Deurenberg-Yap M, Guricci S. Asians is different from Caucasians and from each other in their body mass index/body fat percent relationship. Obes Rev. 2002;3:141–6. doi: 10.1046/j.1467-789x.2002.00065.x. [DOI] [PubMed] [Google Scholar]
- 22.Fischbacher CM, Hunt S, Alexander L. How physically active are South Asians in the United Kingdom? A literature review. J Public Health (Oxf) 2004;26:250–8. doi: 10.1093/pubmed/fdh158. [DOI] [PubMed] [Google Scholar]
- 23.Bettiol H, Rona RJ, Chinn S. Variation in physical fitness between ethnic groups in nine year olds. Int J Epidemiol. 1999;28:281–6. doi: 10.1093/ije/28.2.281. [DOI] [PubMed] [Google Scholar]
- 24.Ohtake PJ. Field tests of aerobic capacity for children and older adults. Cardiopulm Phys Ther J. 2005;16:5–11. [Google Scholar]
- 25.Pathak RK, Parashar P. Age at menopause and associated bio-social factors of health in Punjabi women. Open Anthropol J. 2010;3:172–80. [Google Scholar]
- 26.Christian D, Kathad M, Bhavaskar B. Socio-demographic characteristics of postmenopausal women of rural area of Vadodara district, Gujrat. NJCM. 2011;2:419–22. [Google Scholar]
- 27.Stevens J, Can J, Evenson KR, Thomas R. Fitness and fatness as predictors of mortality from all causes and from cardiovascular disease in men and women in the lipid research clinics stydy. Am J Epidemiol. 2002;156:832–41. doi: 10.1093/aje/kwf114. [DOI] [PubMed] [Google Scholar]
- 28.Patel V, Chatterji S, Chisholm D, Ebrahim S, Gopalakrishna G, Mathers C, et al. Chronic diseases and injuries in India. Lancet. 2011;377:413–28. doi: 10.1016/S0140-6736(10)61188-9. [DOI] [PubMed] [Google Scholar]


