

Abstract
Bone marrow stromal cells (BMSCs) possess multi-lineage differentiation potential and can be induced to undergo differentiation into various cell types with the correct combination of chemical and environmental factors. Although, they have shown great prospects in therapeutic and medical applications, less is known about their behavior on nanosurfaces mimicking the extra cellular matrix (ECM). In this report we have employed 2D substrates coated with tobacco mosaic virus (TMV) nanorods to study the differentiation process of BMSCs into osteoblast-like cells. TMV is a rod-shaped plant virus with an average length of 300 nm and diameter of 18 nm. The osteogenic differentiation of BMSCs on TMV was studied over time points of 7, 14 and 21 days. We examined the temporal gene expression changes during these time points by real time quantitative PCR (RT-qPCR) analysis. As expected, osteo-specific genes (osteocalcin, osteopontin and osteonectin) were upregulated and showed a maximum change in expression on TMV at 14 days which was 7 days earlier than on tissue culture plastic (TCP). Based on the genes expression profile generated by RT-qPCR experiments, we proposed that the early interaction of cells with TMV triggers on signaling pathways which regulate speedy expression of osteocalcin in turn, resulting in early mineralization of the cells. To further investigate these regulating factors we studied global changes in gene expression (DNA microarray analyses) during osteogenic differentiation on the nanosubstrate. Multitudes of genes were affected by culturing cells on nanorod substrate, which corroborated our initial PCR findings. Microarray analysis further revealed additional targets influenced by the presence of nanorods on the surface, of which, the expression of bone morphogenetic protein 2 (BMP2) was of particular interests. Further investigation into the temporal change of BMP2, revealed that it acts as a major promoter in signaling the early regulation of osteocalcin on TMV coated substrates.
Keywords: Nanoparticle, Nanotopography, Bone Marrow Stromal Cells, Mesenchymal Stem Cells, Virus Substrate, Osteogenic Differentiation, Microarray
1. INTRODUCTION
Bone marrow derived stem cells possess multi-lineage differentiation potential to terminally differentiate into chondrocytes [1, 2], skeletal muscle cells [3], osteoblasts [4, 5] and vascular muscle cells [6]. These multipotent stem cells originate from the non-hematopoietic sub-population of bone marrow stroma and are referred to as bone marrow derived mesenchymal stem cells/bone marrow stromal cells (BMSCs) [7–9]. Although, these cells are primarily known as progenitors for different skeletal tissues, when induced under different chemical conditions they can differentiate into neurons [10–12] and myogenic cells [13–17]. The growing recognition of BMSCs potential has generated a major curiosity to understand and study, in detail, numerous aspects of stromal cell biology which governs cell fate [18]. The thorough understanding of how these multipotent stem cells develop into differentiated cells remains a central question. For successful functioning of BMSCs, further identification of their nature, developmental process and their amenability to in vitro treatment is necessary. This basic insight into BMSC behavior will enormously enhance envisioning their performance in in vitro biomaterial systems and future use in the development of medical implants and therapeutics.
Of all the crucial factors that govern stem cell fate and commitment, the enriched environment the cells grow in, is one of the most critical. Recently, many scaffolds with different surface topologies and properties have been studied to understand processes such as cell adhesion, proliferation and differentiation. However, an extensive study to explore the changes in transcript levels of various genes during such processes is still limited. In this study we reveal temporal gene expression changes of osteo-specific genes in rat BMSCs seeded on a 2D substrate coated with rod-shaped tobacco mosaic virus (TMV) after induction under osteogenic conditions for 7, 14 and 21 days. We further investigated genome-wide expression responses of BMSCs after plating on TMV substrate for 14 days using microarrays.
Cell interactions with nanometric surfaces result in a specific sequence of gene and protein responses. These series of events initiate as early as the cell begins to sense the environment it grows in. The surface chemistry and topography play a very crucial role in altering cell behaviors at many stages of cell growth and development [19–23]. Biological processes such as adhesion, growth, differentiation and apoptosis, are determined by cell shape and cytoskeletal organization which is directed by cell/surface interactions [24–27]. In our previous report, we employed 2D substrates coated with a spherical plant virus, turnip yellow mosaic virus (TYMV) and investigated how the presence of TYMV influenced the differentiation of BMSCs into osteoblasts. BMSCs induced towards osteogenic lineage on TYMV coated substrates showed an early mineralization by seven days when compared to tissue culture plastic (TCP) [28]. This suggested that BMSCs recognize a nanosurface and the generated topographical cues significantly alter their behavior resulting in different gene expression profiles as compared to flat surfaces.
In view of the fact that cells come in contact with nanofibril like extra cellular matrix (ECM) components in vivo, we sought to study the differentiation process of BMSCs on 2D substrates coated with TMV, a prototypical rod-shaped plant virus. TMV is 300 nm in length with an average diameter of 18 nm; its outer capsid consists of 2130 coat protein units which assemble into the rod-like helical structure around the single strand of RNA. Due to its unique symmetry and competence to undergo chemical and genetic modifications [29], TMV has gained major attention in materials development [30–33]. Its distinctive shape resembles the structure of major ECM components. Hence, employing TMV as a model system can help in understanding the cellular interactions with fibrillar proteins and their subsequent effects on various cellular processes.
Depending upon the temporal expression of genes encoding for osteoblast phenotype markers, the whole differentiation process can be divided into three distinct phases: (1) the proliferation period while cells grow, initiate ECM biosynthesis and start lineage commitment; (2) the matrix development period during which cells progress towards lineage and develop into pre-osteoblasts; and (3) mineralization period which is marked by terminally differentiated polygonal osteoblast like cells [34–37] (Fig. 1A). In this report we have presented the study of temporal changes in the expression of osteo-specific genes in BMSCs over a time period of 21 days on TMV and TCP. We further identified additional genes impacted by the nanomatrix via gene array studies.
Figure 1.
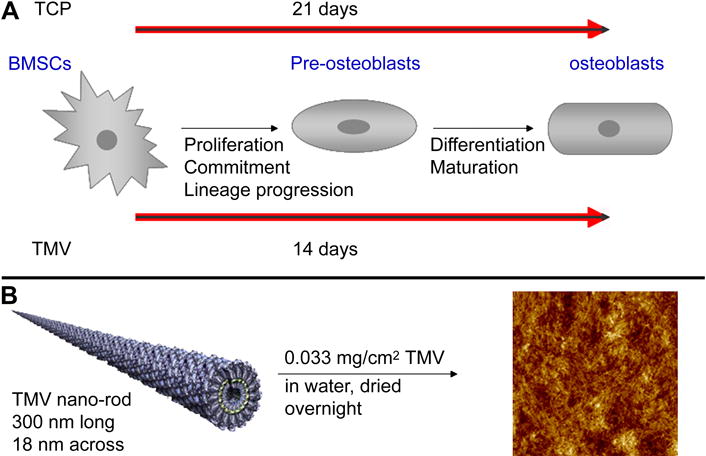
(A) Schematic representation of different phases during osteogenic differentiation of BMSCs. Cells undergo early maturation and mineralization on TMV coated substrate as compared to flat TCP. (B) Representation of TMV wafer preparation by coating on 2D APTES wafers used in the study. The particle coverage on the wafer was characterized by AFM analysis (image on the right).
2. MATERIALS AND METHODS
2.1 Preparation of TMV Coated Substrates
TMV was isolated from infected tobacco leaves following previously established protocols protocols [30]. Aminopropyltriethoxysilane (APTES) coated glass slides (Lab Scientific Inc.) were cut into 1.5 cm2 wafers and washed with ethanol and nanopure water. The wafers were then dried and flushed with nitrogen gas for 5 min. The wafers were coated with 0.033 mg/cm2 TMV solution diluted in water and the coated wafers were dried at room temperature overnight. The virus coverage on the wafers was characterized using a NanoScope IIIA MultiMode atomic force microscope (AFM, from Veeco). Si tips with a resonance frequency of approximately 300 kHz, a spring constant of about 40 N m−1 and a scan rate of 0.5 Hz were used.
2.2 Adhesion Studies and SEM Analysis
Primary BMSCs were isolated from the bone marrow of young adult 80 g male Wister rats (Harlan Sprague Dawley, Inc.). The procedures were performed in accordance with the guidelines for animal experimentation by the Institutional Animal Care and Use Committee, School of Medicine, University of South Carolina. Cells were maintained in growth medium (Dulbecco’s Modified Eagle’s Medium (DMEM) supplemented with 10% fetal bovine serum (FBS), gentamicin (50 mg/mL), and amphotericin B (250 ng/mL)) and passaged no more than four times after isolation before using in different experiments. To induce osteogenesis the growth media was replaced with osteogenic media consisting of DMEM supplemented with 10% FBS, 10 mM sodium β-glycerol phosphate, L-ascorbic acid (50 μg/ml), 10−8 M dexamethasone and gentamicin (8 μg/ml). Cell adhesion to TMV coated substrates at a density of 2.5 × 10⁴ cells under serum free conditions was monitored after 2 hrs and 24 hrs via optical microscopy. All the studies were done in triplicate samples. In order to explore the cell interactions with TMV coated wafers, samples were analyzed via SEM after 72 hrs of cell seeding. SEM samples were prepared by the O-GTA-O-GTA-O method and sample imaging was done by JEOL (Tokyo, Japan) JSM-6300V at 10 kV.
2.3 Real-Time Quantitative PCR Analysis (RT-qPCR)
TMV coated wafers were seeded with 6.5 × 10⁴ cells per wafer and cultured in osteogenic media for 7, 14 and 21 days. In addition, BMSCs with similar density were seeded on the APTES wafers without any TMV coating and 65 mm tissue culture plastic (TCP) for the above mentioned time periods. The cell cultures were terminated at these intervals, and total RNA was extracted using (Qiagen RNeasy mini purification kit, Qiagen) subsequently. The quality and quantity of the extracted RNA was analyzed using Agilent 2100 Bioanalyzer (Agilent Technologies, Inc.) and was reverse transcribed by using iScript™ cDNA synthesis kit (Bio-rad Laboratories). RT-qPCR (iQ5 real-time PCR detection system Bio-rad Laboratories) was done by the method described as: 45 cycles of PCR (95°C for 30 seconds, 58°C for 30 seconds, and 72°C for 30 seconds), after initial denaturation step of 8 minutes and 45 seconds at 95°C, by using 25 μl of iQ5 SYBR Green I supermix, 3 pmol/μl of each forward and reverse primers and 5 μl cDNA templates in a final reaction volume of 50 μl. Acidic ribosomal phosphoprotein P0 (Arbp) was used as the housekeeping gene. Data collection was enabled at 72°C in each cycle and CT (threshold cycle) values were calculated using the iQ5 optical system software version 2. The expression levels of differentiated genes and undifferentiated genes were calculated using Pfaffl’s method for group-wise comparison and statistical analysis of relative expression results from real-time PCR, using Arbp as the reference gene [38]. Quantification of gene expression was based on the CT value for each sample which was calculated as the average of three replicate measurements for each sample analyzed. ‘Pair Wise Fixed Reallocation Randomization Test’ was performed on each sample and a value of p < 0.05 was regarded as significant. The primers used for RT-qPCR are as follows: collagen 1A1 (col1A1), 5′-TCCTGCCGATGTCGCTATC–3′, 5′– CAAGTTCCGGTGTGACTCGTG–3′; osteonectin (SPARC), 5′–ACAAGCTCCACCTGGACTACA–3′, 5′–TCTTCTTCACACGCAGTTT–3′; osteopontin (SPP1), 5′–GACGGCCGAGGTGATAGCTT–3′, 5′-CATGGCTGGTCTTCCCGTTGC–3′; Osteocalcin (BGLAP), 5′-AAAGCCCAGCGACTCT–3′, 5′-CTAAACGGTGGTGCCATAGAT–3′; Runx2, 5′– GCTTCTCCAACCCACGAATG–3′, 5′–GAACTGATAGGACGCTGACGA–3′, BMP2, 5′-ATTGTGGCTCCCCCGG-3′, 5′-TCAGCCAGAGGAAAAGGGC-3′ and Arbp, 5′ -CGACCTGGAAGTCCAACTAC–3′, 5′–ATCTGCTGCATCTGCTTG–3′. The primers were synthesized commercially (Integrated DNA Technologies, Inc.), and evaluated for an annealing temperature of 58°C.
2.4 Immunostaining and Alizarin red assay
In order to corroborate RT-PCR gene expression via immunostaining for osteospecific genes, simultaneous batches of BMSCs culture on TMV coated substrates were terminated on 7, 14 and 21 days. Cells were fixed in 4% paraformaldehyde at 4°C for 40 minutes. Each of the samples was then permeablized for 20 minutes and blocked in 1.5% bovine serum albumin (BSA, Sigma-Aldrich) for 1 hour at room temperature. After blocking, the cells were incubated overnight with primary antibodies targeting the osteo-specific genes osteocalcin, osteopontin and osteonectin. Secondary antibodies Alexa Fluor 546, 633 (obtained from Molecular Probes, Invitrogen) were used for osteocalcin (BGLAP) and osteopontin (SPP1) or osteonectin (SPARC) respectively, at 1:100 dilutions in blocking buffer for 2 hours at room temperature. Alexa Fluor 488 phalloidin (1:200 in PBS) was used to stain filamentous actin. Nuclei were stained with DAPI (4, 6-diamidino-2-phenylindole, 100 ng/ml). Images of the stained substrates were collected using Zeiss LSM 510 Meta confocal scanning laser microscope. Negative control for staining included only secondary antibodies.
After 14 days in osteogenic cultures, BMSCs seeded on TMV substrates were tested for ALPL activity and Alizarin red staining to stain for calcium rich deposits. ALPL activity kit (Sigma-Aldrich) for leukocytes was used for ALPL detection following manufacturer’s instructions. For Alizarin Red staining cells were fixed in 4% paraformaldehyde at room temperature for 40 minutes and stained with 0.1% solution of Alizarin red (Sigma-Aldrich) pH 4.1–4.5 for 30 minutes. Since the reaction was highly light sensitive, the substrates were wrapped in aluminum foil during the entire time of incubation.
2.5 Microarray Analysis
Total RNA for BMSCs grown for 14 days on TMV coated wafers and TCP was extracted using an RNeasy Mini Kit (Qiagen) according to the manufacturer’s instructions. The quantity and quality assessment of RNA was done using Agilent Bioanalyzer 2100 electrophoresis system. Double-stranded cDNA was synthesized from 3 μg of total RNA, and in vitro transcription was performed to produce biotin-labeled cRNA using Gene Chip One-Cycle Target Labeling and Control Reagents (Affymetrix, http://www.affymetrix.com) according to the manufacturer’s instructions. After fragmentation, 15 μg of cRNA was hybridized to each Gene Chip Rat Genome 230 2.0 Array (Affymetrix) containing 31,099 genes. Gene Chips were then stained and washed using the automated Affymetrix fluidics station and scanned using a Gene Chip Scanner 3000 (Affymetrix). The raw data was collected and analyzed using GCOS Manager (Affymetrix) and Pathway Studio 6.2 software.
3. RESULTS
3.1 Characterization of TMV coated wafers
In order to obtain stable coverage of TMV, APTES coated glass slides were used as the underlying substrate. APTES is a positively charged polymer which holds TMV particles on the wafer via electrostatic interactions. These charged interactions were achieved because TMV has an isoelectric pH around 3.5 which creates a negative surface charge on the particles in neutral solutions. The APTES wafers were coated with TMV using a drop coating method and after overnight slow drying; the presence of TMV particles on the wafers was analyzed by AFM. In order to optimize surface coverage with TMV, different TMV concentrations were tried. After multiple repetitive experiments the final amount of 0.033 mg/cm2 was used for the entire study. The micrographs depicted in Figure 1B show complete coverage of the wafer with TMV particles using this optimized concentration. In order to monitor the stability of coating and change in surface coverage, TMV coated wafers were dipped overnight in complete media and kept under standard cell culturing conditions. No significant change was detected in TMV coverage by AFM.
3.2 Adhesion Studies
For initial adhesion studies, BMSCs were seeded on TMV coated wafers under serum free conditions and changes in the cell morphology were monitored using bright field microscopy for 2 hrs and 24 hrs. After 2 hrs of incubation little cell spreading was observed as most of the cells were rounded in shape (Fig. 2A, inset). As the culture continued to 24 hrs cells acquired a more spread morphology which was similar to cells grown under serum conditions. The cell anchorage on the surface was monitored after 72 hrs of culture via SEM analysis (Fig. 2C–D). The SEM images revealed that cells strongly adhered to TMV wafers and anchored to the surface via filopodia-like extensions (Fig. 2D). Attached cells initiated intercellular contacts and were viable, healthy and competent of generating matrix (Fig. 2C). SEM images of TMV wafers alone were also recorded to visualize structural topography of the surface (Fig 2B). Due to resolution constraints, we could not visualize individual TMV particles on the surface; however, at higher magnification we did observe some fibrous structures which could be attributed to TMV particles bundled up together (Fig. 2B). These structural features were absent in uncoated APTES glass SEM (data not shown). The growth and morphological changes in the cells were monitored every two days for the entire study period. By 14 days post culture on TMV substrates, cells started aggregating forming long sheet-like structures which were further analyzed with cytochemical and immunochemical staining techniques.
Figure 2.
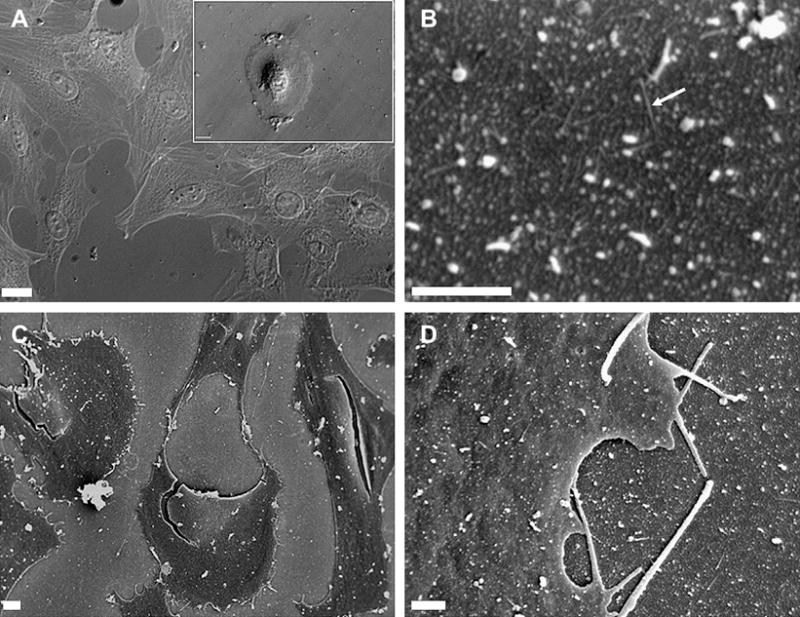
Adhesion of BMSCs on TMV coated wafers. (A) Representation of cell morphology after 2hrs (inset) and 24 hrs of incubation on TMV under serum free conditions. (B–D) SEM micrographs of BMSCs on TMV coated wafers. (B) shows TMV coated APTES wafer, fibrous structures observed (as marked by the arrow) could be due to bundled TMV particles visible on the wafer. (C) shows the interconnection cellular networks and (D) arrows show filopodia like extensions anchoring the cells on to the substrate. Scale bars are 100μm for (A), 10μm for (C) and 1 μm for (B and D).
3.3 Characterization of Osteogenic differentiation by Cytochemical Staining and Immunostaining
BMSCs induced toward osteogenesis were characterized by staining for differentiation markers such as alkaline phosphatase (referred to as ALPL in rat microchip arrays) and Alizarin red. Alkaline phosphatase (ALPL) is a well known phosphatase enzyme which also serves as a differentiation marker [39]. The enzyme activity was detected by introducing the cleavable substrate resulting in the formation of visible product after reacting with alkaline phosphatase (ALPL) present in the cells. The positively stained cells were analyzed using bright field microscopy. Alizarin red stain was used to confirm the presence of mineralized cells, since it specifically binds to highly enriched calcium deposits. As the osteogenic culture of BMSCs on TMV coated wafers progressed from 7 to 14 days, cells started aggregating together forming sheet like structures which were stained for Alizarin red. The cells comprising the sheets stained positive for Alizarin red depicting highest intensity of red color as compared to well-spread neighboring cells (Fig. 3C–i). Even though the cells surrounding the sheets showed much lower intensity of red stain they stained positive for alkaline phosphatase (ALPL).
Figure 3.
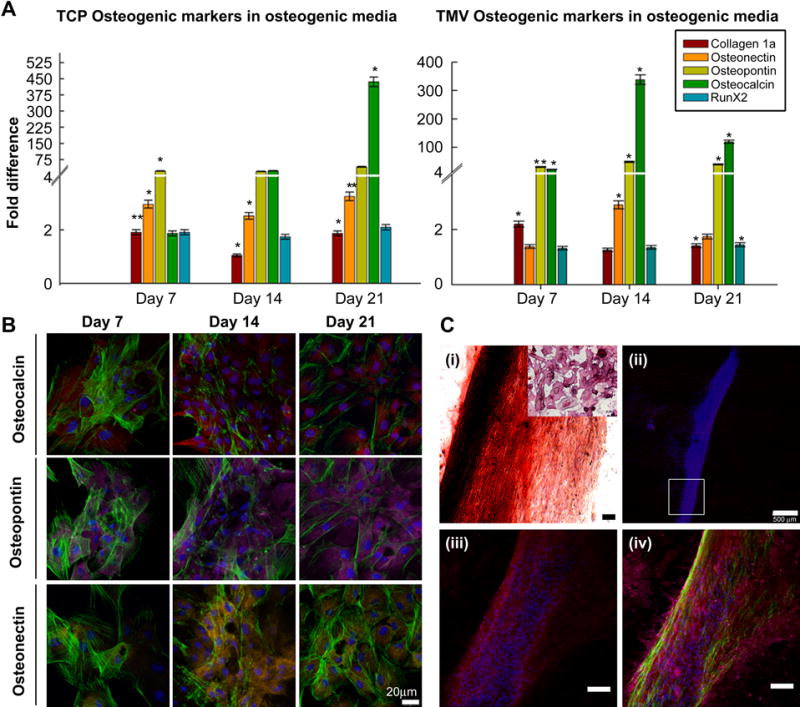
(A) RT-qPCR analysis for the gene expression in the cells seeded on TMV and TCP under osteogenic conditions. For the cells seeded on TMV, the maximum up regulation in the osteocalcin (BGLAP) expression is observed around 14 days as compared to TCP where it achieves maximum up regulation by 21 days. In the graphs (**) represents p < 0.005 and (*) for p < 0.05 respectively. (B) Cells grown on TMV were analyzed for gene expression by immuno-staining for 7, 14 and 21 days (scale bar is 20 μm). (C) Cells aggregated to form sheet like structures around 14 days, which stained positive for BGLAP. The expression of SPP1 remained confined to the cells on the periphery of the sheets and neighboring cells. Scale bars are 20 μm for (B) and 100 μm for (C) i, iii and iv. Color representation: DAPI (blue), phalloidin (green), osteocalcin (BGLAP) (red), osteopontin (SPP1) (pink) and osteonectin (SPARC) (yellow).
In the case of osteogenic differentiation, phenotypic change in cells to a polygonal morphology and production of self mineralized organic matrix mark the terminal stages of differentiation. To determine this morphology change during differentiation, cell cultures on TMV were terminated at 7, 14 and 21 days and cells were stained for osteo-specific genes. As shown in Fig. 3B, BMSCs cultured on TMV under osteogenic conditions revealed a wide spread morphology at day 7 and acquired a polygonal shape as the culture progressed to 14 and 21 days. Osteocalcin (BGLAP) was detected in cells beginning at day 7 and expression became stronger after 14 days in culture. The expression of osteopontin (SPP1), remained consistent throughout the selected time points. However, the cells cultured for 7 days showed less expression of osteonectin (SPARC) which increased consistently as the culture progressed through other time points. By day 14 BMSCs grown on TMV aggregated to form sheet-like structures which also stained positive for all the osteo-specific markers mentioned above. The cells constituting the sheet stained heavily for Osteocalcin (BGLAP), whereas the expression of osteopontin (SPP1) and osteonectin (SPARC) remained confined to the cells on the periphery of the sheets and neighboring cells.
3.4 Temporal gene expression profiles
The difference in fold change expressions of selected osteo-specific genes during the osteogenic differentiation were recorded at 7, 14 and 21 days. BMSCs cultured on TMV and TCP were terminated at selected time points and quantitatively assessed for changes in expression of osteogenic-specific markers of differentiation including osteocalcin (BGLAP), collagen1A1 (col1A1), osteopontin (SPP1), osteonectin (SPARC) and runx2 (RUNX2). Significant changes in fold expression of osteocalcin (BGLAP), the most osteo-specific gene, was observed at earlier time points (7 and 14 days) in cells plated on TMV compared to those grown on TCP with respect to day zero as the control. Osteocalcin (BGLAP) showed a 350 fold up regulation in the cells grown on TMV substrates by day 14 as compared to a 20-fold upregulation on TCP. The highest levels in osteocalcin (BGLAP) expression in TCP occurred at 21 days suggesting complete maturation of cells was expedited by TMV (Fig. 3A). These results imply earlier mineralization occurred in BMSCs grown on TMV substrates by 7 days. The expression levels of collagen1A1 (col1A1) which is one of the major components of bone ECM showed maximal expression during the first 7 days which coincided with extra cellular matrix (ECM) biosynthesis (Fig. 3A). During successive stages of osteogenesis including ECM development and maturation, the level of collagen1A (col1A1) remained at a minimum basal level. The expression profiles for osteonectin (SPP1) and osteopontin (SPARC) correlated with the change in expression of osteocalcin (BGLAP); however, the levels of expression (fold changes) were higher in BMSCs undergoing differentiation on TMV as compared to TCP (Fig. 3A). Runx2 being an early specific marker of osteogenic differentiation showed maximal upregulation during initial TMV contact and remained induced at a constant level throughout the osteogenic differentiation period tested. Occurrence of these gene expression profiles during osteogenesis suggests that the nanoenvironment generated by TMV rods play a crucial role in promoting the osteogenic differentiation of BMSCs.
3.5 Differentially expressed genes during BMSCs osteogenic differentiation via microarray analysis
To further explore the global transcriptional response of cells grown on TMV and TCP, gene chip microarray analysis were performed on cells cultured for 14 days (since maximal expression of osteo-specific gene expression was observed during this time) following the manufacturer’s protocol [40, 41]. Of 31,099 genes analyzed, 1,111 genes were highly expressed (> threefold) in BMSCs grown on TMV substrates for 14 days, whereas 1,969 were highly expressed (> threefold) in cells grown on TCP, when compared to TCP day zero as a reference. All the differential expression analyses were performed using Pathway Studio 6.2 software using the Gene Set Enrichment Analysis (GSEA) method [42]. Using this algorithm, fold change values were converted to signed fold values as described elsewhere [43]. To support the microarray data analysis, mRNA levels of osteocalcin (BGLAP), osteopontin (SPP1), osteonectin (SPARC) and collagen1A1 (col1A1) were validated by RT-qPCR analysis (data not shown). We obtained similar expression patterns from both RT-qPCR and microarray analysis.
Expression data generated from the profiling studies was further categorized based on differential expression compared to day zero and gene ontology (GO) terms which describe biological processes. A subset of genes was classified into the following functional categories relevant to the present study: bone mineralization, ossification, BMP receptor signaling, stem cell differentiation, osteoblast differentiation, osteoblast development, and extra cellular matrix molecules (particularly collagen molecules) and compared the fold expression change on both the surfaces (Table 1). Although collagen type 1 is the major component of the bone and is generally associated with ECM biosynthesis [34, 44, 45], other collagen genes that were up- or downregulated after 14 days of culture were analyzed and listed in Table 1. Most of them showed similar expression profiles on both substrates.
Table 1.
Functional gene grouping and their regulation after 14 days of osteogenic induction on (i) TMV and (ii) TCP.
| GO terms | Gene Functions | Genes Up-regulated | Genes Down-regulated |
|---|---|---|---|
| Skeletal Development | Bone Mineralization | AMBN, AMELX, BMP2, CIDEC, EIF2AKR, PTH2R, PTHR1, PTN | FGFR2, GLA, GPNMB, KLF10, MINPP1, MMP13, PTHLH |
| Ossification | BGLAP, MAPK8, RSAD2, CHRDL2, CTGF, CBFB, TNFSF11, SPP1, BCL2, SORT1, STC1, SOST, CSF1, IBSP, ALPL, THRA, SPARC, CDH11, OSTF1, CHRDL1, EGFR, MMP14, SRGN | IGSF1, MMP9, MEN1, IGSF10, DSPP, SMAD5, RUNX2, FN1, TFIP11, EXT1, DMP1, ENPP1, MGP | |
|
| |||
| Cell Differentiation and Growth | BMP Receptor Signaling | BMP2, BMP6, BMPR1A, FST, MSX2, NOG, BMP8A, BARHL2 | BMP4, BMP5, BMPR2, ACVR2A, ARHGAP5, ID1, MSX1 |
| Stem Cell Differentiation | AMBN, TCF7L1, NOG | ||
| Osteoblast Differentiation | AMELX, BGLAP, BMP2, BMP6, CBFB, GLI1, 1HH, PTH2R, SMO, SPP1, Tmsb4x | CHRD, GABBR1, BMP4, GPNMB, MEF2C, MEF2D, NF1, WWTR1 | |
| Osteoblast Development | PTHR1, SATB2, JUND, SMAD3, PTH2R | ||
|
| |||
| Extracellular Matrix (ECM) Molecules | Collagens | COL1A1, COL1A2, COL3A1, COL4A1, COL4A2, COL4A5, COL5A1, COL5A2, COL5A3, COL6A1, COL6A2, COL9A1, COL10A1, COL11A1, COL13A1, COL14A1,COL16A1, COL17A1, COL18A1, COL22A1, COL23A1, COL24A1, COL27A1 | COL8A1, COL6A6, COL4a4, COL12A1, COL2A1 |
| Other Bone Related Genes | BGLAP, COL1A1, COL1A2, OMD, ITGA1, ITGA9, BMP1, CSF1, CSF2, IGF1, IGF2 | ||
| GO terms | Gene Functions | Genes Up-regulated | Genes Down-regulated |
|---|---|---|---|
| Skeletal Development | Bone Mineralization | AMBN, AMELX, CIDEC, EIF2AKR, PTH2R, PTHR1, KLF10, PTN, PTHLH | BMP2, FGFR2, GLA, GPNMB, MINPP1, MMP13 |
| Ossification | MAPK8, RSAD2, CTGF, TNFSF11, SPP1, SORT1, STC1, SOST, IBSP, ALPL, THRA, SPARC, CDH11, CHRDL1, EGFR, MMP14, SRGN, MMP9, MEN1, IGSF10, DSPP, RUNX2, FN1, TFIP11, | BGLAP, IGSF1, SMAD5, EXT1, DMP1, ENPP1, MGP, CHRDL2,CBFB, BCL2, CSF1, OSTF1 | |
|
| |||
| Cell Differentiation and Growth | BMP Receptor Signaling | BMP6, BMPR1A, BMP8A, BARHL2 | BMP2, FST, MSX2, NOG, BMP4, BMP5, BMPR2, ACVR2A, ARHGAP5, ID1, MSX1 |
| Stem Cell Differentiation | AMBN, TCF7L1 | NOG | |
| Osteoblast Differentiation | AMELX, BMP6, GLI1, 1HH, PTH2R, SMO, SPP1, NF1, Tmsb4x | BGLAP, BMP2, CBFB, CHRD, GABBR1, BMP4, GPNMB, MEF2C, MEF2D, WWTR1 | |
| Osteoblast Development | PTHR1, SATB2, JUND, SMAD3, PTH2R | ||
|
| |||
| Extracellular Matrix (ECM) Molecules | Collagens | COL1A1, COL1A2, COL3A1, COL4A1, COL4A2, COL4A5, COL5A1, COL5A2, COL5A3, COL6A1, COL6A2, COL9A1, COL11A1, COL13A1, COL14A1,COL16A1, COL17A1, COL18A1, COL22A1, COL23A1, COL24A1, COL8A1, COL6A6, COL4a4, COL27A1 | COL10A1, COL12A1, COL2A1 |
| Other Bone Related Genes | COL1A1, COL1A2, OMD, ITGA1, ITGA9, BMP1, CSF2, IGF1, IGF2 | BGLAP, CSF1 | |
Based on gene chip array analyses differential expression changes of several genes were surface specific, for example, osteocalcin (BGLAP) showed 22 fold up regulation in BMSCs differentiated on TMV and was down regulated in TCP (Fig. 4C). Two other genes that were upregulated on TMV but downregulated on TCP were matrix metallopeptidase (MMP9) and Noggin (NOG). Although, other genes such as decorin (DCN), integrin binding bone sialoprotein (IBSP), osteomodulin (OMD) and alkaline phosphatase (ALPL) showed upregulation on both the substrates, a higher positive fold change was observed on TMV as compared to TCP. In contrast, osteopontin (SPP1), osteonectin (SPARC) and collagen 1A1 (col1A1) showed similar differential expression values in cells grown on both substrates (Fig. 4C).
Figure 4.
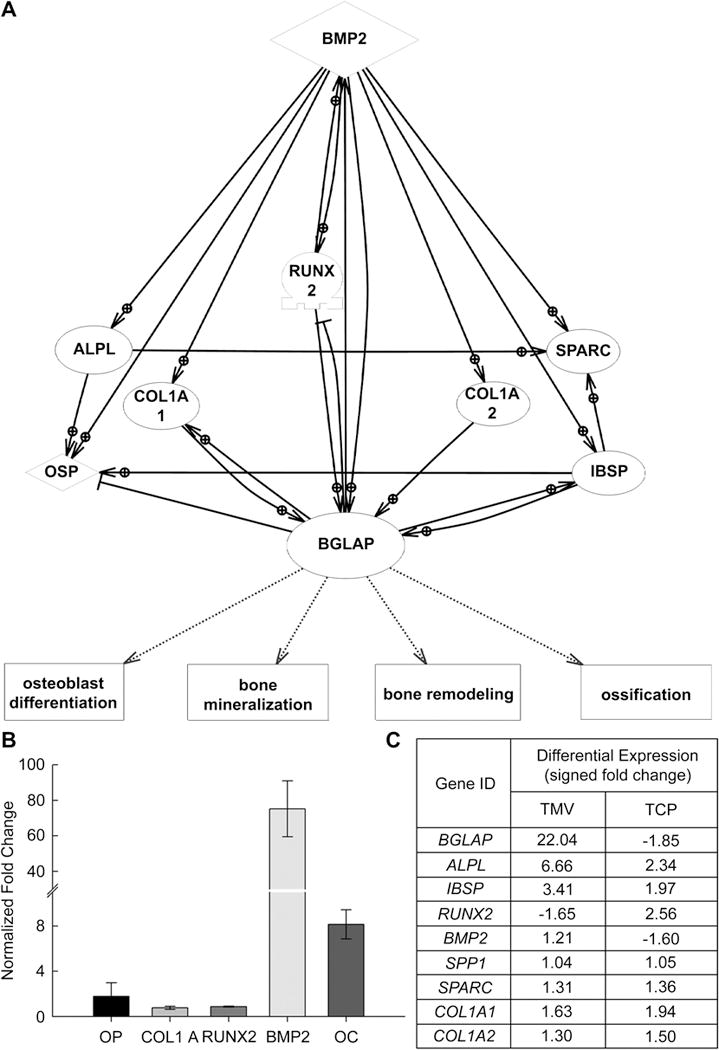
(A) Network of osteogenic specific proteins regulated by BMP2 signaling. (B) RT-qPCR generated profile for the normalized expression of genes after 1 day of osteogenic induction on TMV coated substrates (normalized with respect to TCP, day 1). (C) Differential expression of the genes shown in the pathway calculated via gene array analyses.
Bone regulation genes such as bone morphogenic protein 2 (BMP2), which is known to be associated with stem cell differentiation, also showed an upregulation on TMV coated substrates and was downregulated on TCP (Fig. 4C). This suggested that perhaps the cell grown on TMV coated substrates were mediated by BMP2 induced signaling for differentiation. We developed a putative signaling pathway consisting of genes involved in direct regulation of osteogenesis through BMP2 signaling. As shown in Figure 4A, BMP2 promotes the regulation of genes such as collagen 1A1 (col1A1), collagen1A2 (col1A2), osteonectin (SPARC), osteopontin (SPP1) and osteocalcin (BGLAP). As listed in Figure 4C, the expression of all the above mentioned genes is similar on both the TMV coated substrates and flat substrates, except for BMP2 and osteocalcin (BGLAP). This intrigued the proposition that it could be the cell-TMV interactions which regulate BMP2 mediated speedy osteogenic differentiation and mineralization of the cells. To support our hypothesis, we studied gene expression profile of both BMP2 and osteocalcin (BGLAP) after 1 day of osteogenic induction of the cells. RT-qPCR analysis showed 72 fold upregulation in BMP2 gene expression on TMV coated substrates when normalized against flat TCP (Fig. 4B)
4. Discussion
In this study we compared the osteogenic differentiation of BMSCs on TMV nanorods and flat uncoated TCP. The initial cell spreading on TMV showed that cells adhered and acquired a well-spread morphology on TMV coated wafers under serum free conditions. The cellular morphology after 24 hrs resembled cells grown under complete serum media depicting the cells were viable (Fig. 2A). Further structural analysis with SEM showed that the cells anchored onto the TMV surface via filopodia like extensions and initiated intercellular contacts rendering them competent for matrix biosynthesis (Fig. 2C–D). Additionally, we studied the differential gene expressions of BMSCs during osteogenic differentiation on TMV coated nanotopographies and flat TCP surfaces. According to RT-qPCR analysis, all the osteo-specific genes were upregulated during the course of osteogenesis including osteocalcin (BGLAP), collagen1A1 (col1A1), osteopontin (SPP1), osteonectin (SPARC) and runx2 (RUNX2); however, the temporal expression patterns were surface-specific. On TMV coated substrates, cells showed maximal upregulation of osteogenic genes at 14 days, particularly osteocalcin (BGLAP), whereas on flat TCP it achieved a maximum expression level at 21 days. These results suggest an early maturation of cells and mineralization of matrix on TMV coated substrates by 7 days when compared with flat TCP, an observation consistent with our previous findings with another bio-nanoparticle [28]. The early development of mature osteoblast like cells on nanotopographic surfaces suggest that cells recognize the ECM mimicking nanostructures and perform differently in the nano/micro environments as compared to flat surfaces. These nanotopographic signals result in higher and earlier expression of differentiation-related genes advancing the entire process to complete in 14 days which can be insightful in developing future biomaterials for various bone implants.
Differentiation of BMSCs toward an osteogenic lineage is regulated by a sequence of activities synchronized by transcription factors and signaling proteins, which govern the sequential expression of vital genes during the process. For every differentiation pathway two critically significant instants occur at the initiation of differentiation and its concluding phase [44]. During osteogenesis the terminal stages of differentiation are marked by phenotypic change in the cells which was confirmed by immunostaining of the cells cultured for 7, 14 and 21 days. As the culture progressed the cells acquire a more polygonal shape (Fig. 3B). The expression profiles for the tested osteo-specific genes were found to be consistent with RT-qPCR results. At day 14 on TMV coated wafers, most of the mature cells aggregated together to form sheet-like structures which stained positive for all the osteo-specific genes tested as well as alizarin red to detect calcium rich deposits (Fig. 3C). The staining results demonstrated that the cells constituting the sheets were fully mature as they showed maximum intensity of alizarin red and osteocalcin (BGLAP) staining.
In order to investigate deeper into global gene expression response at 14 days, we performed gene arrays on cells plated on TCP and TMV. During the initial growth phase cells express genes such as collagens required for ECM biosynthesis, however, they gradually become down regulated as the culture progress and remain at constant low levels during subsequent phases of osteogenic differentiation [34]. This expression pattern was confirmed for collagen1A1 (col1A1) by RT-qPCR analysis over a period of 21 days. Gene array analysis at time point of 14 days also revealed that the differential expression of collagen1A1 (col1A1) and collagen1A2 (col1A2) was positive and similar on both TMV and TCP coated surfaces (Fig. 4C) indicating the active biosynthesis and remodeling of extracellular matrix components by differentiating cells.
A group of genes showed higher differential expression on TMV coated substrates compared to TCP. One such gene was alkaline phosphatase (ALPL), a protein associated with osteoblast cell phenotype. As known in the literature, post proliferation, every differentiating cell becomes alkaline phosphatase (ALPL) positive (Fig. 3C–i inset) and activity increases as the culture progresses towards mineralization phase [34, 39]. As detected by microarray analysis the expression of ALPL was three times higher in cells differentiating on TMV as compared to TCP, which suggests a higher differentiation rate on TMV nanorod coated surfaces (Fig. 4C). Another important gene identified in pre-osteoblast like cells is osteopontin (SPP1), which was initially expressed during proliferation phase, subsequently downregulated post-proliferation, and then its expression rises again with the onset of mineralization. A consistent level of osteopontin (SPP1) during the differentiation of BMSCs as observed by RT-qPCR at selected time points can be attributed to the nature of this phosphoprotein which directs the relation between cells and ECM, firstly, through its RGD containing domains, helping in initial cell attachment during proliferation and later via ortho-phosphoserine units which serve as putative calcium binding domain during mineralization [35, 36, 39]. As confirmed by microarrays a similar up regulation was observed at 14 days on both surfaces (Fig. 4C).
As the cells progress toward the maturation and ECM remodeling phase, genes involved in mineralization are maximally expressed. Of these, osteocalcin (BGLAP) is regarded as the most specific marker of mature osteoblasts, hence it becomes crucial to explore the expression of genes and factors encoding for osteocalcin [34–36]. Osteocalcin (BGLAP) is a calcium binding protein, gets accumulated in mineralized bone and bind actively to hydroxyapatite crystals promoting bone crystal growth [34]. It actively controls the process of ossification, ECM remodeling and maturation. Based on RT-qPCR analysis, we observed maximum upregulation in osteocalcin (BGLAP) expression in cells grown on TMV around 14 days suggesting complete mineralization of cells. Our micro-array analysis further corroborated with our results showing a 22-fold upregulation in the expression of osteocalcin (BGLAP) in cells grown on TMV as compared to TCP where it was down regulated after 14 days in culture. Another widely studied protein which actively plays a role in mineralization is integrin binding bone sialo protein (IBSP). Bone sialo protein (IBSP) is an RGD containing phosphoprotein which contains a negatively charged domain responsible for its strong binding with hydroxyapatite [46]. Its expression is restricted to mineralized cells and has been associated with induction of hydroxyapatite formation. As shown in the regulatory pathway (Fig. 4A), osteocalcin (BGLAP) directly promotes the regulation of integrin binding bone sialo protein (IBSP) which showed a 2-fold upregulation in cells differentiated on TMV over TCP, further confirming that the cells were undergoing early mineralization on the nanorod substrate. Among other bone related genes, osteomodulin (OMD) is strongly expressed during osteogenesis [47, 48] and decorin (DCN) which binds effectively with collagen I and plays a role in extracellular matrix assembly [49, 50] showed much higher up regulation on TMV coated substrates as compared to TCP.
Another important class of proteins that play a significant role in skeletal remodeling is bone morphogenetic proteins (BMPs). BMPs were originally identified for their ability to induce ectopic bone formation [51]. More than 20 BMPs have been identified and classified into multiple subgroups based on their structure and function [51]. Recent findings suggest that BMP2 plays a crucial role in stimulating mesenchymal stem cells to undergo differentiation and is associated with osteogenic commitment and differentiation [52]. Many studies have been conducted into knowing the exact mechanism of osteogenic differentiation of cells; one of the proposed pathways is that addition of BMP2 into the induction media triggers the signaling of the genes responsible for osteocalcin (BGLAP) synthesis [53–55]. However, studies demonstrating the effect of topography on BMP2 gene expression are limited. Comparison of BMP2 expression in differentiating cells after 14 days showed an upregulation in expression in cells grown on TMV, whereas cells grown on TCP showed a downregulation in its expression, an observation that likely contributes to the phenotypic differences observed in cells plated on nanorod containing surfaces (Fig. 4C). Other genes coding for BMP receptor signaling and differentiation are presented in Table 1. In order to begin to unravel the regulatory relationships between genes involved in surface-specific mediated osteogenic differentiation we have created a signaling network genes regulated by BMP2 signaling. These were selected based on their differential expression levels and/or knowledge of function and a pathway was constructed revealing their potential regulation, promotion and interrelationships. This pathway shows that a synchronized effort of various genes through BMP2 signaling regulates the expression of osteocalcin (BGLAP) which in turn promotes processes of bone mineralization and ossification (Figure 4 A). This pathway further demonstrates that cells grown on TMV coated substrates activate osteocalcin (BGLAP) regulation through BMP signaling early on than uncoated flat surface, without the addition of any protein factors in the induction media. To substantiate our findings the changes in expression of BMP2 and osteocalcin (BGLAP) was studied near the beginning of the cell culture after 1 day of induction. Both the genes were upregulated many folds on TMV as compared to TCP. All these findings imply that the early regulation of osteocalcin (BGLAP) through BMP signaling is based on initial cues generated by the cell-substrate interactions. The nanoenvironment generated by TMV nanorods, mimicking the natural ECM components structure, show an early maturation and mineralization of BMSCs induced under osteogenic conditions. Our future studies will focus on investigating the regulation of other genes and transcription factors upregulated during initial contact of the cells with TMV nanosurface and their relation in triggering osteogenesis through BMP signaling. The unique nature of TMV particles further presents the opportunity to build up specific ligand display on its surface by which we can further promote BMSCs differentiation towards not only osteogenesis but also other cell lineages.
5. CONCLUSIONS
In the present study we have demonstrated the gene responses on nanofeatured TMV coated substrates and flat TCP under osteogenic induction of BMSCs. Our data indicate that the presence of TMV nanorods on the 2D substrates significantly affected the expression levels of genes involved in osteo-differentiation and subsequent cell behavior. The gene expression was corroborated by immunostaining and DNA micro arrays. From the array data we further explored into specific genes involved in promoting osteogenic differentiation. Additionally, we showed that the BMP2 is one of the crucial genes involved in the regulation of osteogenic differentiation of BMSCs on nano-topographic substrates as compared to flat surfaces. All the data signifies that nanoenvironment generated by TMV nanorod coating supports and promotes the osteogenic differentiation process inducing an early onset of mineralization by seven days. Further investigation into other genes and pathway regulated by BMP2 signaling is currently in progress.
Acknowledgments
We are grateful for financial support from US NSF (DMR-0706431, CHE-0748690), the Alfred P. Sloan Foundation, the Camille Dreyfus Teacher-Scholarship, the US DoD, and the W. M. Keck Foundation. We would also like to acknowledge Dr. Pierre Rivailler for the help of the data interpretation for micro-array studies, and Drs. Zhongwei Niu and Michael Bruckman for TMV purification.
Footnotes
Publisher's Disclaimer: This is a PDF file of an unedited manuscript that has been accepted for publication. As a service to our customers we are providing this early version of the manuscript. The manuscript will undergo copyediting, typesetting, and review of the resulting proof before it is published in its final citable form. Please note that during the production process errors may be discovered which could affect the content, and all legal disclaimers that apply to the journal pertain.
References
- 1.Mackay AM, Beck SC, Pittenger MF. Human mesenchymal stem cells progress to hypertrophic chondrocytes under specific conditions in vitro. Mol Biol Cell. 1998;9:173a–173a. [Google Scholar]
- 2.Mackay AM, Beck SC, Murphy JM, Barry FP, Chichester CO, Pittenger MF. Chondrogenic differentiation of cultured human mesenchymal stem cells from marrow. Tissue Eng. 1998;4(4):415–428. doi: 10.1089/ten.1998.4.415. [DOI] [PubMed] [Google Scholar]
- 3.Ferrari G. Skeletal muscle regeneration by bone marrow-derived myogenic progenitors. Science. 1998;281(5379):923–923. doi: 10.1126/science.279.5356.1528. [DOI] [PubMed] [Google Scholar]
- 4.Calvert JW, Marra KG, Cook L, Kumta PN, DiMilla PA, Weiss LE. Characterization of osteoblast-like behavior of cultured bone marrow stromal cells on various polymer surfaces. J Biomed Mater Res. 2000;52(2):279–284. doi: 10.1002/1097-4636(200011)52:2<279::aid-jbm6>3.0.co;2-8. [DOI] [PubMed] [Google Scholar]
- 5.Benayahu D, Kletter Y, Zipori D, Wientroub S. Bone-Marrow Derived Stromal Cell-Line Expressing Osteoblastic Phenotype Invitro and Osteogenic Capacity Invivo. J Cell Physiol. 1989;140(1):1–7. doi: 10.1002/jcp.1041400102. [DOI] [PubMed] [Google Scholar]
- 6.Nesti LJ, Jackson WM, Shanti RM, Koehler SM, Aragon AB, Bailey JR, et al. Differentiation Potential of Multipotent Progenitor Cells Derived from War-Traumatized Muscle Tissue. J Bone Joint Surg Am. 2008;90A(11):2390–2398. doi: 10.2106/JBJS.H.00049. [DOI] [PMC free article] [PubMed] [Google Scholar]
- 7.Jiang YH, Jahagirdar BN, Reinhardt RL, Schwartz RE, Keene CD, Ortiz-Gonzalez XR, et al. Pluripotency of mesenchymal stem cells derived from adult marrow. Nature. 2002;418(6893):41–49. doi: 10.1038/nature00870. [DOI] [PubMed] [Google Scholar]
- 8.Pittenger MF, Mackay AM, Beck SC, Jaiswal RK, Douglas R, Mosca JD, et al. Multilineage potential of adult human mesenchymal stem cells. Science. 1999;284(5411):143–147. doi: 10.1126/science.284.5411.143. [DOI] [PubMed] [Google Scholar]
- 9.Minguell JJ, Erices A, Conget P. Mesenchymal stem cells. Exp Biol Med. 2001;226(6):507–520. doi: 10.1177/153537020122600603. [DOI] [PubMed] [Google Scholar]
- 10.Sanchez-Ramos JR, Song SJ, Cardozo-Pelaez F, Hazzi C, Willing A, Saporta S, et al. Bone marrow stromal cells grafted into adult rat brain migrate, organize in architectonic patterns and express neuronal markers. Neurology. 1999;52(6):A14–A14. [Google Scholar]
- 11.Kopen GC, Prockop DJ, Phinney DG. Marrow stromal cells migrate throughout forebrain and cerebellum, and they differentiate into astrocytes after injection into neonatal mouse brains. Proc Natl Acad Sci USA. 1999;96(19):10711–10716. doi: 10.1073/pnas.96.19.10711. [DOI] [PMC free article] [PubMed] [Google Scholar]
- 12.Eglitis MA, Dawson D, Park KW, Mouradian MM. Targeting of marrow-derived astrocytes to the ischemic brain. Neuroreport. 1999;10(6):1289–1292. doi: 10.1097/00001756-199904260-00025. [DOI] [PubMed] [Google Scholar]
- 13.Pu FR, Rhodes NP, Lefranc O, Codoro C, Bayon Y, Gravagna P, et al. Myogenic differentiation of bone marrow stem cells in response to novel PLLA-collagen scaffolds. Tissue Eng. 2007;13(7):1733–1733. [Google Scholar]
- 14.Technau A, Ebelt H, Braun T. Bone marrow derived human mesenchymal stem cells have the potential for myogenic differentiation both in vivo and in vitro. Eur Heart J. 2003;24:225–225. [Google Scholar]
- 15.Ferrari G, Mavilio F. Myogenic stem cells from the bone marrow: a therapeutic alternative for muscular dystrophy? Neuromuscular Disord. 2002;12:S7–S10. doi: 10.1016/s0960-8966(02)00102-5. [DOI] [PubMed] [Google Scholar]
- 16.Wakitani S, Saito T, Caplan AI. Myogenic Cells Derived from Rat Bone-Marrow Mesenchymal Stem-Cells Exposed to 5-Azacytidine. Muscle Nerve. 1995;18(12):1417–1426. doi: 10.1002/mus.880181212. [DOI] [PubMed] [Google Scholar]
- 17.Ferrari G, Cusella-De Angelis G, Coletta M, Paolucci E, Stornaiuolo A, Cossu G, et al. Muscle regeneration by bone marrow derived myogenic progenitors. Science. 1998;279(5356):1528–1530. doi: 10.1126/science.279.5356.1528. [DOI] [PubMed] [Google Scholar]
- 18.Bianco P, Riminucci M, Gronthos S, Robey PG. Bone marrow stromal stem cells: Nature, biology, and potential applications. Stem Cells. 2001;19(3):180–192. doi: 10.1634/stemcells.19-3-180. [DOI] [PubMed] [Google Scholar]
- 19.Arnold M, Cavalcanti-Adam EA, Glass R, Blummel J, Eck W, Kantlehner M, et al. Activation of integrin function by nanopatterned adhesive interfaces. Chemphyschem. 2004;5(3):383–388. doi: 10.1002/cphc.200301014. [DOI] [PubMed] [Google Scholar]
- 20.Berry C, McCloy D, Affrossman S. Endothelial cell response to narrow diameter nylon tubes exhibiting internal nanotopography. Curr Nanosci. 2008;4(2):219–223. [Google Scholar]
- 21.He J, Zhou W, Zhou XJ, Zhong XX, Zhang XL, Wan PB, et al. The anatase phase of nanotopography titania plays an important role on osteoblast cell morphology and proliferation. J Mater Sci Mater Med. 2008;19(11):3465–3472. doi: 10.1007/s10856-008-3505-3. [DOI] [PubMed] [Google Scholar]
- 22.Mendonca G, Mendonca DBS, Aragao FJL, Cooper LF. Advancing dental implant surface technology - From micron- to nanotopography. Biomaterials. 2008;29(28):3822–3835. doi: 10.1016/j.biomaterials.2008.05.012. [DOI] [PubMed] [Google Scholar]
- 23.Liu QH, Cen L, Yin S, Chen L, Liu GP, Chang J, et al. A comparative study of proliferation and osteogenic differentiation of adipose-derived stem cells on akermanite and beta-TCP ceramics. Biomaterials. 2008;29(36):4792–4799. doi: 10.1016/j.biomaterials.2008.08.039. [DOI] [PubMed] [Google Scholar]
- 24.Bashur CA, Dahlgren LA, Goldstein AS. Effect of fiber diameter and orientation on fibroblast morphology and proliferation on electrospun poly(D,L-lactic-co-glycolic acid) meshes. Biomaterials. 2006;27(33):5681–5688. doi: 10.1016/j.biomaterials.2006.07.005. [DOI] [PubMed] [Google Scholar]
- 25.Dalby MJ, Gadegaard N, Wilkinson CDW. The response of fibroblasts to hexagonal nanotopography fabricated by electron beam lithography. J Biomed Mater Res A. 2008;84A(4):973–979. doi: 10.1002/jbm.a.31409. [DOI] [PubMed] [Google Scholar]
- 26.Stevens MM, George JH. Exploring and engineering the cell surface interface. Science. 2005;310(5751):1135–1138. doi: 10.1126/science.1106587. [DOI] [PubMed] [Google Scholar]
- 27.Draghi L, Cigada A. Nanostructured surfaces for biomedical applications. Part I: nanotopography. J Appl Biomater. 2007;5(2):61–69. [PubMed] [Google Scholar]
- 28.Kaur G, Valarmathi MT, Potts JD, Wang Q. The promotion of osteoblastic differentiation of rat bone marrow stromal cells by a polyvalent plant mosaic virus. Biomaterials. 2008;29(30):4074–4081. doi: 10.1016/j.biomaterials.2008.06.029. [DOI] [PubMed] [Google Scholar]
- 29.Bruckman MA, Kaur G, Lee LA, Xie F, Sepulvecla J, Breitenkamp R, et al. Surface modification of tobacco mosaic virus with “Click” chemistry. Chembiochem. 2008;9(4):519–523. doi: 10.1002/cbic.200700559. [DOI] [PubMed] [Google Scholar]
- 30.Niu ZW, Bruckman MA, Li SQ, Lee LA, Lee B, Pingali SV, et al. Assembly of tobacco mosaic virus into fibrous and macroscopic bundled arrays mediated by surface aniline polymerization. Langmuir. 2007;23(12):6719–6724. doi: 10.1021/la070096b. [DOI] [PubMed] [Google Scholar]
- 31.Pennazio S, Roggero P. The discovery of the chemical nature of tobacco mosaic virus. Riv Biol. 2000;93(2):253–281. [PubMed] [Google Scholar]
- 32.Wang XN, Niu ZW, Li SQ, Wang Q, Li XD. Nanomechanical characterization of polyaniline coated tobacco mosaic virus nanotubes. J Biomed Mater Res A. 2008;87A(1):8–14. doi: 10.1002/jbm.a.31617. [DOI] [PubMed] [Google Scholar]
- 33.Young M, Willits D, Uchida M, Douglas T. Plant viruses as biotemplates for materials and their use in nanotechnology. Annu Rev Phytopathol. 2008;46:361–384. doi: 10.1146/annurev.phyto.032508.131939. [DOI] [PubMed] [Google Scholar]
- 34.Owen TA, Aronow M, Shalhoub V, Barone LM, Wilming L, Tassinari MS, et al. Progressive Development of the Rat Osteoblast Phenotype Invitro - Reciprocal Relationships in Expression of Genes Associated with Osteoblast Proliferation and Differentiation during Formation of the Bone Extracellular-Matrix. J Cell Physiol. 1990;143(3):420–430. doi: 10.1002/jcp.1041430304. [DOI] [PubMed] [Google Scholar]
- 35.Stein GS, Lian JB, Owen TA. Relationship of Cell-Growth to the Regulation of Tissue-Specific Gene-Expression during Osteoblast Differentiation. FASEB J. 1990;4(13):3111–3123. doi: 10.1096/fasebj.4.13.2210157. [DOI] [PubMed] [Google Scholar]
- 36.Stein GS, Lian JB, Gerstenfeld LG, Shalhoub V, Aronow M, Owen T, et al. The Onset and Progression of Osteoblast Differentiation Is Functionally Related to Cellular Proliferation. Connect Tissue Res. 1989;20(1–4):3–13. doi: 10.3109/03008208909023869. [DOI] [PubMed] [Google Scholar]
- 37.Lian JB, Stein GS. Concepts of Osteoblast Growth and Differentiation - Basis for Modulation of Bone Cell-Development and Tissue Formation. Crit Rev Oral Biol Med. 1992;3(3):269–305. doi: 10.1177/10454411920030030501. [DOI] [PubMed] [Google Scholar]
- 38.Pfaffl MW, Horgan GW, Dempfle L. Relative expression software tool (REST (c)) for group-wise comparison and statistical analysis of relative expression results in real-time PCR. Nucleic Acids Res. 2002;30(9):e36. doi: 10.1093/nar/30.9.e36. [DOI] [PMC free article] [PubMed] [Google Scholar]
- 39.Pockwinse SM, Wilming LG, Conlon DM, Stein GS, Lian JB. Expression of Cell-Growth and Bone Specific Genes at Single Cell Resolution during Development of Bone Tissue-Like Organization in Primary Osteoblast Cultures. J Cell Biochem. 1992;49(3):310–323. doi: 10.1002/jcb.240490315. [DOI] [PubMed] [Google Scholar]
- 40.Thomas SM, Burke JF. Affymetrix: genes on chips. Expert Opin Ther Pat. 1998;8(5):503–508. [Google Scholar]
- 41.Wang J, Gelbert L, Geringer CD, Cook TG, Konkol DL, Yu L, et al. Affymetrix gene chip analysis of differentially expressed genes in rat post MI CHF model. J Mol Cell Cardiol. 2002;34(7):A11–A11. [Google Scholar]
- 42.Subramanian A, Tamayo P, Mootha VK, Mukherjee S, Ebert BL, Gillette MA, et al. Gene set enrichment analysis: A knowledge-based approach for interpreting genome-wide expression profiles. Proc Natl Acad Sci USA. 2005;102(43):15545–15550. doi: 10.1073/pnas.0506580102. [DOI] [PMC free article] [PubMed] [Google Scholar]
- 43.For Fold change > 1, Signed fold change = fold change and for Fold Change <1, signed fold change = −1/Fold Change.
- 44.Kozhevnikova MN, Mikaelyan AS, Starostin VI. Molecular and genetic regulation of osteogenic differentiation of mesenchymal stromal cells. Biol Bull. 2008;35(3):223–232. [PubMed] [Google Scholar]
- 45.Boskey AL. Noncollagenous Matrix Proteins and Their Role in Mineralization. Bone and Miner. 1989;6(2):111–123. doi: 10.1016/0169-6009(89)90044-5. [DOI] [PubMed] [Google Scholar]
- 46.Ogata Y. Bone sialoprotein and its transcriptional regulatory mechanism. J Periodontal Res. 2008;43(2):127–135. doi: 10.1111/j.1600-0765.2007.01014.x. [DOI] [PubMed] [Google Scholar]
- 47.Wendel M, Sommarin Y, Heinegard D. Bone matrix proteins: Isolation and characterization of a novel cell-binding keratan sulfate proteoglycan (osteoadherin) from bovine bone. J Cell Biol. 1998;141(3):839–847. doi: 10.1083/jcb.141.3.839. [DOI] [PMC free article] [PubMed] [Google Scholar]
- 48.Sommarin Y, Wendel M, Shen ZX, Hellman U, Heinegard D. Osteoadherin, a cell-binding keratan sulfate proteoglycan in bone, belongs to the family of leucine-rich repeat proteins of the extracellular matrix. J Biol Chem. 1998;273(27):16723–16729. doi: 10.1074/jbc.273.27.16723. [DOI] [PubMed] [Google Scholar]
- 49.Raspanti M, Viola M, Sonaggere M, Tira ME, Tenni R. Collagen fibril structure is affected by collagen concentration and decorin. Biomacromolecules. 2007;8(7):2087–2091. doi: 10.1021/bm070091t. [DOI] [PubMed] [Google Scholar]
- 50.Miqueloto CA, Zorn TM. Characterization and distribution of hyaluronan and the proteoglycans decorin, biglycan and perlecan in the developing embryonic mouse gonad. J Anat. 2007;211(1):16–25. doi: 10.1111/j.1469-7580.2007.00741.x. [DOI] [PMC free article] [PubMed] [Google Scholar]
- 51.Wu Xiangwei, S W, Cao Xu. Multiplicity of BMP signaling in skeletal development. Ann NY Acad Sci. 2007;1116:29–49. doi: 10.1196/annals.1402.053. [DOI] [PubMed] [Google Scholar]
- 52.He T-C. Ditstinct osteogenic activity of BMPs and their orthopaedic applications. J Musculaskelet Neuronal Interact. 2005;5:363–366. [PubMed] [Google Scholar]
- 53.Gazzerro E, Deregowski V, Vaira S, Canalis E. Overexpression of twisted gastrulation inhibits bone morphogenetic protein action and prevents osteoblast cell differentiation in vitro. Endocrinology. 2005;146(9):3875–3882. doi: 10.1210/en.2005-0053. [DOI] [PubMed] [Google Scholar]
- 54.Kearns AE, Goto K, Gianakakos G, Lippmann W, Demay MB. Transcriptional repression of the rat osteocalcin gene: Role of two intronic CCTCCT motifs. Endocrinology. 1999;140(9):4120–4126. doi: 10.1210/endo.140.9.6963. [DOI] [PubMed] [Google Scholar]
- 55.Matsubara T, Kida K, Yamaguchi A, Hata K, Ichida F, Meguro H, et al. BMP2 Regulates Osterix through Msx2 and Runx2 during Osteoblast Differentiation. J Biol Chem. 2008;283(43):29119–29125. doi: 10.1074/jbc.M801774200. [DOI] [PMC free article] [PubMed] [Google Scholar]