Abstract
The special AT-rich sequence-binding protein 2 (SATB2) is a protein that binds to the nuclear matrix attachment region of the cell and regulates gene expression by altering chromatin structure. In our previous study, we reported that SATB2 gene expression was induced in human bronchial epithelial BEAS-2B cells transformed by arsenic, chromium, nickel and vanadium. In this study , we show that ectopic expression of SATB2 in the normal human bronchial epithelial cell-line BEAS-2B increased anchorage-independent growth and cell migration, meanwhile, shRNA – mediated knockdown of SATB2 significantly decreased anchorage-independent growth in Ni transformed BEAS-2B cells. RNA sequencing analyses of SATB2 regulated genes revealed the enrichment of those involved in cytoskeleton, cell adhesion and cell-movement pathways. Our evidence supports the hypothesis that SATB2 plays an important role in BEAS-2B cell transformation.
Keywords: SATB2, metal carcinogenesis, cell migration
Introduction
The special AT-rich sequence-binding protein 2 (SATB2) gene is located on chromosome 2, spans 191 kilobases, and encodes a 82.5 kDa protein. First reported in 2003, SATB2 is a member of the SATB transcription factor family that binds to AT-rich sequences in the nuclear matrix [1] and regulates gene expression by orchestrating chromatin organization and remodeling. Subsequent findings showed that SATB2 is involved in skeletogenesis [2] and neuronal development [3]. The expression of SATB2 in adult tissues is restricted to the brain and lower gastrointestinal tract [4]. However, the role SATB2 plays in cancer development and prognosis seems to be tumor-specific. In a laryngeal squamous cell carcinoma study, lower expression of SATB2 was correlated with a more advanced tumor grade and higher tumor recurrence rate, and overexpression of SATB2 reduced the tumorigenicity of HEp2 cells in vitro and in vivo [5]. In colorectal cancer, high expression of SATB2 is associated with a favorable prognosis and increased sensitivity to radiation and chemotherapy [6], and overexpression of SATB2 in DLD-1 cells reduced anchorage-independent growth and tumor size when injected to nude mice [7], indicating a tumor suppressor role for SATB2. On the other hand, high SATB2 expression was observed in osteoscarcoma tumors cells, and migration and invasion was decreased by SATB2 knockdown [7, 8]. Moreover, in a breast cancer study, SATB2 mRNA expression was associated with increased tumor grade and poor overall survival [9] indicating a tumor promoting activity.
In our previous study [10], we analyzed transformation of the immortalized normal human bronchial epithelial cell-line BEAS-2B by 4 metals, including nickel (Ni), hexavalent chromium (Cr), arsenic (As) and vanadium (V). Among these metals, Ni, As and Cr are known carcinogens associated with many types of cancer in humans [11, 12], and V can function as a tumor promoter of mice lung cancer [13]. While each of these metals has their own unique gene expression signature in transformed BEAS-2B cells, the expression of SATB2 is uniformly increased in every metal transformed clones [10]. Given the gaps in our understanding of metals carcinogenesis, investigating the role that SATB2 plays in the cellular transformation could elucidate the mechanisms involved in this process.
Materials and Methods
Cell Culture
The BEAS-2B immortalized human bronchial epithelial cell line was obtained from the American Type Culture Collection (ATCC, Manassas, VA) and maintained in Dulbecco's Modified Eagle Medium (DMEM, Invitrogen, Grand Island, NY) supplemented with 10% heat-inactivated fetal bovine serum ( FBS, Atlanta Biologicals, Lawrenceville, GA) and 1% of penicillin/streptomycin (GIBCO, Grand Island, NY). The cells were routinely cultured at 37°C with 5% CO2.
Stable transfection of SATB2
The full-length human SATB2 cDNA cloned into the pcDNA3.1 vector was kindly provided by Dr. Rudolf Grosschedl (Max Planck Institute of Immunobiology and Epigenetics). BEAS-2B cells were transfected with pcDNA3.1 vector or pcDNA3.1-SATB2 DNA using Lipofectamine® LTX Reagent with PLUS™ Reagent (Life technologies, New York, NY) according to manufacturer's protocol. Briefly, when cells reached 80–90% confluency in a 6-well plate, transfection was carried out. For each transfection well, 2.5 μg of plasmid DNA combined with 2.5 μl of PLUS reagent in 150 μl of serum-free media. This was then combined with a mixture of 10 μl Lipofectamine LTX in 150 μl serum free media. This final mixture was then incubated for 5 min before being added to the cells. Forty-eight hour after transfection, cells were harvested and plated in two 10 cm2 tissue culture dishes with fresh medium containing G418 (500 μg/ml, GIBCO BRL, Gaithersburg, MD). Colonies were picked and expanded after two weeks of selection.
Small Interfering RNA (shRNA) Transfection
Ni transformed BEAS-2B cells (Ni-BEAS-2B) were cultured in Dulbeco's modified Eagle medium (DMEM) with 10% FBS and 1% penicillin/streptomycin. Four SATB2 shRNAs (TG301833A, B, C and D) and scramble control shRNA plasmid (TR30013) were purchased from OriGene (Rockville, MD). The sequences of these four construct were as follows: shSATB2-A: 5’-TCCGCAATGCCTTAAAGGAACTGCTCAAA-3’; shSATB2-B: 5’-GTTCAAAGTTGGAAGACTTGCCTGCGGAG-3’; shSATB2-C: 5’-TGAACCAGAGCACATTAGCCAAAGAATGC-3’; shSATB2-D: 5’-AATGTGTCAGCAACCAAGTGCCAGGAGTT-3’.
The knockdown transfection was performed using PolyJet DNA In Vitro Transfection Reagent (SignaGen Laboratories, Toronto, Ontario, Canada) following the manufacturer's protocol. The cells were placed under selection with 0.5 ug/ml puromycin for one week and harvested for western blot and real-time qPCR analysis.
Soft Agar Assay
Anchorage-independent growth was tested by the ability of cells to grow in soft agar. In brief, a bottom layer of 0.5% 2-hydroxyethylagarose (Type VII low gelling temperature, Sigma-Aldrich, St Louis, MO) and a top layer of 5000 cells in 0.35% 2-hydroxyethylagarose was placed in a 6-well non-treated polystyrene plate. After three weeks, individual colonies were picked from the agar for growth or the wells were stained with 0.005% crystal violet solution in PBS containing 10% methanol. Images of each stained well were scanned using a Bio-Rad Molecular Imager Gel-Doc XR+ documentation system and Image Lab software (Biorad, Hercules, CA), and colony numbers were estimated using Image J software with defined particle size of 20-infinity pixel unit and circularity of 0.30-1.00. In addition, when seeding cells into the soft agar plate, 200 cells were simultaneously seeded into a 10 cm2 dish in order to determine the plating efficiency in monolayer culture – defined as the ratio of the number of colonies (formed in cell culture dish) versus the number of cells seeded. After two weeks of incubation, plates were fixed with methanol and stained with 0.05% crystal violet solution, cell colony numbers were determined and plating efficiencies were calculated.
Real-time PCR Analysis
Total RNA was isolated with TRIzol Reagent (Life Technologies, Gaithersburg, MD). Reverse transcription was performed using SuperScript™ III First-Strand Synthesis System for RT-PCR (Invitrogen, Carlsbad, CA). Real time-PCR was performed by using SYBR Select Master Mix (Applied Biosystems, Foster City, CA) on a 7900HT Fast Real-time PCR System (Applied Biosystems). Each sample was run in triplicate. The relative mRNA expression levels were normalized by using GAPDH as the endogenous control. The sequences of primers used to amplify each gene were forward: 5’-TCTCCCCAAACACACCATCA-3’/ reverse: 5’-GCAGCTCCTCGTCCTTATATTCA-3’ for SATB2, and forward: 5’-TGCACCACCAACTGCTTAGC-3’/ reverse: 5’-GGCATGGACTGTGGTCATGA-3’ for GAPDH. The results were analyzed using the 2–ΔΔCT method [14].
Western Blotting Analysis
Cells were lysed with cell extraction buffer (Invitrogen, Camarillo, CA) supplemented with proteinase inhibitor cocktail (Roche Applied Science, Indianapolis, IN). Fifty μg of each protein lysate was loaded and electrophoresed in a 12% SDS-polyacrylamide gel, then transferred to a PVDF membrane. After blocking in 5% skim milk in TBS-T for 2 h at room temperature, the membrane was incubated with SATB2 mouse monoclonal antibody (Abcam, Cambridge, MA., ab51140)502, 1:100) overnight at 4°C, and then probed with HRP labeled goat anti mouse secondary antibody (1:2000) for 1 h at room temperature before the visualization by the chemiluminescene. Quantification of immunodetected proteins was performed using Image J software.
Scratch Test
Cells (1×10⁶) were plated into 35 mm culture dishes with 2 × 2 mm grids (Nunc) on the bottom. Upon reaching confluency, a single scratch was made across the monolayer using a 200 μL pipette tip held perpendicular to the plate bottom. The plate was then gently washed with medium to remove detached cells, and fresh DMEM media containing 2.5% of FBS were added back into the plates. Images were acquired at 0, 5, and 10 h after the scratch using a Nikon digital DS-Fi1-U3 camera unit controlled by NIS-Elements F3.2 software on an Nikon Eclipse TS100 microscope (Nikon Instruments Inc.,Tempe, AZ).
MTS Assay
Cell proliferation was assessed using CellTiter 96 Aqueous Non-Radioactive Cell Proliferation Assay kit (Promega, Madison, WI) to measure the absorbance of formazan, the bioreduced product tetrazolium compound 3-(4,5-dimethylthiazol-2-yl)-5-(3-carboxymethoxyphenyl)-2-(4-sulfo phenyl)-2H-tetrazolium (MTS), which is directly proportional to the number of viable cells in culture. Briefly, 1×10⁴ cells were seeded into each well of 96-well microplates overnight to allow cells to attach and grow for 24 h. Subsequently, 20 μl of the combined MTS/PMS solution was added directly into each well of the 96-well assay plate containing 100 μl of cells in culture medium. The plate was incubated at 37°C for additional 2 h and absorbance at 490 nm was measured using the SpectraMax®M2 Microplate Reader (Molecular Devices®, Sunnyvale, CA). This assay was performed in triplicate.
RNA Sequencing
Total RNA samples from two vector transfected (vector-4 and vector- 5) and two SATB2 transfected (SATB2-3 and SATB2-7, see Figure 1) BEAS-2B clones were converted into cDNA libraries using a Tru-seq RNA Sample Preparation v2 Kit (Illumina, San Diego, CA). Reads were aligned to Ensembl gene model (Homo_sapiens.GRCh37.71.gtf) [15] using HTseq (0.6.1.p.1) [16]. For the statistical analysis, DESeq2 R/Bioconductor package was used and the raw reads counts were normalized by using trimmed mean of M-values normalization method [17]. The common dispersion and statistical significance for genes cross sample groups were estimated and calculated using a general linear model [17]. To obtain adjusted p value for each gene, the FDR method for multiple hypothesis test has been applied to those genes that have the summed reads counts per million (CPM) of all samples greater than 5. In this study, FDR cut off value of 0.10 was used to identify highly relevant SATB2 target genes. The 319 differentially expression gene set were functionally analyzed with three different software/ web-based tools. Biological functions were determined with ToppGene knowledgebase (https://toppgene.cchmc.org/enrichment.jsp), based on GO gene (Gene Ontology) annotations. Molecular pathways were analyzed with KEGG (Kyoto Encyclopedia of Genes and Genomes) ontological terms using Enrichr (http://amp.pharm.mssm.edu/Enrichr/). Functional biological interactions were determined using the Ingenuity Pathways Analysis application (http://analysis.ingenuity.com/pa).
Figure 1.
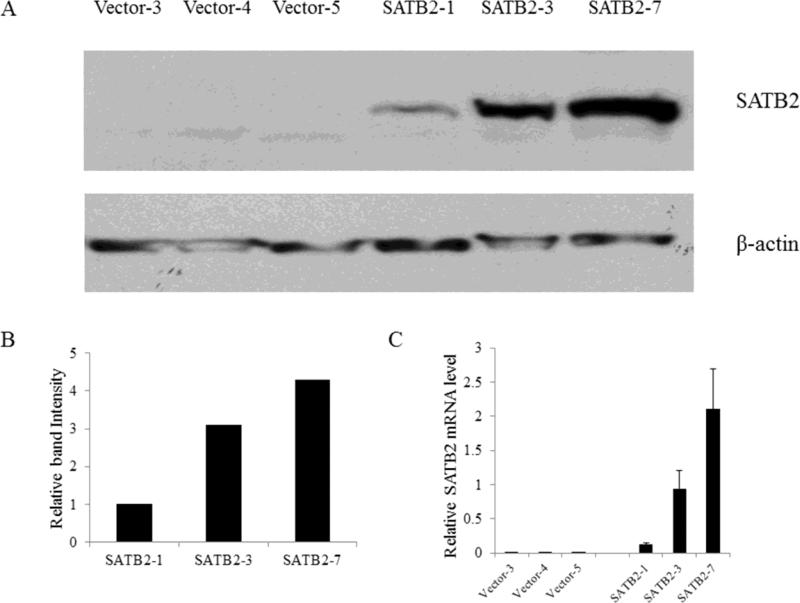
SATB2 expression in selected vector and SATB2 stably-transfected BEAS-2B cell clones. (A). Western blot analysis of SATB2 levels in SATB2-overexpressing cell clones compared with control clones. (B).The intensity of individual band in the western blot was quantified using Image J software and expressed relative to β-actin signal as a control. (C).The relative level of SATB2 mRNA was evaluated by real-time PCR.
Results
Overexpression of SATB2 increased anchorage-independent growth in BEAS-2B cells
The SATB2 expression is tissue-specific, and its expression in lung is very low [18]. To explore the effect of SATB expression on the anchorage –independent growth of BEAS-2B cells, cells were transfected with pcDNA3.1 (vector control) or pcDNA3.1-SATB2 and transfectants were selected with G418. Fifteen G418-resistant SATB2 clones and five vector clones were picked from dishes derived from a single cell while the rest of the cell clones were a group of transfected cells, not derived from single cells and is referred to as “pool transfectant”. The protein and mRNA expression of three SATB2-overexpressing clones and three vector clones are shown in Figure 1, significant levels of SATB2 were produced in the SATB2-overexpressing clones, while SATB2 protein was undetectable in vector transfected cells. SATB2-overexpressing cells showed no morphological change, but they took longer to detach during trypsinization, indicating increased adhesion.
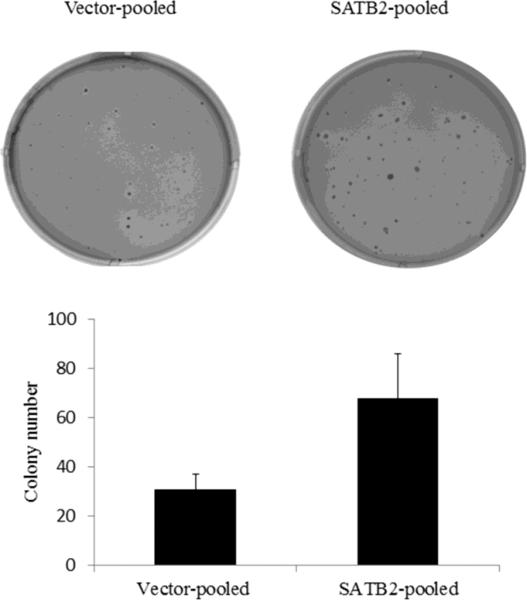
To avoid artifacts resulting from the use of single clones, we seeded the pooled SATB2 and vector transfected clones to soft agar to evaluate their anchorage-independent growth. The mRNA expression of SATB2 in pooled SATB2 -transfected clones was about 6 times higher than pooled vector control clones (data not shown). As shown in Figure 2, the SATB2-expressing clones formed an average of 68 colonies per 5000 cells plated compared to 31 colonies formed when vector control cells were plated, also, the overall colony size of the SATB2 expressing cells was greater than that of the vector transfected cells.
Figure 2.
Stable expression of SATB2 in BEAS-2B cells increased anchorage-independent growth. Pooled BEAS-2B cells stably transfected with pcDNA3.1 vector and pcDNA3.1-SATB2 were subjected to a soft agar assay, and the graph shows mean number of the colonies ± SD from three experiments.
SATB2 Knockdown in Nickel transformed clone reduced anchorage-independent growth
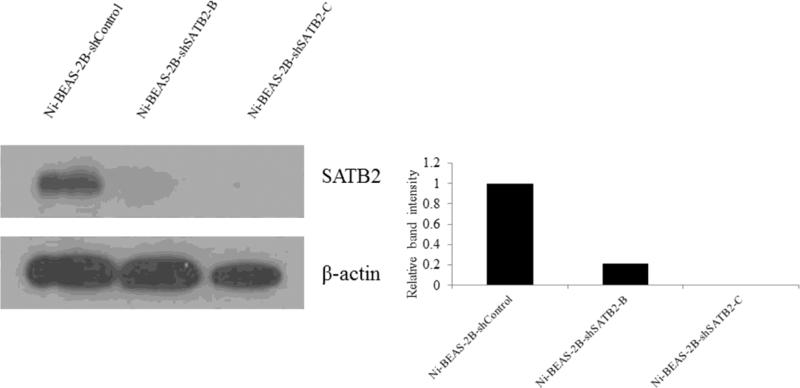
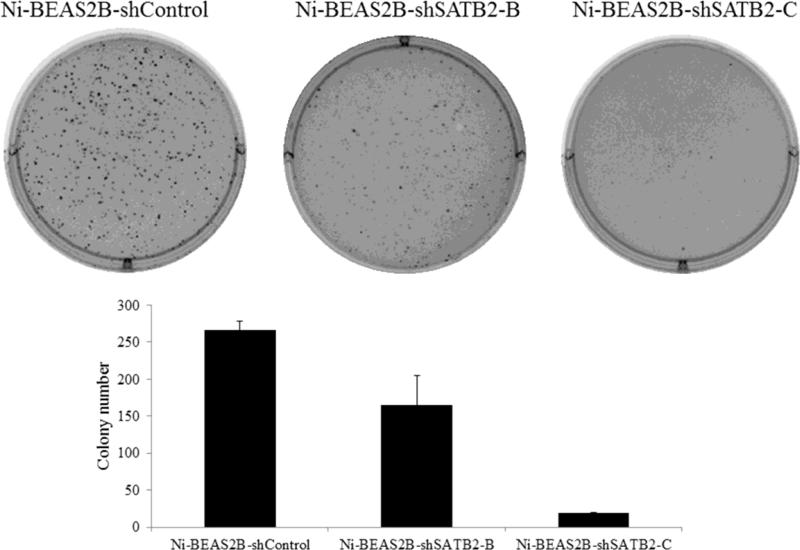
In our previous study [10], 25 metal-transformed clones (7 each for As and Ni, 6 for Cr and 5 for V) were obtained by 30-60 days of metal exposure and subsequent soft agar growth, and Ni transformed clones showed the highest SATB2 induction among these metal transformed clones. We transfected shRNA constructs into a Ni-BEAS-2B that showed highest SATB2 (about 8-fold increase) expression. Among four shSATB2 constructs (A, B, C, D) which target different SATB2 sequences, knockdown efficiency was close to 100% for construct C, ~79% for construct B, respectively (Figure 3, quantified by Image J). Construct A and D did not show significant knockdown efficiency in our study (data not shown). Compared to Ni-BEAS-2B cells, which showed abundant growth in soft agar (Figure 4), significant reduction of colony number in Ni-BEAS-2B transfected with SATB2 shRNA-B (Ni-BEAS-2B-shSATB2-B) and SATB2 shRNA-C (Ni-BEAS-2B-shSATB2-C) were observed (Figure 4).
Figure 3.
Reduced SATB2 expression in Ni-BEAS-2B -shSATB2-B and Ni-BEAS-2B -shSATB2-C cells determined by western blot. The intensity of individual band in the western blot was quantified using Image J software and expressed relative to β-actin signal as a control.
Figure 4.
SATB2 knockdown decreased anchorage-independent growth in Ni-BEAS-2B cells. Ni-BEAS-2B -shSATB2-B, Ni-BEAS-2B -shSATB2-C together with non-target scramble control shRNA transfected Ni-BEAS2B cells were subjected to a soft agar assay, and the graph shows mean number of the colonies ± SD from three experiments.
SATB2 overexpression increased migration in BEAS-2B cells
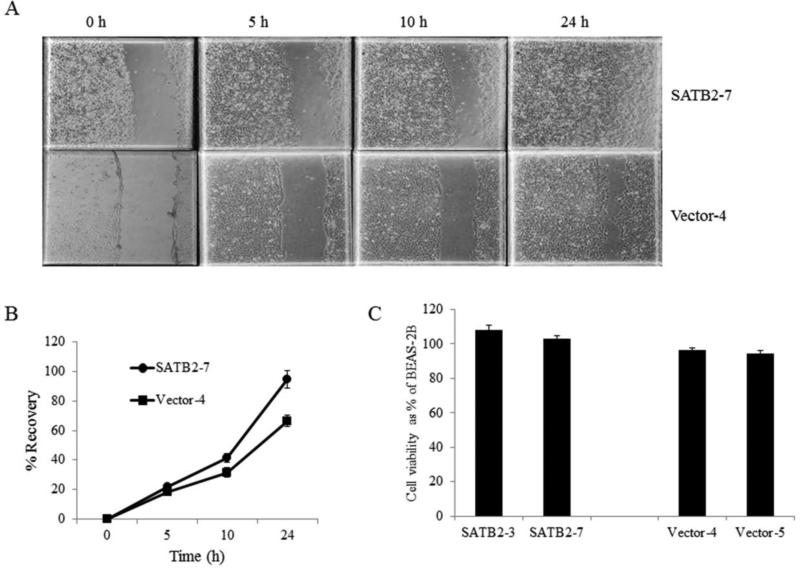
To evaluate cell migration, the scratch tests were performed with two SATB2 transfected clones (SATB2-3 and SATB2-7, see Figure 1) and two vector transfected clones (vector-4 and vector-5). The scratch test results showed that both SATB2 transfected cells were able to heal the wound by 24 h after the scratch was made but neither of the control vector transfected cells were able to heal the wound within 24 h. Representative images (vector-4 and SATB2-7) of the cell migration are shown in Figure 5. To Exclude the possibility that migration differences may reflect variations in the inrate of proliferation, MTS assays were performed and results indicate that the rate of proliferation among these cells were insignificant (Figure 5).
Figure 5.
SATB2 overexpression increased migration in BEAS-2B cells. Confluent monolayers of SATB2 or vector transfected BEAS-2B cells were scratched and cell migration were examined. A. Representative images at different time point post scratch are shown. B. The graph demonstrates % recovery of wounds in SATB2-7 and vector-4. Data represent mean ± SD (n=3). C. MTS assay was performed for SATB2-3, SATB2-7, vector-4 and vector-5. Data represent mean ± SD (n=3).
RNA-sequencing profile of SATB2 exogenous expression clones revealed genes and pathways involved in carcinogenesis
We performed RNA-seq analysis with two SATB2 transfected clones (SATB2-3 and SATB2-7) and two vector transfected clones (vector-4 and vector-5) and identified ≥2.0 fold up- and down- regulation FDR cut off ) of 227 and 92 genes, respectively. A complete gene list is provided in Supplementary Table 1. Raw data are available from the GEO database under access number GSE75652. The average SATB2 mRNA expression level was 4069 fold higher than control, and the top 20 most significant differentially expressed genes are listed in Table 1.
Table 1.
Top twenty genes with the most significant differential expression in SATB2 overexpressed BEAS-2B compared with vector control.
| Gene Name | FDR (False discovery rate) | P-value | Fold change |
|---|---|---|---|
| SATB2 | 6.18E-95 | 3.96E-99 | 4067 |
| RP11-553A10.1 | 1.09E-26 | 1.40E-30 | 3507 |
| OSBPL6 | 3.05E-18 | 5.86E-22 | 1677 |
| AR | 9.27E-18 | 2.38E-21 | 1062 |
| TENM1 | 1.83E-17 | 5.87E-21 | 1050 |
| MFAP5 | 1.93E-16 | 7.42E-20 | 836 |
| ANKRD1 | 3.31E-16 | 1.49E-19 | 584 |
| JPH1 | 1.27E-14 | 6.53E-18 | 490 |
| TGM2 | 7.39E-13 | 4.27E-16 | 417 |
| TIMP3 | 1.25E-11 | 8.02E-15 | 321 |
| TIE1 | 1.88E-11 | 1.33E-14 | 273 |
| GPR126 | 1.19E-10 | 9.19E-14 | 253 |
| MAGEB2 | 3.84E-10 | 3.20E-13 | 246 |
| CYP24A1 | 3.63E-09 | 3.26E-12 | 222 |
| GJA1 | 3.64E-09 | 3.50E-12 | 222 |
| TLL1 | 7.62E-09 | 7.82E-12 | 220 |
| SAMD5 | 1.58E-08 | 1.72E-11 | 219 |
| PDPN | 2.57E-08 | 3.04E-11 | 211 |
| KCNQ3 | 2.57E-08 | 3.13E-11 | 200 |
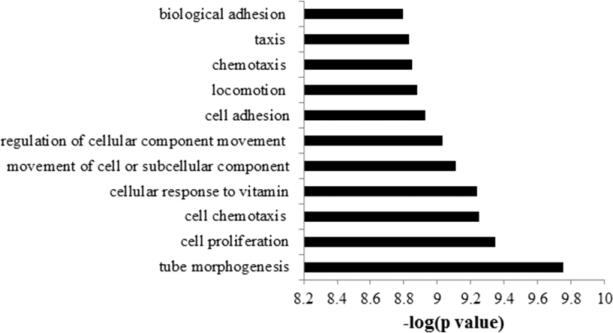
We then performed Gene ontology (GO) biological functions enrichment analysis using ToppGene knowledgebase. In upregulated genes, a list of top enriched biological processes terms is shown in Figure 6, including tube morphogenesis (15 genes), cell proliferation (40 genes), cell chemotaxis (11 genes), cellular response to vitamin (4 genes), movement of cell or subcellular component (37 genes), regulation of cellular component movement (20 genes), cell adhesion (27 genes), locomotion(34 genes), chemotaxis (20 genes), taxis(20 genes) and biological adhesion cell adhesion(27 genes). There was no biological function enriched in the downregulated gene list. Three GO molecular functions including actin binding (15 genes, Table 2), RNA polymerase II transcription factor binding (7 genes) and cytoskeletal protein binding (21 genes) were enriched in the upregulation gene set. The KEGG pathway enrichment analysis showed no significant pathway enrichment in our gene list. IPA (Ingenuity Pathways Analysis) revealed a few top canonical pathways including: “Inhibition of Matrix Metalloproteases”, “T-helper cell differentiation” and “Agranulocyte adhesion and diapedesis”.
Figure 6.
The Gene ontology (GO) biological functions enrichment analysis for up-regulated genes using ToppGene knowledgebase.
Table 2.
Genes altered by SATB2 related to actin binding (GO:0003779)
| Gene Symbol | Gene Name | |
|---|---|---|
| 1 | MYO10 | myosin X |
| 2 | SYNPO2L | synaptopodin 2-like |
| 3 | MTSS1 | metastasis suppressor 1 |
| 4 | AIF1L | allograft inflammatory factor 1-like |
| 5 | CXCR4 | chemokine (C-X-C motif) receptor 4 |
| 6 | SVIL | supervillin |
| 7 | TAGLN | transgelin |
| 8 | CNN1 | calponin 1, basic, smooth muscle |
| 9 | CALD1 | caldesmon 1 |
| 10 | SYNE1 | spectrin repeat containing, nuclear envelope 1 |
| 11 | PSTPIP1 | proline-serine-threonine phosphatase interacting protein 1 |
| 12 | SHROOM2 | shroom family member 2 |
| 13 | DAAM2 | dishevelled associated activator of morphogenesis 2 |
| 14 | HCLS1 | hematopoietic cell-specific Lyn substrate 1 |
| 15 | PHACTR1 | phosphatase and actin regulator 1 |
Discussion
Previously, we have shown that SATB2 was the only gene uniformly induced in normal human bronchial epithelial BEAS-2B cells transformed by four metals including arsenic, chromium, nickel and vanadium [10]. In the current study, we examined the role SATB2 plays in BEAS-2B transformation. We demonstrated that SATB2 overexpression increased the anchorage independent growth as well as migration of BEAS-2B cells, while SATB2 knockdown in a Ni transformed BEAS-2B cells decreased anchorage independent growth. Our evidence supports the hypothesis that SATB2 is involved in BEAS-2B cell transformation and possibly metal related carcinogenesis.
RNA-sequencing revealed that approximately 319 genes were significant differentially regulated between SATB2 overexpressed and control cell clones with no expression of SATB2. Among the top 20 most significantly differentially expressed genes (Table 1), AR is a member of steroid hormone receptor superfamily that function through their ability to regulate the transcription of specific genes[19]. MFAP5, as a component of microfibrils of the extracellular matrix, promotes attachment of cells to microfibrils via alpha-V-beta-3 integrin [20]. TGM2, a member of a family of calcium-dependent enzymes that catalyze post-translational modifications of many protein substrates through the formation of ε-(γ-glutamyl) lysine bonds, plays multiple roles in apoptosis, migration, adhesion, cross-linking, proliferation etc [21]. KCNQ3 is a member of potassium channel and plays a role in hyperpolarization [22], and GJA1encoded protein is a component of gap junctions [23]. The downregulated TLL1 gene encodes an astacin-like, zinc-dependent, metalloprotease that processes procollagen C-propeptides, such as chordin, probiglycan and pro-lysyl oxidase [24].
IPA analysis identified that 267 out of 319 genes are related to cancer. One of the most significantly upregulated genes by SATB2 was PDPN, a type-I integral membrane glycoprotein that has physiological roles in migration, adhesion and cell proliferation [25], and has been reported to be upregulated in several cancer types, including squamous cell carcinoma of the lung, head, and neck, malignant mesothelioma and brain tumors [26]. PDPN is often expressed at the leading invasive edge of tumors and overexpression of PDPN results in a more mesenchymal phenotype, actin-rich filopodia, and increased migration and invasion [27]. On the other hand, RUNX3, repressed 3.6 fold by SATB2 overexpression, has been shown to be a putative tumor suppressor gene localized to chromosome 1p36, a region showing frequent loss of heterozygosity events in colon, gastric, breast and ovarian cancers. Additionally, RunX3 was reported to be repressed in CRC by hyperrmethylation [28] and loss of expression is associated with increased risk and progression [29].
The canonical pathway analysis by IPA identified “inhibition of MMP” as the top canonical pathway altered by SATB2 expression. Metalloproteinases (MMPs) are endopeptidases that modulate both cell-cell and cell-ECM interactions and in turn influence cell differentiation, migration, proliferation and survival. Four TIMPs (TIMP1, TIMP2, TIMP3, and TIMP4) have been identified to inhibit active forms of MMPs [30] and in our study, 2 TIMPs (TFPI2 and TIM3) were found to be significantly upregulated by SATB2 while MMP3 was significantly downregulated, probably by these 2 TIMPs. The MMP3 gene was shown to be down-regulated in individuals with cleft lip and palate when compared to controls [31], consistent with the correlation between SATB2 mutation and cleft lip and palate [18].
RNA-sequencing also revealed major gene expression changes involved in cytoskeleton regulation. Our wound-healing results (Figure 5) also showed aberrant migration activity in SATB2 overexpression cells. When a scratch is made in a monolayer tissue culture, typically, non-transformed cells move coordinately as a sheet in a direction perpendicular to the scratch and coordination between multiple structural (such as actin and myosin) and regulatory components is required for the cell migration processes, including polarization, protrusion, retraction, and adhesion [32]. Compared to control, SATB2 overexpression cells not only migrated faster, the migrating edge is also less organized, At 10 h post scratch, multiple single cells appeared between the gaps (Figure 5).
Cancer arises when uncontrolled cell proliferation and suppressed of apoptosis occur in a cell, but the dysregulation in cellular morphogenesis process can also lead to tissue disruption, inappropriate migration/ invasion, and generate genomic instability through defects in mitosis [32]. The dynamics of actin cytoskeleton are regulated by small Rho GTPases including Rho, Rac and Cdc42 [33]. In a recent study by Seog et al [8], SATB2 was found to be highly expressed in osteosarcoma cells and tumors. Knockdown SATB2 decreased migration and invasion without affecting proliferation or viability. Pathway analyses of SATB2-regulated genes revealed enrichment of those involved in cytoskeleton dynamics. Further studies in protein level reveals that SATB2 promotes osteosarcoma cells invasion by downregulating EPLIN (Epithelial Protein Lost In Neoplasm) as a key mediator that is downregulated in prostate cancer [34]. Similar to the pathways altered by SATB2, in SATB 1 overexpressing breast cancer cells [35], a greater portion of differentially expressed genes were also associated with the biological function of cell adhesion, probably due to the similar targets SATB family share. SATB1 was 5-fold upregulated by SATB2 overexpression.
Moreover, in our previous report [10], “cell motion” and “migration” were identified as the most affected biological functions in chromium transformed cells, “positive regulation of migration” was found in nickel transformed cells and “cell adhesion” and “ cell migration” were enriched in vanadium transformed BEAS-2B cells, indicating a similarity and potential relation with altered SATB2 expression.
Taken together, our study has provided insights into the role SATB2 plays in carcinogenic metal related transformation. Future studies will explore the underlying mechanism(s) responsible for the increased expression of SATB2 by metals transformation, including its promoter, enhancer, upstream regulator and interacting protein partners as well as its function in epigenetics.
Supplementary Material
Highlights.
We performed SATB2 overexpression in the BEAS-2B cell line.
We performed SATB2 knockdown in a Ni transformed BEAS-2B cell line.
SATB2 induced anchorage-independent growth and increased cell migration.
SATB2 knockdown significantly decreased anchorage-independent growth.
We identified alterations in gene involved in cytoskeleton, cell adhesion.
Acknowledgements
This study was supported by National Institutes of Health grant RO1 ES022935, ES023174 and National Institute of Environmental Health Sciences grant P30ES000260.
Abbreviations
- DMEM
Dulbecco's Modified Eagle Medium
- FBS
fetal bovine serum
- G418
Geneticin
- GAPDH
Glyceraldehyde 3-phosphate dehydrogenase
- HRP
horseradish peroxidase
- MTS
(3-(4,5-dimethylthiazol-2-yl)-5-(3-carboxymethoxyphenyl)-2-(4-sulfophenyl)-2H-tetrazolium)
- SATB2
special AT-rich sequence-binding protein 2
- shRNA
short hairpin RNA
- TBS-T
Tris Buffered Saline with Tween® 20
- Ni-BEAS-2B
nickel transformed BEAS-2B cells
- Ni-BEAS-2B-shSATB2-B
Ni-BEAS-2B transfected with SATB2 shRNA-B
- Ni-BEAS-2B-shSATB2-C
Ni-BEAS-2B transfected with SATB2 shRNA-C
Footnotes
Publisher's Disclaimer: This is a PDF file of an unedited manuscript that has been accepted for publication. As a service to our customers we are providing this early version of the manuscript. The manuscript will undergo copyediting, typesetting, and review of the resulting proof before it is published in its final citable form. Please note that during the production process errors may be discovered which could affect the content, and all legal disclaimers that apply to the journal pertain.
References
- 1.Dobreva G, Dambacher J, Grosschedl R. SUMO modification of a novel MAR-binding protein, SATB2, modulates immunoglobulin mu gene expression. Genes Dev. 2003;17:3048–61. doi: 10.1101/gad.1153003. [DOI] [PMC free article] [PubMed] [Google Scholar]
- 2.Dobreva G, Chahrour M, Dautzenberg M, Chirivella L, Kanzler B, Farinas I, Karsenty G, Grosschedl R. SATB2 is a multifunctional determinant of craniofacial patterning and osteoblast differentiation. Cell. 2006;125:971–86. doi: 10.1016/j.cell.2006.05.012. [DOI] [PubMed] [Google Scholar]
- 3.Gyorgy AB, Szemes M, de Juan Romero C, Tarabykin V, Agoston DV. SATB2 interacts with chromatin-remodeling molecules in differentiating cortical neurons. Eur J Neurosci. 2008;27:865–73. doi: 10.1111/j.1460-9568.2008.06061.x. doi: 10.1111/j.1460-9568. [DOI] [PubMed] [Google Scholar]
- 4.Lindskog C, Kuhlwilm M, Davierwala A, Fu N, Hegde G, Uhlen M, Navani S, Paabo S, Ponten F. Analysis of candidate genes for lineage-specific expression changes in humans and primates. J Proteome Res. 2014;13:3596–606. doi: 10.1021/pr500045f. doi: 10.1021/pr500045f. [DOI] [PubMed] [Google Scholar]
- 5.Liu TR, Xu LH, Yang AK, Zhong Q, Song M, Li MZ, Hu LJ, Chen FJ, Hu ZD, Han P, Zeng MS. Decreased expression of SATB2: A novel independent prognostic marker of worse outcome in laryngeal carcinoma patients. PLoS One. 2012;7:e40704. doi: 10.1371/journal.pone.0040704. doi: 101371/journal.pone.0040704. [DOI] [PMC free article] [PubMed] [Google Scholar]
- 6.Brocato J, Costa M. SATB1 and 2 in colorectal cancer. Carcinogenesis. 2015;36:186–91. doi: 10.1093/carcin/bgu322. doi: 10.1093/carcin/bgu322. [DOI] [PMC free article] [PubMed] [Google Scholar]
- 7.Mansour MA, Hyodo T, Ito S, Kurita K, Kokuryo T, Uehara K, Nagino M, Takahashi M, Hamaguchi M, Senga T. SATB2 suppresses the progression of colorectal cancer cells via inactivation of MEK5/ERK5 signaling. Febs J. 2015;282:1394–405. doi: 10.1111/febs.13227. doi: 10.1111/febs.13227. [DOI] [PubMed] [Google Scholar]
- 8.Seong BK, Lau J, Adderley T, Kee L, Chaukos D, Pienkowska M, Malkin D, Thorner P, Irwin MS. SATB2 enhances migration and invasion in osteosarcoma by regulating genes involved in cytoskeletal organization. Oncogene. 2015;34:3582–92. doi: 10.1038/onc.2014.289. doi: 101038/onc.2014.289. [DOI] [PubMed] [Google Scholar]
- 9.Patani N, Jiang W, Mansel R, Newbold R, Mokbel K. The mRNA expression of SATB1 and SATB2 in human breast cancer. Cancer Cell Int. 2009;9:18. doi: 10.1186/1475-2867-9-18. doi: 10.1186/1475-2867-9-18. [DOI] [PMC free article] [PubMed] [Google Scholar]
- 10.Clancy HA, Sun H, Passantino L, Kluz T, Munoz A, Zavadil J, Costa M. Gene expression changes in human lung cells exposed to arsenic, chromium, nickel or vanadium indicate the first steps in cancer. Metallomics. 2012;4:784–93. doi: 10.1039/c2mt20074k. doi: 10.1039/c2mt20074k. [DOI] [PMC free article] [PubMed] [Google Scholar]
- 11.Salnikow K, Zhitkovich A. Genetic and epigenetic mechanisms in metal carcinogenesis and cocarcinogenesis: Nickel, arsenic, and chromium. Chem Res Toxicol. 2008;21:28–44. doi: 10.1021/tx700198a. [DOI] [PMC free article] [PubMed] [Google Scholar]
- 12.Martinez VD, Vucic EA, Becker-Santos DD, Gil L, Lam WL. Arsenic exposure and the induction of human cancers. J Toxicol. 2011;2011:431287. doi: 10.1155/2011/431287. doi: 10.1155/2011/431287. [DOI] [PMC free article] [PubMed] [Google Scholar]
- 13.Rondini EA, Walters DM, Bauer AK. Vanadium pentoxide induces pulmonary inflammation and tumor promotion in a strain-dependent manner. Part Fibre Toxicol. 2010;7:9. doi: 10.1186/1743-8977-7-9. doi: 10.1186/1743-8977-7-9. [DOI] [PMC free article] [PubMed] [Google Scholar]
- 14.Livak KJ, Schmittgen TD. Analysis of relative gene expression data using real-time quantitative PCR and the 2(-delta delta C(T)) method. Methods. 2001;25:402–8. doi: 10.1006/meth.2001.1262. [DOI] [PubMed] [Google Scholar]
- 15.Morgan M, Anders S, Lawrence M, Aboyoun P, Pages H, Gentleman R. ShortRead: A bioconductor package for input, quality assessment and exploration of high-throughput sequence data. Bioinformatics. 2009;25:2607–8. doi: 10.1093/bioinformatics/btp450. doi: 10.1093/bioinformatics/btp450. [DOI] [PMC free article] [PubMed] [Google Scholar]
- 16.Robinson MD, McCarthy DJ, Smyth GK. edgeR: A bioconductor package for differential expression analysis of digital gene expression data. Bioinformatics. 2010;26:139–40. doi: 10.1093/bioinformatics/btp616. doi: 10.1093/bioinformatics/btp616. [DOI] [PMC free article] [PubMed] [Google Scholar]
- 17.Oshlack A, Robinson MD, Young MD. From RNA-seq reads to differential expression results. Genome Biol. 2010;11:220. doi: 10.1186/gb-2010-11-12-220. doi: 10.1186/gb-2010-11-12-220. [DOI] [PMC free article] [PubMed] [Google Scholar]
- 18.Zhao X, Qu Z, Tickner J, Xu J, Dai K, Zhang X. The role of SATB2 in skeletogenesis and human disease. Cytokine Growth Factor Rev. 2014;25:35–44. doi: 10.1016/j.cytogfr.2013.12.010. doi: 101016/j.cytogfr.2013.12.010. [DOI] [PubMed] [Google Scholar]
- 19.Chang C, Saltzman A, Yeh S, Young W, Keller E, Lee HJ, Wang C, Mizokami A. Androgen receptor: An overview. Crit Rev Eukaryot Gene Expr. 1995;5:97–125. doi: 10.1615/critreveukargeneexpr.v5.i2.10. [DOI] [PubMed] [Google Scholar]
- 20.Gibson MA, Leavesley DI, Ashman LK. Microfibril-associated glycoprotein-2 specifically interacts with a range of bovine and human cell types via alphaVbeta3 integrin. J Biol Chem. 1999;274:13060–5. doi: 10.1074/jbc.274.19.13060. [DOI] [PubMed] [Google Scholar]
- 21.Eckert RL, Kaartinen MT, Nurminskaya M, Belkin AM, Colak G, Johnson GV, Mehta K. Transglutaminase regulation of cell function. Physiol Rev. 2014;94:383–417. doi: 10.1152/physrev.00019.2013. doi: 101152/physrev.00019. [DOI] [PMC free article] [PubMed] [Google Scholar]
- 22.Oldfield S, Hancock J, Mason A, Hobson SA, Wynick D, Kelly E, Randall AD, Marrion NV. Receptor-mediated suppression of potassium currents requires colocalization within lipid rafts. Mol Pharmacol. 2009;76:1279–89. doi: 10.1124/mol.109.058008. doi: 10.1124/mol.109.058008. [DOI] [PubMed] [Google Scholar]
- 23.Abrams CK, Scherer SS. Gap junctions in inherited human disorders of the central nervous system. Biochim Biophys Acta. 2012;1818:2030–47. doi: 10.1016/j.bbamem.2011.08.015. doi: 10.1016/j.bbamem.2011.08.015. [DOI] [PMC free article] [PubMed] [Google Scholar]
- 24.Sabirzhanova IB, Sabirzhanov BE, Keifer J, Clark TG. Activation of mammalian tolloid-like 1 expression by hypoxia in human neuroblastoma SH-SY5Y cells. Biochem Biophys Res Commun. 2009;389:338–42. doi: 10.1016/j.bbrc.2009.08.146. doi: 10.1016/j.bbrc.2009.08.146. [DOI] [PMC free article] [PubMed] [Google Scholar]
- 25.Tyrrell C, McKechnie SR, Beers MF, Mitchell TJ, McElroy MC. Differential alveolar epithelial injury and protein expression in pneumococcal pneumonia. Exp Lung Res. 2012;38:266–76. doi: 10.3109/01902148.2012.683321. doi: 10.3109/01902148.2012.683321. [DOI] [PubMed] [Google Scholar]
- 26.Astarita JL, Acton SE, Turley SJ. Podoplanin: Emerging functions in development, the immune system, and cancer. Front Immunol. 2012;3:283. doi: 10.3389/fimmu.2012.00283. doi: 10.3389/fimmu.2012.00283. [DOI] [PMC free article] [PubMed] [Google Scholar]
- 27.Wicki A, Christofori G. The potential role of podoplanin in tumour invasion. Br J Cancer. 2007;96:1–5. doi: 10.1038/sj.bjc.6603518. [DOI] [PMC free article] [PubMed] [Google Scholar]
- 28.Goel A, Arnold CN, Tassone P, Chang DK, Niedzwiecki D, Dowell JM, Wasserman L, Compton C, Mayer RJ, Bertagnolli MM, Boland CR. Epigenetic inactivation of RUNX3 in microsatellite unstable sporadic colon cancers. Int J Cancer. 2004;112:754–9. doi: 10.1002/ijc.20472. [DOI] [PubMed] [Google Scholar]
- 29.Mu WP, Wang J, Niu Q, Shi N, Lian HF. Clinical significance and association of RUNX3 hypermethylation frequency with colorectal cancer: A meta-analysis. Onco Targets Ther. 2014;7:1237–45. doi: 10.2147/OTT.S62103. doi: 10.2147/OTT.S62103. [DOI] [PMC free article] [PubMed] [Google Scholar]
- 30.Brew K, Nagase H. The tissue inhibitors of metalloproteinases (TIMPs): An ancient family with structural and functional diversity. Biochim Biophys Acta. 2010;1803:55–71. doi: 10.1016/j.bbamcr.2010.01.003. doi: 101016/j.bbamcr.2010.01.003. [DOI] [PMC free article] [PubMed] [Google Scholar]
- 31.Letra A, Silva RA, Menezes R, Astolfi CM, Shinohara A, de Souza AP, Granjeiro JM. MMP gene polymorphisms as contributors for cleft lip/palate: Association with MMP3 but not MMP1. Arch Oral Biol. 2007;52:954–60. doi: 10.1016/j.archoralbio.2007.04.005. [DOI] [PubMed] [Google Scholar]
- 32.Hall A. The cytoskeleton and cancer. Cancer Metastasis Rev. 2009;28:5–14. doi: 10.1007/s10555-008-9166-3. doi: 101007/s10555-008-9166-3. [DOI] [PubMed] [Google Scholar]
- 33.Mack NA, Georgiou M. The interdependence of the rho GTPases and apicobasal cell polarity. Small GTPases. 2014;5:10. doi: 10.4161/21541248.2014.973768. doi: 10.4161/21541248.2014.973768. [DOI] [PMC free article] [PubMed] [Google Scholar]
- 34.Zhang S, Wang X, Osunkoya AO, Iqbal S, Wang Y, Chen Z, Muller S, Chen Z, Josson S, Coleman IM, Nelson PS, Wang YA, Wang R, Shin DM, Marshall FF, Kucuk O, Chung LW, Zhau HE, Wu D. EPLIN downregulation promotes epithelial-mesenchymal transition in prostate cancer cells and correlates with clinical lymph node metastasis. Oncogene. 2011;30:4941–52. doi: 10.1038/onc.2011.199. doi: 10.1038/onc.2011.199. [DOI] [PMC free article] [PubMed] [Google Scholar]
- 35.Han HJ, Russo J, Kohwi Y, Kohwi-Shigematsu T. SATB1 reprogrammes gene expression to promote breast tumour growth and metastasis. Nature. 2008;452:187–93. doi: 10.1038/nature06781. doi: 101038/nature06781. [DOI] [PubMed] [Google Scholar]
Associated Data
This section collects any data citations, data availability statements, or supplementary materials included in this article.


