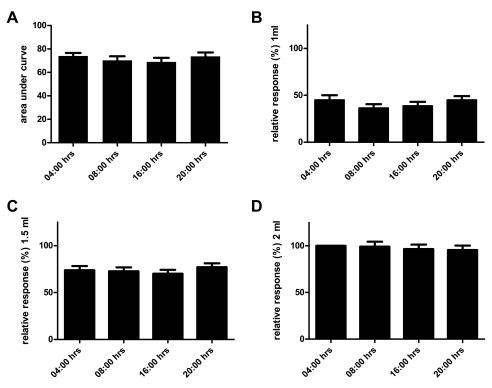
Figure 1. Diurnal pattern of VMR to distension in normal male Long Evans rats.
Mean area under the curve ± SEM of the relative responses at 04:00, 08:00, 16:00 and 20:00 hrs in n=16 normal male Long Evans rats (Friedman’s test P=0.69) ( A). Using the same data set but now depicting per volume relative responses on different time points (Friedman’s test P=0.55, 0.95 and 0.93; B, C and D respectively).

