Abstract
We report on the development and characterization of a traveling wave (TW)-based Structures for Lossless Ion Manipulations (TW-SLIM) module for ion mobility separations (IMS). The TW-SLIM module uses parallel arrays of rf electrodes on two closely spaced surfaces for ion confinement, where the rf electrodes are separated by arrays of short electrodes, and using these TWs can be created to drive ion motion. In this initial work, TWs are created by the dynamic application of dc potentials. The capabilities of the TW-SLIM module for efficient ion confinement, lossless ion transport, and ion mobility separations at different rf and TW parameters are reported. The TW-SLIM module is shown to transmit a wide mass range of ions (m/z 200–2500) utilizing a confining rf waveform (~1 MHz and ~300 Vp-p) and low TW amplitudes (<20 V). Additionally, the short TW-SLIM module achieved resolutions comparable to existing commercially available low pressure IMS platforms and an ion mobility peak capacity of ~32 for TW speeds of <210 m/s. TW-SLIM performance was characterized over a wide range of rf and TW parameters and demonstrated robust performance. The combined attributes of the flexible design and low voltage requirements for the TW-SLIM module provide a basis for devices capable of much higher resolution and more complex ion manipulations.
Graphical abstract
Ion mobility separations in conjunction with mass spectrometry (IMS-MS) provides a versatile tool for analytical separations, characterization, and detection.1–5 IMS can, e.g., separate structural isomers, resolve conformational features of macromolecules, and augment MS in a broad range of metabolomics, glycomics, and proteomics applications.1,6–11
There is an increasing number of IMS formats used for chemical and biochemical analyses, including constant field drift tube ion mobility spectrometry (DTIMS),12 high-field asymmetric ion mobility spectrometry (FAIMS),13 differential mobility analysis (DMA),14 and traveling wave ion mobility spectrometry (TWIMS).6 DTIMS typically uses weak electric fields to separate ions according to their collision cross sections with an inert buffer gas. Ions having larger collision cross sections (i.e., low mobility) arrive at the detector after ions of smaller collision cross section.3 Practical constraints on temperature, voltages, and size limit the resolving power achieved by DTIMS.12,15–18 Alternatively, traveling wave approaches based upon, e.g., the transient application of dc potentials, such as used in the present work, can eliminate the need for increasingly higher voltages as the drift length increases.7,19 While a traditional drift tube uses a fixed voltage drop over the length of the drift tube, a TW approach uses the application of transient and dynamic fields to drive ion motion in the direction of the wave motion.6,7,19,21–23 The key variables affecting ion motion in TWIMS are the TW amplitude, the TW velocity, and the operating pressure (as well as temperature).2,6,19,24 The ability of ions to “keep up” with a TW depends on their mobilities;6,25 higher mobility ions tend to move more closely to the TW speed (and stack up at the wavefront without separation in “traveling traps”, sometimes referred to as “ion surfing”), whereas lower mobility ions tend to slip behind the TW (i.e., be passed by waves) more often.20,21 Ions with speeds lower than the TW have longer drift times and are dispersed to different degrees, thus achieving ion mobility separations.6,20 TWIMS, like conventional DTIMS, can be applied to separate essentially any charged particles, including peptides, proteins, lipids, glycans, etc.2,6,7,26–28 By applying a confining rf field in addition to TW potential, ions can be efficiently transported as they separate. However, present commercially available TWIMS have limited separation power due to practical limitations on size and complexity of the electrode structures, providing resolutions inadequate for many potential applications, a challenge that is general to IMS, particularly where high sensitivity is also desired.9,25 A recent attempt to increase the resolution achievable with TWIMS has involved the construction of a cyclic ion path device where the total path can be increased by multiple passes through the cyclic path.29,30 Although promising, this approach ultimately limits the separable range of mobilities; as the number of cycles increases, the fastest ions start to approach the tail of the slowest, while the ion packet width also increases (due to diffusional broadening), limiting the range of ion mobilities that can be cycled simultaneously.
Recently our laboratory introduced Structures for Lossless Ion Manipulations (SLIM),31–34 where initial designs utilized two planar surfaces having arrays of dc “guard” electrodes to confine ions laterally in conjunction with rf and dc potentials applied to arrays of “rung” electrodes (located between the guard electrodes) to confine ions between the two surfaces,31,32 and initially implemented utilizing printed circuit boards (PCBs). PCB-based SLIM can be rapidly fabricated at low cost and alternative arrangements rapidly prototyped.34,35 A SLIM drift IMS module was implemented using a static dc voltage gradient coapplied with the rf to the rung electrodes and provided good performance, along with ancillary capabilities such as the ability to select, trap, and accumulate selected species after separation.35,36 Other ion manipulations demonstrated in SLIM include lossless ion transmission over a wide m/z range,32,34 efficient trapping for as long as 5 h, accumulation with near 100% efficiency,35 execution of 90° turns, and switching to alternative paths.31,33 Although drift IMS has been demonstrated using SLIM, the high voltage constraints limit the drift path lengths that are practical and thus the achievable IMS resolution.29,33,34,37
Here we describe a new platform combining the SLIM advantages of flexible design and low voltage requirements for traveling wave IMS. In contrast to current commercial TWIMS, rf and TW potentials are independently applied to different sets of electrodes, simplifying the electronics. The performance of this initial short TW-SLIM module has been evaluated for a wide range of the parameters that affect the ion transmission, ion mobility resolution, and resolving power.
EXPERIMENTAL SECTION
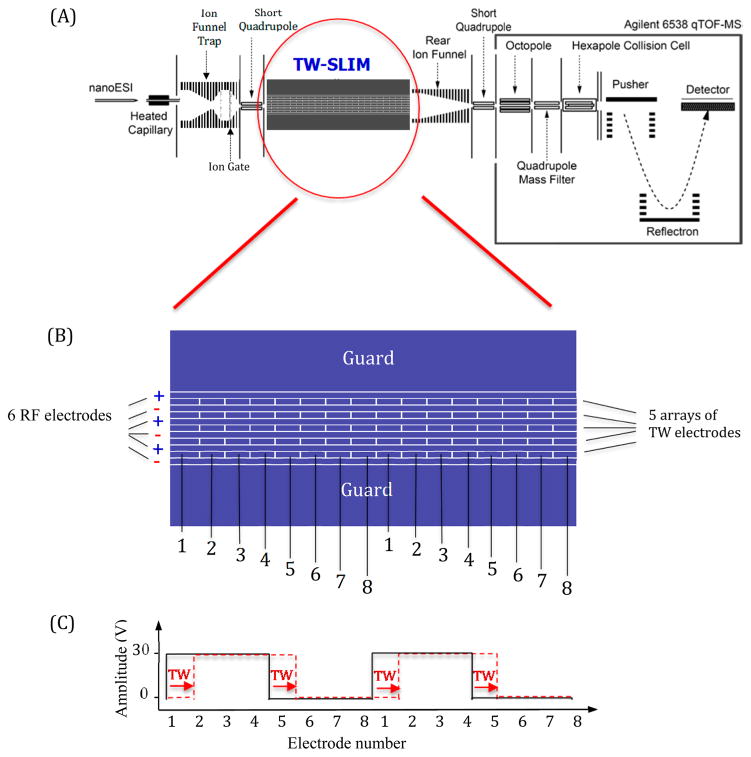
Singly charged phosphazine ions from Agilent low concentration ESI tuning mix (Agilent, Santa Clara, CA) were generated by a nanoelectrospray ionization source (3000 V) using chemically etched emitters38 and infused utilizing a syringe pump (Chemyx, Stafford, TX) with a flow rate of 300 nL/min. Ions were introduced into the first stage of vacuum through a stainless steel 500 μm i.d. stainless steel capillary heated to 140 °C (Figure 1A). After exiting the heated capillary ions were focused and stored for 10 ms in an ion funnel trap (1.3 MHz and ~160 Vp-p) at 3.95 Torr.35,38,39 Ions were released from the ion funnel trap by lowering the voltage applied to the exit gate for 324 μs and then traversed a 2.5 cm long convergent region of the ion funnel, a conductance limiting orifice (2.5 mm i.d.), and a 2 cm long quadrupole (1.1 MHz and ~180 Vp-p), which directed ions into the TW-SLIM module (4 Torr). A differential positive pressure of 50 mTorr between TW-SLIM and ion funnel trap effectively prevents solvent and contaminants from entering the TW-SLIM module.34 Ions exit TW-SLIM into an 18 cm long “rear” ion funnel (830 kHz and ~350 Vp-p) having a 16.5 V/cm dc field which refocuses ions prior to a 2.5 cm long quadrupole (960 kHz and ~340 Vp-p) to an Agilent 6538 QTOF mass spectrometer with a 1.5 m flight tube (Agilent Technologies, Santa Clara, CA). Data was recorded with a U1084A 8-bit ADC digitizer (Keysight Technologies, Santa Rosa, CA) and processed using in-house developed software.
Figure 1.
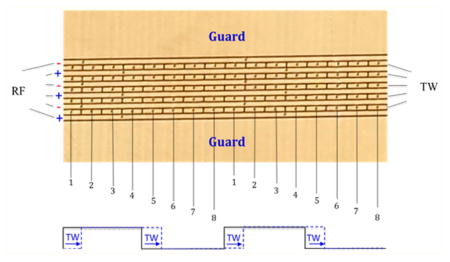
(A) Schematic diagram of the instrumental arrangement. (B) Illustration of a portion of the 30 cm long TW-SLIM module showing the rf, traveling wave, and guard electrodes on one of the two PCB surfaces. The TW voltages are applied to subsets of eight electrodes numbered 1 through 8 forming a traveling wave. The sequence is repeated for the length of the module, on both surfaces. (C) The application of a 11110000 sequence to electrodes 1–8 is shown with the first step in the sequence indicated by the dashed red line (see text).
The TW-SLIM module was fabricated using PCBs33–35 and consisted of a pair of parallel PCBs (30.5 cm long × 7.6 cm wide) spaced by a gap of 4.75 mm for this work. Details of the electrode design arrangement are shown in Figure 1B. The TW-SLIM used 5 arrays of TW dc electrodes, separated from adjacent rf electrodes by 0.13 mm, with each electrode having a length of 1.98 mm and width of 0.43 mm. The dc guard electrodes were 5.08 mm wide (Supporting Information, Figure S-1). rf waveforms at 1 MHz, 180° out-of-phase for adjacent electrodes, were applied to the six 30.5 cm long rf electrodes on each surface to create a confining pseudopotential inhibiting loss of ions to the two surfaces. The TW dc potentials were applied to a subset of each set of eight electrodes, while the other subset was maintained at ground potential. In this work the TW was created by switching the dc on and off cto individual electrodes of each eight electrode set, to create the TW (Figure 1C). The TW sequence can be varied between 10000000 and 11111110, where 0 means applying 0 V, while 1 means applying the traveling wave amplitude (e.g., 30 V) to the specified electrode. For example, in a sequence of 11110000, 30 V was applied to electrodes 1–4 while a 0 V was applied to electrodes 5–8. In this work the applied voltages were stepped one electrode at a time in the direction of ion motion (see Fig. 1C), such that in the next time step electrodes 2–5 have 30 V applied, while electrodes 6–8 and 1 have 0 V applied, to create the traveling wave.
Ion currents were measured with a Keithley 6485 picoammeter (Keithley Instruments, Inc., Cleveland, OH) using a conductive probe positioned between the two parallel SLIM surfaces.
RESULTS AND DISCUSSION
The TW-SLIM module ion transmission was initially evaluated using ion trajectory simulations as well as total ion current measurements at several positions along the ion path. To investigate and initially optimize separations in the TW-SLIM module we explored the effects of TW speed, TW sequence, TW amplitude, guard bias, and rf confinement potential upon ion mobility resolution.
Ion Transmission through the TW-SLIM Module
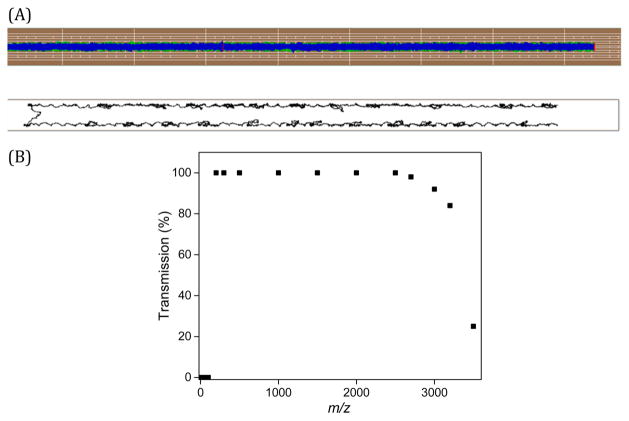
Previously, we have utilized ion simulations to understand the ion motion in SLIM operating with static dc fields to drive the ion motion.31,32 In this study, ion trajectory simulations were performed using SIMION 8.1 (Scientific Instrument Services Inc., Ringoes, NJ) in which TW-SLIM geometries, designed using Eagle CAD software (Pembroke Pines, FL), were imported. A Statistical Diffusion Simulation (SDS) collision model was used to model ion motion at 4 Torr.31 A detailed theoretical study and modeling of SLIM traveling wave ion motion and separations will be reported elsewhere.40 Simulations utilizing a SLIM with 6 rf electrodes and 5 interspersed dc electrodes are shown in Figure 2A. Figure 2A (Top) shows the ion trajectory viewed from above (i.e., perpendicular to) the SLIM surfaces. A view between the surfaces (Figure 2A, bottom) shows the trajectories of two ions (out of 1000 ions used) where the periodic looping nature seen in the trajectory occurs due to the ions falling back over the TW, and the consequent velocity reversal is evident. Although a splitting of the ions into two ion populations is evident (centered ~1 mm from each electrode surface as illustrated in Figure 2A, bottom), this splitting had no observable effect on achieved resolution, either by experiment or simulations, but a more detailed study of the effects of this phenomenon will be the subject of future work.40 Ion trajectory simulations were performed to evaluate ion confinement and ion transmission. SIMION was used to calculate the effects of rf and TW potentials on ions in the TW-SLIM. The illustrated simulations were performed utilizing a TW speed of 84 m/s, a TW amplitude of 30 V, and 15 V applied to the guard electrodes. A m/z range of 50–3500 was simulated with 250 singly charged particles per ionic species and space charge effects neglected. The simulations suggest lossless ion transmission between m/z 200 and 2500 (Figure 2B). The lower m/z cut-off at m/z 200 is rather sharp, whereas the high m/z cutoff is comparatively broad.41 The m/z range can be adjusted by changing the rf frequency and amplitude parameters, as with rf multipole devices.42
Figure 2.
(A; Top) Simulated trajectories of a thousand ions for a traveling wave at 84 m/s; (Bottom) A side view of two ions trajectories between the SLIM surfaces; (B) Ion transmission efficiency from simulation of ions between m/z 200 and 2500.
The TW-SLIM ion transmission from ESI of the Agilent tuning mix (118–2722 Da) was evaluated using the total ion current directly measured as a function of position along the ion path using the same TW parameters as the simulations. Three sets of measurements were conducted by positioning the probe at 1, 16, and 29 cm from the entrance of the TW-SLIM module where the measured ion currents were 140.1 ± 1.3, 143.9 ± 12.6, and 139.7 ± 7.0 pA, respectively, indicating essentially lossless ion transmission through the TW-SLIM module, as predicted by ion simulations (Figure 2B).
Characterization of IMS Performance for the TW-SLIM Module
Previous theoretical studies indicated that the ratio of peak ion velocity (υmax) to TW speed (s) has a significant impact on the resolving power of TW IMS separations. The ratio (c) can be calculated using eq 1:20
| (1) |
Here K is ion mobility constant (at 4 Torr pressure p in this work) and Emax is the applied electric field at the traveling wavefront.
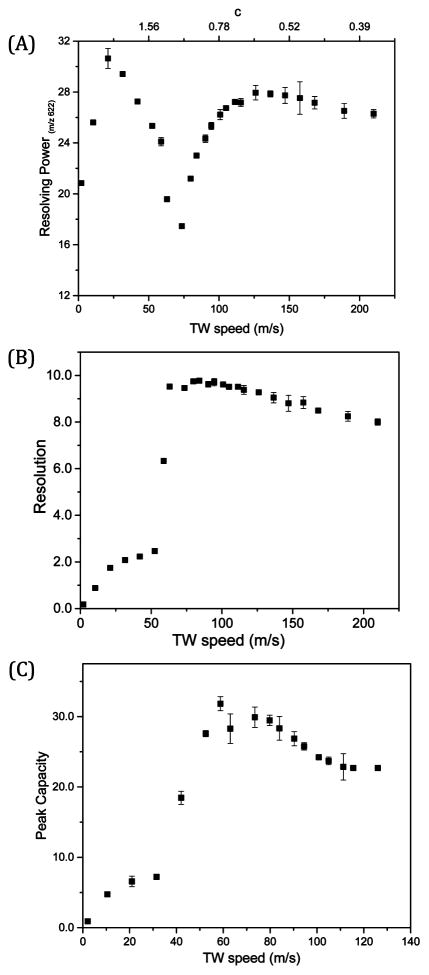
In the case of symmetric TWs (e.g., 30 V applied to 4 consecutive electrodes and 0 V applied to the other 4 electrodes), the steepest average electric field experienced by ions can be estimated as ~35 V/cm (30 V over ~8.5 mm distance). The ion drift velocity for m/z 622 ion is ~78 m/s (υmax = KEmax) at a distance of ~1 mm from the surfaces. Therefore, a TW speed of 78 m/s would give a value of c = 1. To study the effect of c on the performance of TW device, the resolving power was calculated using eq 2:43,44
| (2) |
where t represents the arrival time measured at the middle of the peak while Δt is the full width at half-maximum (fwhm). It is worth noting that the resolving power of TWIMS is not equivalent to that for DTIMS and does not effectively describe the resolution achievable for a specific TWIMS application. Figure 3A shows the effects of variation of the TW speed (or the ratio “c”) on the observed resolving power for m/z 622. At c ≫ 1 (i.e., a TW speed <78 m/s for m/z 622), the ions are expected to be confined to “traveling traps” as their mobilities allow them to “keep up” with the wave speed. Thus, the peak widths are smaller as the effects due to diffusion are effectively constrained but no mobility based separation takes place. At c < 1, where the speed of the TW is greater than that of the lower mobility species, ions begin to separate. We note that a maximum resolving power of 27.0 ± 0.1 was achieved for m/z 622 upon applying a TW speed of 125 m/s. As the c decreases further, the effective time for which ion experience the driving TW field progressively decreases as it quickly travels past the ions. Thus, the net ion motion in the direction of the wave is reduced and a significant portion of the decreased resolving power can be attributed to ion diffusion over the longer drift period.44
Figure 3.
(A) Resolving power for m/z 622; (B) resolution for the m/z 622 and 922 peaks; (C) peak capacity as a function of TW speed for a TW amplitude of 30 V, a symmetric TW sequence of 11110000, guard bias of 15 V, and rf amplitude (Vp-p) of 320 V.
Thus, while resolving power gives information about a single peak, it can be misleading as to the quality of separations achievable. The resolution obtained for specified species provides a more useful measure of separation performance and is used here. For instance, although the highest resolving power of 30.6 ± 0.8 was achieved for m/z 622 upon applying a TW speed of 21 m/s, only very low resolution was achieved (Supporting Information, Figure S-2). The resolution of m/z 622 and 922 ions (R622–922) was calculated using eq 3:
| (3) |
Here t922 and t622 represent the arrival times of m/z 922 and 622 ions while Δt922 and Δt622 are the fwhm of the m/z 922 and 622 peaks, respectively. Figure 3B shows the impact of TW speed on the measured resolution. For higher c (c > 1) at slower TW speeds (2–52 m/s) ions can move faster than the TW, and no useful IMS separations are achieved (Supporting Information, Figure S-3A).20 Significantly improved resolution was observed as the TW speed increased from 53 to 63 m/s, c ~ 1, where ions are traveling with mean velocities comparable to the wave velocity s but occasionally fall backward over the tops of the waves.20 Upon further increasing the TW speed, an increase in resolution was observed as the measured separation of the arrival times of m/z 622 and 922 ions increased without a significant increase in fwhm (Supporting Information: Figure S-3A–3B), where the higher mobility ion (m/z 622) is passed fewer times by the TW compared to the m/z 922 ion.19,20 A plateau was observed in the measured resolution upon varying the TW speed from 63 to 111 m/s, implying that reasonably high IMS resolution can be achieved over a broad range of TW speeds and that good separations can be achieved for a wide range of mobilities. The separation between m/z 622 and 922 ions increases linearly with TW speed, with no further increase in resolution. The relatively longer separation times resulted in an increase in fwhm due to factors that appear to be primarily diffusion (Supporting Information, Figure S-3B). The maximum resolution of 9.8 ± 0.1 was achieved at a TW speed of 84 m/s. Upon further increasing the TW speed from 116 to 210 m/s, the resolution decreased somewhat to 8.0 ± 0.1 at 210 m/s, consistent with previous studies using conventional TW designs which suggested lower resolution upon approaching the low c limit where ions oscillate with only slight axial displacement as waves pass, reducing the overall separation achieved.20,21
While resolution gives information on the separation between two charged species, broader metrics of performance evaluation are useful for TWIMS. The separation peak capacity, the number of peaks that can be separated within a separation window, is a useful metric for performance. Peak capacity is a dimensionless measure of overall resolution; a measure of the range over which features are separated divided by the peak width associated with the selected species,18,45–47 and can be calculated using eq 4:18,46
| (4) |
In the present study, the peak capacity is estimated by dividing the separation range (t2122 − t622) where t2122 and t622 represent the arrival times of m/z 2122 and 622 ions, respectively, by (Δt)average which is the average fwhm of m/z 622, 922, 1222, 1522, 1822, and 2122 ions. We note that since the lower m/z species were excluded (m/z 322 moved with the TW and not separated from any other species), this somewhat underestimates the actual peak capacity. Figure 3C shows the impact of the TW speed on the measured peak capacity. The maximum peak capacity of 31.8 ± 1.0 was achieved at a TW speed of 59 m/s, while the maximum resolution which was obtained at 84 m/s (Figure 3B). Higher m/z ions are better separated at lower TW speeds than lower m/z ions, shifting the maximum measured peak capacity to lower TW speeds (Supporting Information, Figure S-3C).
As the overall throughput of applications is important, another attractive universal measure is the peak generation rate, which we define here as the ratio of the peak capacity to the full separation time (i.e., the rate at which peaks can be generated across multiple separations). Assuming separations can be staged to effectively eliminate any gap between subsequent separations, the peak generation rate can be obtained using eq 5:48
| (5) |
We have estimated the peak generation rate as a function of the TW speed from 2.1 to 210 m/s. At 59 m/s, the measured peak generation rate was 874 ± 36 s−1. This peak generation rate is approximately 3 orders of magnitude greater than those in condensed phases (e.g., liquid chromatography with peak generation rates of ~0.1–1.2 s−1) due to the greater maximum speeds of gas-phase ions.45,46,48–51
Since the TW speed affects both resolution (R622–922) and peak capacity similarly, we used the resolution (R622–922) of the most abundant m/z 622 and 922 ions to evaluate TWIMS. As discussed above, the maximum resolution was achieved at a TW speed of 84 m/s. Therefore, we evaluated other parameters that may affect the separation parameters at a TW speed of 84 m/s, including TW sequence, TW amplitude, guard bias, and rf amplitude.
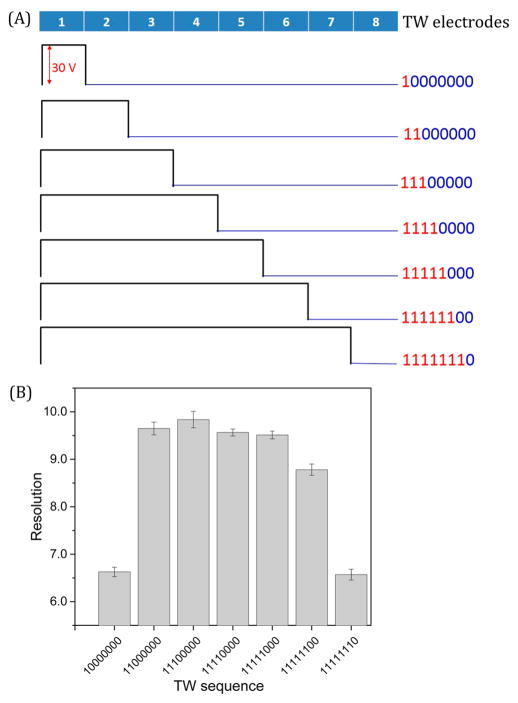
Ion mobility separations change as a function of the TW sequence due to the distribution of the applied voltages in a repeating pattern to each set of eight electrodes, as shown in Figure 4A. The optimal TW sequence was determined in this work based on the resolution (R622–922); symmetric and near-symmetric TWs (11000000–11111100) resulted in optimum resolution of 9.6 ± 0.2, as displayed in Figure 4B, while a relatively low resolution of 6.6 ± 0.1 was observed utilizing 10000000 or 11111110 TW sequences and can be attributed to the relatively longer field free periods between waves (and reduced overall motion of ions). These sequences also result in slower separations and more significant ion diffusion, leading to wider peaks.
Figure 4.
Resolution measured at TW speed of 84 m/s as a function of (A), the various TW sequences considered in the present study. The measured resolution for m/z 622 and 922 ions for the various TW sequences (B) was obtained for a TW amplitude of 30 V, a guard bias of 15 V, and rf amplitude (Vp-p) of 320 V.
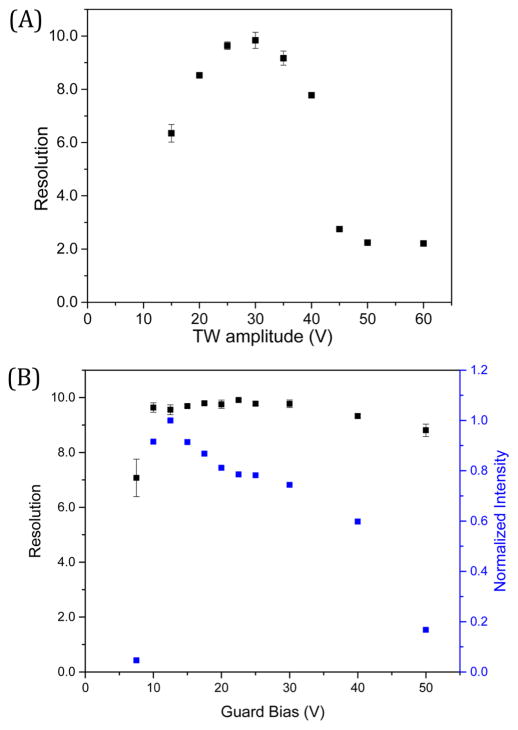
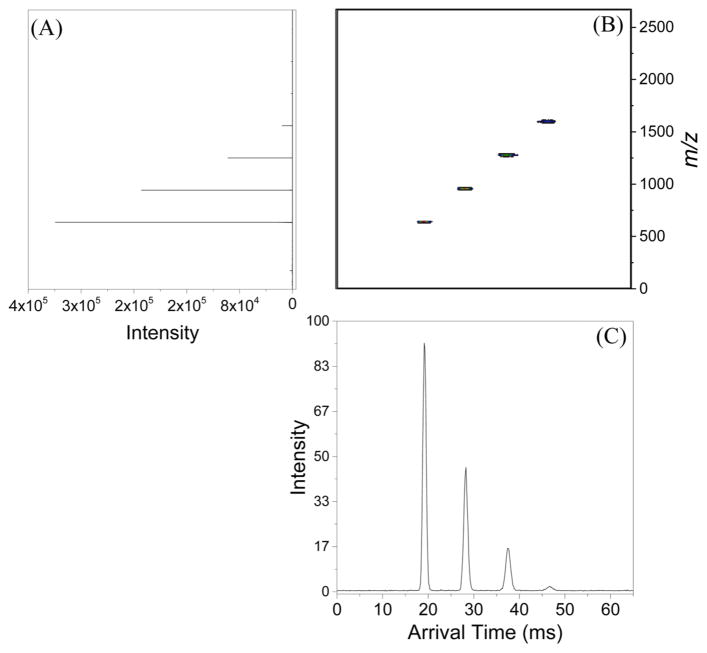
Using a symmetric TW at 84 m/s, the TW amplitude was varied between 15 and 60 V (lower ion intensities were observed at <15 V and >60 V). Resolution was sensitive to the TW amplitude; a TW amplitude of 30 V provided the optimum resolution of 9.8 ± 0.3 (Figure 5A). In addition, the ion mobility resolution was measured as a function of the guard bias, as shown in Figure 5B. The dc guard voltage is applied to effectively confine the ions in the transverse direction32 and was varied between 7.5 and 50 V (signal decreased significantly for guard bias <7.5 V or >50 V). Ion intensities reported in Figure 5B were normalized to that for the most intense m/z 622. While the guard bias has little effect on resolution, the signal intensity was sensitive to changes in the guard bias. The ion losses at extremely low guard biases can be attributed to the ineffective lateral ion confinement, while at high guard biases ion losses can be ascribed to insufficient rf confinement as ions are effectively pushed toward the electrode surfaces due to increased field penetration by the guards.31,34 The resolution increased as the guard bias increased from 7.5 to 10 V and plateaued at >10 V. The applied rf had no significant effect on resolution between 200 and 320 Vp-p (Supporting Information, Figure S-4). Electrical breakdown occurred at rf voltages >320 Vp-p, and <200 Vp-p resulted in a high m/z cutoff (Supporting Information, Figure S-5). The rf effective potential provides confinement of ion motion in the direction orthogonal to the two TW-SLIM surfaces.31,32,34 The observed effects on the guard and rf voltages are similar to those reported previously for other SLIM arrangements.32,34 Figure 6 shows a separation for the Agilent tuning mix ion species by TW-SLIM (30 cm) at a TW speed of 84 m/s and a TW amplitude of 30 V, which we note are roughly comparable in quality to both existing TWIMS and DTIMS having comparable or somewhat longer separation paths, respectively.
Figure 5.
Resolution for the m/z 622 and 922 peaks measured at 84 m/s as a function of (A) TW amplitude using the following settings: a symmetric square wave (11110000), guard bias was set to 15 V, and rf amplitude (Vp-p) was set to 320 V. (B) Guard bias at the following settings: a symmetric square wave (11110000), TW amplitude was set to 30 V, and rf amplitude (Vp-p) was set to 320 V.
Figure 6.
(A) Mass spectrum obtained using the TW-SLIM module. (B) Nested mass and mobility display of the abundant ions analyzed by TW-SLIM module. (C) Arrival time distribution of the ions present in the mixture analyzed by TW-SLIM module obtained at the optimum conditions: traveling wave speed was set to 84 m/s using a symmetric square wave (11110000), traveling wave amplitude was set to 30 V, guard bias was set to 15 V, and rf amplitude (Vp-p) was set to 320 V.
CONCLUSIONS
Traveling waves can be used to conduct ion mobility separations in SLIM devices and can achieve essentially lossless performance. The present TW-SLIM module utilized rf confinement of ions between the SLIM surfaces, static dc potentials to prevent lateral losses, and the application of transient potentials applied to separate electrodes to create TWs and drive ion motion. The TW speed was optimized to maximize separation quality (a maximum resolution for the m/z 622 and 922 peaks of 9.8 ± 0.1 was achieved). Peak capacities and peak generation rates were estimated to be 31.8 ± 1.0 and 874 ± 36 s−1 at a TW speed of 59 m/s, respectively. In addition to TW speed, the TW amplitude and TW sequence applied have significant effects on the IMS resolution and resolving power. However, we find that rf amplitude and guard bias have negligible effects on the separation parameters within the range of optimal TW amplitudes, illustrating the robustness of TW-SLIM modules. Our results are consistent with previous TWIMS reports from both theoretical and experimental investigations.2,6,7,20,44
On the basis of the combined attributes of the flexible design of SLIM and low voltage requirements of TW ion mobility separations, TW-SLIM have a significant potential for enabling extended ion separations and other ion manipulations for a wide range of applications unattainable using present platforms. This work clearly suggests an effective route for increasing the ion path length significantly without the need for higher voltages. In addition, other TW-SLIM configurations are being evaluated to, e.g., assess the impact of turns on IMS resolution, and will be reported elsewhere.40 The development of TW-SLIM raises the possibility of achieving the elusive combination of ultrahigh IMS resolution in conjunction with extremely high sensitivity.
Supplementary Material
Acknowledgments
Portions of this research were supported by grants from the National Institute of General Medical Sciences (Grant P41 GM103493), the Laboratory Directed Research and Development Program at Pacific Northwest National Laboratory, and the U.S. Department of Energy Office of Biological and Environmental Research Genome Sciences Program under the Panomics Program. This work was performed in the W. R. Wiley Environmental Molecular Sciences Laboratory (EMSL), a DOE national scientific user facility at the Pacific Northwest National Laboratory (PNNL). PNNL is operated by Battelle for the DOE under Contract DE-AC05-76RL0 1830.
Footnotes
The authors declare no competing financial interest.
The Supporting Information is available free of charge on the ACS Publications website at DOI: 10.1021/acs.anal-chem.5b02481.
Instrumental schematic, Agilent tuning mix data and analysis, and resolution for the m/z 622 and 922 peaks as a function of rf amplitude (PDF)
References
- 1.Ibrahim YM, Baker ES, Danielson WF, Norheim RV, Prior DC, Anderson GA, Belov ME, Smith RD. Int J Mass Spectrom. 2015;377:655–662. doi: 10.1016/j.ijms.2014.07.034. [DOI] [PMC free article] [PubMed] [Google Scholar]
- 2.Smith DP, Knapman TW, Campuzano I, Malham RW, Berryman JT, Radforda SE, Ashcroft AE. Eur Mass Spectrom. 2009;15:113–130. doi: 10.1255/ejms.947. [DOI] [PubMed] [Google Scholar]
- 3.McDaniel EW, Mason EA. The Mobility and Diffusion of Ions in Gases. Wiley; New York: 1973. [Google Scholar]
- 4.Zhong Y, Hyung SJ, Ruotolo BT. Expert Rev Proteomics. 2012;9:47–58. doi: 10.1586/epr.11.75. [DOI] [PMC free article] [PubMed] [Google Scholar]
- 5.Manicke NE, Belford M. J Am Soc Mass Spectrom. 2015;26:701–705. doi: 10.1007/s13361-015-1096-z. [DOI] [PubMed] [Google Scholar]
- 6.Giles K, Wildgoose JL, Langridge DJ, Campuzano I. Int J Mass Spectrom. 2010;298:10–16. [Google Scholar]
- 7.Pringle SD, Giles K, Wildgoose JL, Williams JP, Slade SE, Thalassinos K, Bateman RH, Bowers MT, Scrivens JH. Int J Mass Spectrom. 2007;261:1–12. [Google Scholar]
- 8.Baker ES, Livesay EA, Orton DJ, Moore RJ, Danielson WF, III, Prior DC, Ibrahim YM, LaMarche BL, Mayampurath AM, Schepmoes AA. J Proteome Res. 2010;9:997–1006. doi: 10.1021/pr900888b. [DOI] [PMC free article] [PubMed] [Google Scholar]
- 9.Li H, Bendiak B, Siems WF, Gang DR, Hill HH., Jr Anal Chem. 2013;85:2760–2769. doi: 10.1021/ac303273z. [DOI] [PMC free article] [PubMed] [Google Scholar]
- 10.Dwivedi P, Wu C, Matz LM, Clowers BH, Siems WF, Hill HH. Anal Chem. 2006;78:8200–8206. doi: 10.1021/ac0608772. [DOI] [PMC free article] [PubMed] [Google Scholar]
- 11.Tao L, McLean JR, McLean JA, Russell DH. J Am Soc Mass Spectrom. 2007;18:1232–1238. doi: 10.1016/j.jasms.2007.04.003. [DOI] [PubMed] [Google Scholar]
- 12.Dugourd P, Hudgins R, Clemmer D, Jarrold M. Rev Sci Instrum. 1997;68:1122–1129. [Google Scholar]
- 13.Guevremont R. Journal of Chromatography A. 2004;1058:3–19. [PubMed] [Google Scholar]
- 14.de la Mora JF, de Juan L, Eichler T, Rosell J. TrAC, Trends Anal Chem. 1998;17:328–339. [Google Scholar]
- 15.Hudgins RR, Woenckhaus J, Jarrold MF. Int J Mass Spectrom Ion Processes. 1997;165:497–507. [Google Scholar]
- 16.Eiceman GA, Karpas Z, Hill HH., Jr . Ion Mobility Spectrometry. 3. CRC Press; Boca Raton, FL: 2013. [Google Scholar]
- 17.May JC, Goodwin CR, Lareau NM, Leaptrot KL, Morris CB, Kurulugama RT, Mordehai A, Klein C, Barry W, Darland E. Anal Chem. 2014;86:2107–2116. doi: 10.1021/ac4038448. [DOI] [PMC free article] [PubMed] [Google Scholar]
- 18.Merenbloom SI, Bohrer BC, Koeniger SL, Clemmer DE. Anal Chem. 2007;79:515–522. doi: 10.1021/ac061567m. [DOI] [PMC free article] [PubMed] [Google Scholar]
- 19.Giles K, Pringle SD, Worthington KR, Little D, Wildgoose JL, Bateman RH. Rapid Commun Mass Spectrom. 2004;18:2401–2414. doi: 10.1002/rcm.1641. [DOI] [PubMed] [Google Scholar]
- 20.Shvartsburg AA, Smith RD. Anal Chem. 2008;80:9689–9699. doi: 10.1021/ac8016295. [DOI] [PMC free article] [PubMed] [Google Scholar]
- 21.Zhong Y, Hyung SJ, Ruotolo BT. Analyst. 2011;136:3534–3541. doi: 10.1039/c0an00987c. [DOI] [PubMed] [Google Scholar]
- 22.Rand KD, Pringle SD, Murphy JP, III, Fadgen KE, Brown J, Engen JR. Anal Chem. 2009;81:10019–10028. doi: 10.1021/ac901897x. [DOI] [PMC free article] [PubMed] [Google Scholar]
- 23.Leary JA, Schenauer MR, Stefanescu R, Andaya A, Ruotolo BT, Robinson CV, Thalassinos K, Scrivens JH, Sokabe M, Hershey JWB. J Am Soc Mass Spectrom. 2009;20:1699–1706. doi: 10.1016/j.jasms.2009.05.003. [DOI] [PubMed] [Google Scholar]
- 24.Merenbloom SI, Flick TG, Daly MP, Williams ER. J Am Soc Mass Spectrom. 2011;22:1978–1990. doi: 10.1007/s13361-011-0238-1. [DOI] [PMC free article] [PubMed] [Google Scholar]
- 25.Giles K, Williams JP, Campuzano I. Rapid Commun Mass Spectrom. 2011;25:1559–1566. doi: 10.1002/rcm.5013. [DOI] [PubMed] [Google Scholar]
- 26.Williams JP, Scrivens JH. Rapid Commun Mass Spectrom. 2008;22:187–196. doi: 10.1002/rcm.3346. [DOI] [PubMed] [Google Scholar]
- 27.Knapman TW, Berryman JT, Campuzano I, Harris SA, Ashcroft AE. Int J Mass Spectrom. 2010;298:17–23. [Google Scholar]
- 28.Kim HI, Kim H, Pang ES, Ryu EK, Beegle LW, Loo JA, Goddard WA, Kanik I. Anal Chem. 2009;81:8289–8297. doi: 10.1021/ac900672a. [DOI] [PMC free article] [PubMed] [Google Scholar]
- 29.Giles K, Wildgoose J, Pringle S, Garside J, Carney P, Nixon P, Langridge D. 62nd ASMS Conference on Mass Spectrometry and Allied Topics; Baltimore, MD. June 15–19, 2014. [Google Scholar]
- 30.Giles K, Wildgoose J, Pringle S, Langridge D, Nixon P, Garside J, Carney P. 63rd ASMS Conference on Mass Spectrometry and Allied Topics; St. Louis, MO. May 31–June 4, 2015. [Google Scholar]
- 31.Garimella SVB, Ibrahim YM, Webb IK, Tolmachev AV, Zhang X, Prost SA, Anderson GA, Smith RD. J Am Soc Mass Spectrom. 2014;25:1890–1896. doi: 10.1007/s13361-014-0976-y. [DOI] [PMC free article] [PubMed] [Google Scholar]
- 32.Tolmachev AV, Webb IK, Ibrahim YM, Garimella SVB, Zhang X, Anderson GA, Smith RD. Anal Chem. 2014;86:9162–9168. doi: 10.1021/ac502054p. [DOI] [PMC free article] [PubMed] [Google Scholar]
- 33.Webb IK, Garimella SVB, Tolmachev AV, Chen TC, Zhang X, Cox JT, Norheim RV, Prost SA, LaMarche B, Anderson GA, Ibrahim YM, Smith RD. Anal Chem. 2014;86:9632–9637. doi: 10.1021/ac502139e. [DOI] [PMC free article] [PubMed] [Google Scholar]
- 34.Webb IK, Garimella SVB, Tolmachev AV, Chen TC, Zhang X, Norheim RV, Prost SA, LaMarche B, Anderson GA, Ibrahim YM, Smith RD. Anal Chem. 2014;86:9169–9176. doi: 10.1021/ac502055e. [DOI] [PMC free article] [PubMed] [Google Scholar]
- 35.Zhang X, Garimella SVB, Prost SA, Webb IK, Chen TC, Tang K, Tolmachev AV, Norheim RV, Baker ES, Anderson GA, Ibrahim YM, Smith RD. Anal Chem. 2015;87:6010–6016. doi: 10.1021/acs.analchem.5b00214. [DOI] [PMC free article] [PubMed] [Google Scholar]
- 36.Chen T-C, Sandoval JA, Prost SA, Karnesky WE, Zhang X, Webb IK, Hamid AM, Norheim RV, Baker ES, Ibrahim YM, Smith RD. 63rd ASMS Conference on Mass Spectrometry and Allied Topics; St. Louis, MO. May 31–June 4, 2015. [Google Scholar]
- 37.Glaskin RS, Ewing MA, Clemmer DE. Anal Chem. 2013;85:7003–7008. doi: 10.1021/ac4015066. [DOI] [PubMed] [Google Scholar]
- 38.Clowers BH, Ibrahim YM, Prior DC, Danielson WF, Belov ME, Smith RD. Anal Chem. 2008;80:612–623. doi: 10.1021/ac701648p. [DOI] [PMC free article] [PubMed] [Google Scholar]
- 39.Ibrahim YM, Belov ME, Liyu AV, Smith RD. Anal Chem. 2008;80:5367–5376. doi: 10.1021/ac8003488. [DOI] [PMC free article] [PubMed] [Google Scholar]
- 40.Garimella SVB, Hamid AM, Deng L, Ibrahim YM, Webb IK, Smith RD. 2015 In preparation. [Google Scholar]
- 41.Schwartz JC, Senko MW, Syka JE. J Am Soc Mass Spectrom. 2002;13:659–669. doi: 10.1016/S1044-0305(02)00384-7. [DOI] [PubMed] [Google Scholar]
- 42.Sobott F, Hernández H, McCammon MG, Tito MA, Robinson CV. Anal Chem. 2002;74:1402–1407. doi: 10.1021/ac0110552. [DOI] [PubMed] [Google Scholar]
- 43.Siems WF, Wu C, Tarver EE, Hill HHJ, Larsen PR, McMinn DG. Anal Chem. 1994;66:4195–4201. [Google Scholar]
- 44.May JC, McLean JA. Int J Ion Mobility Spectrom. 2013;16:85–94. doi: 10.1007/s12127-013-0123-7. [DOI] [PMC free article] [PubMed] [Google Scholar]
- 45.Shen Y, Lee ML. Anal Chem. 1998;70:3853–3856. [Google Scholar]
- 46.Neue UD. Journal of Chromatography A. 2005;1079:153–161. doi: 10.1016/j.chroma.2005.03.008. [DOI] [PubMed] [Google Scholar]
- 47.Grushka E. Anal Chem. 1970;42:1142–1147. [Google Scholar]
- 48.Li X, Stoll DR, Carr PW. Anal Chem. 2009;81:845–850. doi: 10.1021/ac801772u. [DOI] [PMC free article] [PubMed] [Google Scholar]
- 49.MacNair JE, Patel KD, Jorgenson JW. Anal Chem. 1999;71:700–708. doi: 10.1021/ac9807013. [DOI] [PubMed] [Google Scholar]
- 50.Plumb RS, Rainville P, Smith BW, Johnson KA, Castro-Perez J, Wilson ID, Nicholson JK. Anal Chem. 2006;78:7278–7283. doi: 10.1021/ac060935j. [DOI] [PubMed] [Google Scholar]
- 51.Shen Y, Zhao R, Berger SJ, Anderson GA, Rodriguez N, Smith RD. Anal Chem. 2002;74:4235–4249. doi: 10.1021/ac0202280. [DOI] [PubMed] [Google Scholar]
Associated Data
This section collects any data citations, data availability statements, or supplementary materials included in this article.


