Abstract
Improving EEG signal interpretation, specificity, and sensitivity is a primary focus of many current investigations, and the successful application of EEG signal processing methods requires a detailed knowledge of both the topography and frequency spectra of low-amplitude, high-frequency craniofacial EMG. This information remains limited in clinical research, and as such, there is no known reliable technique for the removal of these artifacts from EEG data. The results presented herein outline a preliminary investigation of craniofacial EMG high-frequency spectra and 3D MRI segmentation that offers insight into the development of an anatomically-realistic model for characterizing these effects. The data presented highlights the potential for confounding signal contribution from around 60 to 200 Hz, when observed in frequency space, from both low and high-amplitude EMG signals. This range directly overlaps that of both low γ (30-50 Hz) and high γ (50-80 Hz) waves, as defined traditionally in standatrd EEG measurements, and mainly with waves presented in dense-array EEG recordings. Likewise, average EMG amplitude comparisons from each condition highlights the similarities in signal contribution of low-activity muscular movements and resting, control conditions. In addition to the FFT analysis performed, 3D segmentation and reconstruction of the craniofacial muscles whose EMG signals were measured was successful. This recapitulation of the relevant EMG morphology is a crucial first step in developing an anatomical model for the isolation and removal of confounding low-amplitude craniofacial EMG signals from EEG data. Such a model may be eventually applied in a clinical setting to ultimately help to extend the use of EEG in various clinical roles.
Key Words: EEG, EMG, Signal Contamination, Anatomical Modeling
Of the many obfuscating phenomena that have been identified and studied in the field of electroencephalography (EEG), craniofacial eletromyographic (EMG) artifacts remain of great concern in clinical research applications.1-3 The notion that craniofacial EMG activities contaminate EEG data is not a new concept, but its urgency has only become apparent after a study by Whitham et al. in 2007 suggested that most scalp EEG data above 20 Hz might simply be recorded EMG activity.2 Indeed, results from many recent investigations have further contributed to this notion and thereby further necessitate development of reliable techniques for characterizing and isolating EMG artifacts.1,4-8
Not all noise from EMG activity is difficult to discirminate from EEG data. Large-amplitude muscle activity is readily visible in any EEG data set and can therefore be easily detected with the use of signal processing techniques such as filtering, spectral analysis, and/or Principle or Independent Component Analysis (ICA).9-18 On the contrary, the efficacy of many of these signal processing techniques is questionable and unreliable in the separation of low-amplitude EMG activity from EEG data, as these two signals may be of comparable amplitude.7,8 Aside from amplitude, the frequency spectra of EMG and EEG can overlap – a phenomenon which is particularly prevalent in scalp EEG, whose ripple frequency measurements are typically between 80-250 Hz may be significantly affected by high-frequency craniofacial EMG artifacts.19-21
In order to generate an accurate and clinically-relevant model of the signal contribution of craniofacial EMG, detailed morphological information must likewise be known. The use of segmented magnetic resonance imaging (MRI) has previously been developed to model the electrical behavior of the human brain under normal and pathological conditions.22 This imaging modality can be utilized to accurately characterize extant coupled non-linear physical mechanisms and how they impact the propagation of EMG and EEG signals through the inhomogeneous media of the head.23 In the generation of a 3D model from segmented MRI images, most major tissue surfaces can readily be identified in each slice.22,24,25
In general, the successful application of modern EEG signal processing methods requires a detailed knowledge of both the topography and frequency spectra of low-amplitude craniofacial EMG. This information remains limited to clinical research, and as such, there is no known reliable technique for the removal of these artifacts from EEG data. The results presented herein outline a preliminary investigation of both craniofacial EMG frequency spectra and 3D MRI segmentation that offers insight into the development of an anatomically-realistic model for characterizing these effects. Such a model then can be applied in a clinical setting to excise low-amplitude EMG activity and ultimately help to extend the use of EEG in various clinical roles.
Material and Methods
EMG data acquisition
EMG measurements were performed on 12 healthy volunteer subjects: 6 female and 6 male, from ages 19 to 30. The equipment used for these measurements was the Kine Measurement System with four wireless triode surface electrode pads and a simultaneous video recording system.
The subject was first asked to lay down on an inclining bench while his/her skin was cleaned with alcohol and conductive gel put on the electrodes. A video camera was placed in front of the subject, which captured the front of the subject’s face. The electrodes were placed on the left and right temporal and frontal muscles of the subjects. After this setup, each subject was asked to perform a series of several facial exercises. Firstly, each subject was asked to maximally clench his/her jaw for 10 seconds, corresponding to maximum contraction of the temporal muscles. Then, EMG of the frontal muscles was recorded by having each subject both raise and furrow their eyebrows as much as possible for 10 seconds. Next, each subject was given a piece of chewing gum and left to reach a stable mastication rhythm. EMG signals were then recorded while the subject masticated with the chewing gum on the left side for 30 seconds, which was then repeated on the right side. Lastly, for control conditions, EMG was measured while each subject laid completely still with their eyes open and fixed on a spot for 30 seconds, which was then repeated with their eyes closed.
Frequency Analyses
The Power Spectral Density (PSD) was computed by taking the Fast Fourier Transformations (FFT) of the EMG signal. All signal analyses were performed with Matlab software (http://www.mathworks.com). The mean PSD with its standard deviation for each condition was computed by averaging all trials per subject first, then normalising the amplitudes to their maximum value. The next step was to average the PSD between all subjects. The mean and standard deviation values within 10 Hz frequency bins from 0 to 800 Hz were normalized in order to obtain inter-conditionally comparable results for these bandwidths.
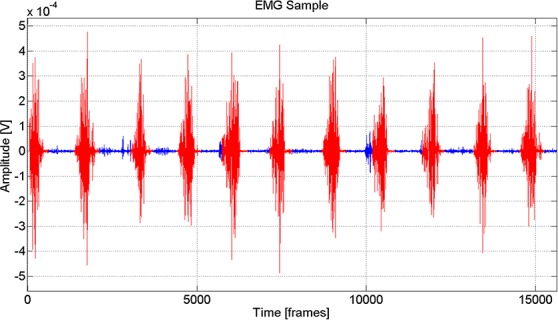
In case of the chewing condition, the active and inactive segments had to first be defined. To accomplish this, spectral analysis was performed on these two classes separately, and signal components representing the active chewing were automatically detected by clustering analysis. First, the original signal in the time domain was segmented into 0.2 s windows with a shift of 20 ms. A variance was then computed for each window. K-means algorithm was chosen to perform the clustering analysis on an array of the previously computed variances. The number of clusters was experimentally set to three while the largest one represented the inactive chewing. The two remaining clusters were merged to obtain the active chewing class. Results from this method are exemplified in Figure 1
Craniofacial muscle modeling from MRI
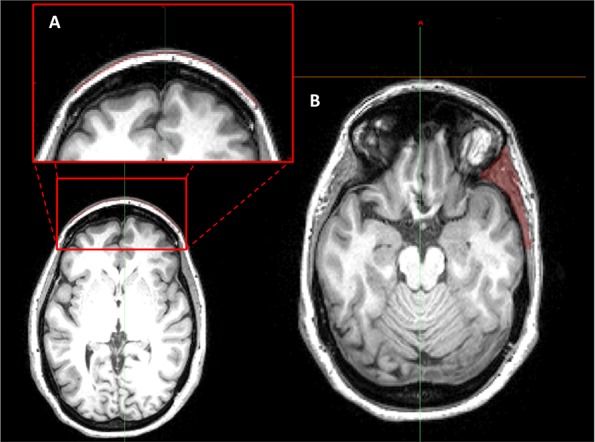
The MRI segmentation and 3D reconstruction method utilized in this study has been reported.26,27 The dataset used to model craniofacial muscles in the reported investigation was a T1-weighted MRI scan from a voluntary subject. The scanning protocol utilized was chosen to optimize the contrast between white and gray values with voxel sizes of 1 mm3. MIMICS image analysis software (Materialise, Leuven, Belgium) was first utilized to identify the temporalis (temporal) muscle via contrast thresholding, as its proximity to bone makes it readily visible. Next, the frontalis (frontal) muscle was identified using a combination of contrast and manual thresholding according to known anatomy and published methodologies.28 An example image of this method is shown in Figure 2.
Fig 2.

Example thresholding method using MIMICS software to identify and segment the frontal (A) and temporal (B) muscles. This technique presents its utility as a foundation for developing an anatomically-relevant model for assessing craniofacial muscle EMG artifacts and their potential to contribute to measured EEG.
Statistical Analysis
Statistical analysis was performed using appropriately sized ANOVA with posthoc testing carried out using a student’s T-test. Differences were considered statistically significant for p < 0.05.
Results
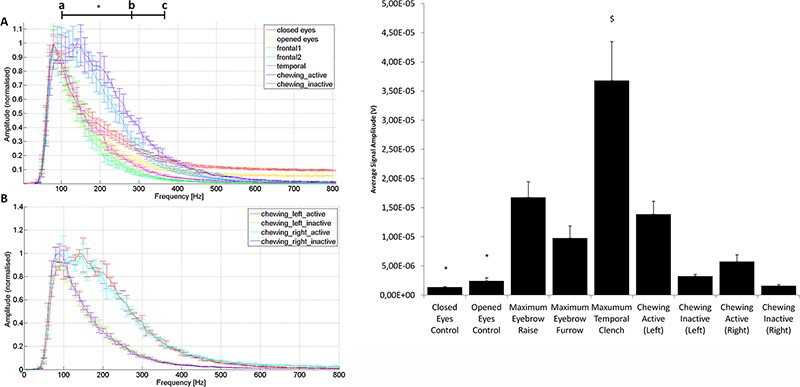
In order to assess the utility of comparing frequency spectra of EMG signals during each recorded facial movement, FFT analyses were completed to obtain mean PSDs and standard deviations at each 10 Hz frequency bin for each condition. Additionally, mean amplitudes for each of the subject conditions were computed by taking the absolute values of equal time frames within the recorded EMG signals. Results from these analyses are shown in Figures 3 A and B, respectively.
Fig 3.

Results from EMG signal FFT analysis and mean signal amplitude assessment. Note that the closed and open eyes conditions were both resting controls, frontal1 and frontal2 were maximum eyebrow raise and furrow conditions, respectively, temporal refers to the maximal temporal clench condition, and chewing active and inactive refer to the high-amplitude and low-amplitude portions of the chewing condition, as segmented by clustering analysis. A) Frequency spectra from each of the measured conditions (note that only the left side chewing condition was included in this plot). B) Frequency spectra for the left and right side chewing conditions. Statistical significance (*) was determined as p<0.05 in all assessments. C) Comparison of mean signal amplitudes across all measured conditions. Note that all conditions except for both chewing inactive datasets were significantly greater in amplitude than both control conditions (*). Likewise, the maximum temporal clench condition was significantly greater in amplitude than all other conditions ($). Statistical significance was determined as p<0.05 in all assessments.
Firstly, as is evident by comparing the frequency spectra for all of the subject conditions, frequencies from around 60 to 200 Hz comprise the majority of each curve. This frequency range corresponds to both low γ (30-50 Hz) and high γ (50-80 Hz) EEG waves. The control conditions, wherein subjects rested with eyes open or closed, contributed very similar frequency ranges to those of inactive chewing and both temporal muscle exercises (Figure 2A). Contrastingly, the temporal activation and active chewing conditions both contributed significantly more to the frequency ranges of 100-280 Hz and 100-370 Hz, respectively (Figure 3A, a-b and a-c), than any other condition (p < 0.05). Additionally, comparison of left and right chewing conditions showed minimal variation between conditions (Figure 3B), highlighting the utility of the methodology utilized in separating active and inactive signals (Figure 1).
Fig 1.

Sample raw EMG data depicting the results of the clustering methodology utilized to separate active and inactive chewing conditions (Red is active, and blue is inactive).
Finally, in comparing the relative mean EMG signal amplitudes of all conditions, all conditions except for inactive chewing exhibited significantly higher signal amplitudes than either control condition (Figure 3C, p < 0.05). Furthermore, the maximum temporal clench condition had significantly higher amplitudes than all other conditions (p < 0.05).
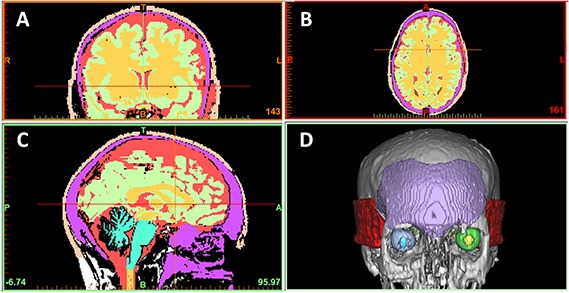
These data are valuable because, as previously mentioned, traditional signal processing techniques perform FFT analyses to assess EEG frequency spectra, and understanding how high-frequency EMG may confound this signal is crucial to being able to optimally analyze scalp electrical activity. Our results demonstrate the presence of these confounding EMG frequencies as a normalized intensity distribution in frequency space, and understanding which frequencies optimally represent each condition's EMG signal and how they may overlap EEG frequency spectra are crucial first steps in developing a method for their removal from dense-array EEG data. However, because these frequencies are normalized, the exact contribution of each EMG in respect to its intensity at a specific frequency remains unclear. Likewise, which frequencies are the most "important" (e.g. frequencies with the highest intensity) for each condition is additionally unclear. It is reasonable to conclude that each of the different conditions result in different intensity distributions in frequency space, which highlights the dependency of EMG frequency contribution to an EEG signal on the kind of muscle activity exhibited by the subject. This has to be taken into account during EEG data acquisition/analysis and EEG modeling and can be addressed by our analyses. Next, to assess whether MRI segmentation and 3D reconstruction could be used to anatomically define the temporal and frontal craniofacial muscles used in EMG acquisition, a representative patient's cranial MRI was utilized. The results from the abovementioned segmentation using MIMICS are presented in Figure 4. As is evident by the results from the MRI segmentation, both the left and right temporal muscles along with the frontal muscle were readily reconstructed using a combination of contrast thresholding and anatomical referencing. These results highlight the utility of this methodology in characterizing the morphology of the craniofacial muscles utilized in the EMG measurement portion of this study. Using this methodology to couple anatomical information with measured EMG signal could serve as a fundamental basis for developing an anatomical model for EMG and EEG signal measurement and processing.
Fig 4.

MRI segmentation and 3D reconstruction of temporal and frontal craniofacial muscles. A) Frontal, B) transverse, and C) sagittal plane cranial MRI slices. D) 3D reconstruction showing frontal (purple) and temporal (red) craniofacial muscles.
Discussion and Conclusions
The successful application of EEG signal processing methods requires a detailed knowledge of both the topography and frequency spectra of low-amplitude, high-frequency craniofacial EMG. This information remains unavailable to clinical researchers, and as such, there is no known reliable technique for the removal of these artifacts from EEG data. The results presented herein outline a preliminary investigation of craniofacial EMG high-frequency spectra and 3D MRI segmentation that offers insight into the development of an anatomically-realistic model for characterizing these effects. The data presented highlights the potential for confounding signal contribution in EEG acquisition. However, since these data were normalized for spectral analyses, the comparative degree to which each respective craniofacial muscular movement may contribute to this signal remains unclear. Nevertheless, average EMG amplitude comparisons from each condition highlights the similarities in signal contribution of low-activity muscular movements and resting, control conditions.
In addition to the FFT analysis performed, 3D segmentation and reconstruction of the craniofacial muscles whose EMG signals were measured was successful. This recapitulation of the relevant EMG morphology is a crucial first step in developing an anatomical model for the isolation and removal of confounding low-amplitude craniofacial EMG signals from EEG data. Such a model may be eventually applied in a clinical setting to ultimately help to extend the use of EEG in various clinical roles.
Acknowledgement
This research has been supported by the University Hospital Landspitali Scientific fund.
References
- 1.Muthukumaraswamy SD. High-frequency brain activity and muscle artifacts in MEG/EEG: a review and recommendations. Front Hum Neurosci 2013;7:138. [DOI] [PMC free article] [PubMed] [Google Scholar]
- 2.Whitham EM, Pope KJ, Fitzgibbon SP, et al. Scalp electrical recording during paralysis: quantitative evidence that EEG frequencies above 20 Hz are contaminated by EMG. Clin Neurophysiol 2007;118:1877-88. [DOI] [PubMed] [Google Scholar]
- 3.Kennett R. Modern electroencephalography. J Neurol 2012;259:783-9.22314552 [Google Scholar]
- 4.Whitham EM, Lewis T, Pope KJ, et al. Thinking activates EMG in scalp electrical recordings. Clin Neurophysiol 2008;119:1166-75. [DOI] [PubMed] [Google Scholar]
- 5.Whitham EM, Fitzgibbon SP, Lewis TW, et al. Visual Experiences during Paralysis. Front Hum Neurosci 2011. December 7;5:160. [DOI] [PMC free article] [PubMed] [Google Scholar]
- 6.Pope KJ, Fitzgibbon SP, Lewis TW, et al. Relation of gamma oscillations in scalp recordings to muscular activity. Brain Topogr 2009;22:13-7. [DOI] [PubMed] [Google Scholar]
- 7.Shackman AJ, McMenamin BW, Slagter HA, et al. Electromyogenic artifacts and electro-encephalographic inferences. Brain Topogr 2009;22:7-12. [DOI] [PMC free article] [PubMed] [Google Scholar]
- 8.McMenamin BW, Shackman AJ, Greischar LL, Davidson RJ. Electromyogenic Artifacts and Electroencephalographic Inferences Revisited. Neuroimage 2011;54:4-9. [DOI] [PMC free article] [PubMed] [Google Scholar]
- 9.Barlow JS. Artifact processing (rejection and minimization) in EEG data processing. Handbook of electroencephalography and clinical neurophysiology. Revised series, vol. 2 Elsevier, Amsterdam: (1986), pp. 15-62. [Google Scholar]
- 10.Ives JR, Schomer DL. A 6-pole filter for improving the readability of muscle contaminated EEGs. Electroenceph Clin Neurophysiol 1988;69:486-90. [DOI] [PubMed] [Google Scholar]
- 11.Panych LP, Wada JA, Beddoes MP. Practical digital filters for reducing EMG artefact in EEG seizure recordings. Electroencephalogr Clin Neurophysiol 1989;72:268-76. [DOI] [PubMed] [Google Scholar]
- 12.Klass Donald W. The continuing challenge of artifacts in the EEG. American Journal of EEG Technology 1995;35:239-69. [Google Scholar]
- 13.Pradhan N, Sadasivan PK, Chatterji S, Dutt ND. Patterns of attractor dimensions of sleep EEG. Computers in biology and medicine 1995;25:455-62. [DOI] [PubMed] [Google Scholar]
- 14.Brunner DP, Vasko RC, Detka CS, et al. Muscle artifacts in the sleep EEG: automated detection and effect on all-night EEG power spectra. J Sleep Res. 1996;5:155-64. [DOI] [PubMed] [Google Scholar]
- 15.Anderer P, Roberts S, Schlögl A, et al. Artifact processing in computerized analysis of sleep EEG-a review." Neuropsychobiology 1999;40: 150-7. [DOI] [PubMed] [Google Scholar]
- 16.Lagerlund TD., Sharbrough FW, Busacker NE. Spatial filtering of multichannel electro-encephalographic recordings through principal component analysis by singular value decomposition. J Clin Neurophysiol 1997;14:73-82. [DOI] [PubMed] [Google Scholar]
- 17.Jung T-P, Makeig S, Humphries C, et al. Removing electroencephalographic artifacts by blind source separation. Psychophysiology 2000;37:163-78. [PubMed] [Google Scholar]
- 18.Junghöfer M, Elbert T, Tucker DM, Rockstroh B. Statistical control of artifacts in dense array EEG/MEG studies. Psychophysiology 2000;37: 523-32. [PubMed] [Google Scholar]
- 19.Van Boxtel A, Goudswaard P, Schomaker LRB. Amplitude and bandwidth of the frontalis surface EMG: effects of electrode parameters. Psychophysiology 1984;21:699-707. [DOI] [PubMed] [Google Scholar]
- 20.Van Boxtel A. Optimal signal bandwidth for the recording of surface EMG activity of facial, jaw, oral, and neck muscles. Psychophysiology 2001;38:22-34. [PubMed] [Google Scholar]
- 21.Van Boxtel A, Goudswaard P, Van der Molen GM, Van Den Bosch WE. Changes in electromyogram power spectra of facial and jaw-elevator muscles during fatigue. J Appl Physiol 1983;54:51-8. [DOI] [PubMed] [Google Scholar]
- 22.Gargiulo P, Helgason T, Ramon C, et al. CT and MRI assessment and characterization using segmentation and 3D modeling techniques: applications to muscle, bone and brain. Eur J Transl Myol 2014;24:55-62. [DOI] [PMC free article] [PubMed] [Google Scholar]
- 23.Abraham K, Marsan CA. Patterns of cortical discharges and their relation to routine scalp electroencephalography. Electroencephalogr Clin Neurophysiol 1958;10:447-461. [DOI] [PubMed] [Google Scholar]
- 24.Ceon R, Garguilo P, Egill A, et al. Changes in scalp potentials and spatial smoothing effects of inclusion of dura layer in human head models for EEG simulations. Front Neuroeng 2014. August 5;7:32. doi: 10.3389/fneng.2014.00032. eCollection 2014. [DOI] [PMC free article] [PubMed] [Google Scholar]
- 25.Ceon R, Holmes MD. Noninvasive epileptic seizure localization from stochastic behavior of short duration interictal high density scalp EEG data. Brain topography 2012;25:106-15. [DOI] [PubMed] [Google Scholar]
- 26.Gargiulo P, Vatnsdal B, Ingvarsson P, et al. Restoration of muscle volume and shape induced by electrical stimulation of denervated degenerated muscles: qualitative and quantitative measurement of changes in rectus femoris using computer tomography and image segmentation. Artif Organs 2008;32:609-13. [DOI] [PubMed] [Google Scholar]
- 27.Gargiulo P., Belfiore P., Friðgeirsson E. A., Vanhatalo S., Ramon C. "The effect of fontanel on scalp EEG potentials in the neonate." Clinical Neurophysiology (2014). [DOI] [PubMed] [Google Scholar]
- 28.Gargiulo P, Carraro U, Mandl T, et al. Anthropometry of human muscle using segmentation techniques and 3D modelling: applications to lower motor neuron denervated muscle in Spinal Cord Injury. In Handbook of Anthropometry, pp. 323-354. Springer; New York, 2012. [Google Scholar]


