

Abstract
The capabilities and application range of cryogenic electron microscopy (cryo-EM) method have expanded vastly in the last two years, thanks to the advances provided by direct detection devices and computational classification tools. We take this review as an opportunity to sketch out promising developments of cryo-EM in two important directions: (i) imaging of short-lived states (10–1000 ms) of biological molecules by using time-resolved cryo-EM, particularly the mixing-spraying method and (ii) recovering an entire continuum of coexisting states from the same sample by employing a computational technique called manifold embedding. It is tempting to think of combining these two methods, to elucidate the way the states of a molecular machine such as the ribosome branch and unfold. This idea awaits further developments of both methods, particularly by increasing the data yield of the time-resolved cryo-EM method and by developing the manifold embedding technique into a user-friendly workbench.
Keywords: classification, manifold embedding, microfluidics, ribosome, time-resolved imaging, translation
Introduction
With the recent advances provided by direct electron detection cameras, cryogenic electron microscopy (cryo-EM) has reached the point where it can compete with X-ray crystallography in its ability to furnish atomic models of macromolecular assemblies. While modeling usually relies on bioinformatics knowledge, ab initio modeling constrained by densities, sequences and rules of stereochemistry has been achieved in some cases (e.g. GroEL [1], ion channels [2,3] and large subunit of the mitochondrial ribosome [4–6]). It can be argued that cryo-EM of molecules in single-particle form (which will be exclusively discussed in the following) is in fact doing a better job in capturing functionally meaningful states as the reconstructions obtained depict ensemble averages of free-standing molecules, unimpeded by intermolecular contacts (although the molecules may be affected by the interaction with the water–air interface and with the carbon or other supporting film). Another advantage, which has only recently emerged with the advance of powerful classification algorithms, is the ability of cryo-EM to capture multiple states of a molecule all at once from the same sample (see [7,8]), and to achieve high resolution with only tens of thousands of particles (e.g. [9]). The extraordinary achievements in the past 2 years, which have provided new insights in structure and function of molecules in the size range of 170 kDa (e.g. γ-secretase [10–12]) to several MDa (e.g. ribosomes [4], viruses [13], large ion channels [14] and spliceosome [15,16]), give us pause to reflect on the past, but also to ponder what directions the field might take in the future. We take this review as an opportunity to sketch out promising developments that will expand the power of cryo-EM in two important directions: imaging of short-lived (10–1000 ms) states (‘time-resolved cryo-EM’), and the ability to recover an entire continuum of coexisting states from the same sample.
Time-resolved cryo-EM
In time-resolved EM studies, a biological reaction is stopped at multiple time points by fast-freezing (i.e. cryo-plunging) or chemical fixation (e.g. negative-staining by heavy metal salt, and cross-linking by formaldehyde), and the trapped biological complexes are visualized by conventional transmission electron microscopy (TEM) followed by 3D reconstruction. Time-resolved EM combines the structural study with kinetics, by capturing kinetic intermediate states in a biological reaction, and may ultimately provide ‘movies’ of a biological complex functioning in real time. These methods have the potential to provide key insights into the mechanism of action of the complex.
Time resolution can be easily achieved in EM studies without the need for special equipment, when the pace of the reaction is slow compared with the length of the step required for grid preparation via blotting. The blotting method, i.e. first applying the specimen on the grid then blotting with filter paper to remove excess solution, usually takes a few seconds. Microtubule dynamics [17] and membrane fusion [18], for example, have been studied using time-resolved cryo-EM only a few years after the invention of the rapid freezing method [19]. This slow-paced time-resolved cryo-EM method is also applicable to the process of virus capsid maturation, which spans several days [20]. More recently, Mulder et al. [21] used negative-staining EM to study the progress of ribosome biogenesis, particularly the biogenesis of the small subunit of the E. coli ribosome, during a time interval of 1 to 120 min. Fischer et al. [22] followed the progress of back-translocation of a translating E. coli ribosome, a process catalyzed by LepA (a.k.a. EF4), using time-resolved cryo-EM. In both cases, the reaction was quite slow, allowing samples of the product intermediates to be taken in intervals of minutes.
Much faster biologically relevant reactions, on the time scale of milliseconds, can still be studied by cryo-EM, because the rapid-freezing step itself takes a fraction of a millisecond (reviewed in [23]). Such fast reactions require a means of mixing, reacting and depositing the product on the grid in a fast, controlled way. Over the years various methods of fast specimen preparation have been introduced, including spray-freezing [24], mixing-spraying [25], flash-photolysis [26] and capillary action [27]. These will be quickly reviewed below. A major bottleneck in trying to achieve high-resolution structures in all these approaches is low data yield (i.e. the number of biological complexes obtainable per EM grid), compared with the standard blotting method.
In their pioneering work, Berriman and Unwin [24] developed a method of spray-freezing where one reactant resides on the (pre-blotted) grid and the other reactant is sprayed onto the grid in fine droplets (Fig. 1). Mixing is achieved laterally on the grid itself during the brief time between spraying and plunging into the cryogen, which can be varied from 1 to 100 ms. While this method has been proven for small sprayed molecules (e.g. acetylcholine, ∼150 Da [28]), there is a question whether mixing and reacting on the grid itself may face obstacles for molecules in the size range of tRNA (∼26 kDa), translation factors or entire ribosomal subunits. As for the data yield, although the spread of acetylcholine was limited to a finite area surrounding the point of droplet impact, this shortcoming was compensated by the local abundance of acetylcholine receptors on the postsynaptic membrane (presented as tubular vesicles) [28].
Fig. 1.

Schematic of the spray-freezing apparatus and an image of a partially spread droplet. (a) The spray-freezing apparatus consists of a guillotine-type plunger and a pneumatic sprayer. A fiber optic sprayer-switch detects the movement of the plunger, and opens a valve for compressed nitrogen gas to set off the spray. The humidifier tube delivers 100% humid air to maintain high humidity around the grid. (b) An image of a partially spread droplet containing ferritin and tobacco mosaic virus on the surface of a thin aqueous film containing turnip yellow virus. The small circle indicates the diameter of the droplet as it would have been before hitting the surface. The intermediate and largest circles indicate the extent of the tobacco mosaic virus and the ferritin particles, respectively. Mixing happens laterally through the aqueous film. Figure adapted from [24].
In the mixing-spraying method developed by Lu et al. [25], mixing and reacting are achieved in a monolithic silicon chip, a microfluidic device with two solution inlets and one spray outlet (Fig. 2). While the time for mixing itself is fixed and in the range of 0.5 ms for all chips, the mean reaction time is defined by the length of a meandering reaction chamber, which in the present design can be varied in the whole range from 4 to 600 ms. The time of flight for the spray and the plunging time for the grid add another 5 to 40 ms, depending on the geometry [29,30]. The mixing-spraying method has been proven to work for fast reactions involving two big molecules—the ribosomal subunits [29,30] (see Case study and future improvements of the mixing-spraying method section for more details).
Fig. 2.

Experimental setup of the mixing-spraying method and the design of the mixing-spraying chip. (a) Experimental setup. Two solutions (1 and 2) are injected into the mixing-spraying chip, mixed and reacted for a short, defined time. The mixture solution meets compressed nitrogen gas (Gas) and is sprayed into a plume of droplets. The droplets fly to the EM grid, which is plunging into the cryogen. The resulting grid contains blobs of vitreous ice where the droplets hit the grid surface. (b) Design of the mixer. The two solutions with a total flow rate of 6 µl/s are mixed completely within 0.5 ms in the four tandem butterfly-shaped mixer channels. (c) Design of the different reaction channels. The length of the reaction channel can vary to achieve different reaction times (from 4 to 500 ms) on different chips. Figure adapted from [25,30].
In the flash-photolysis method [26,31], the grid is pre-coated with all the components for the reaction, one of which, such as ATP or GTP, is bound in a light-sensitive ‘cage’. A flash of UV light opens the molecular cage, releasing the reagent within, and thereby initiating the reaction. After a short controlled time interval, on the order of milliseconds, the reaction is quenched by freezing. Compared with the two above-mentioned spraying methods [24,25], the photolysis method is distinguished by employing regular blotting, which results in a continuous layer of thin ice containing the mixture of reactants, and therefore will have high data yield, comparable with that in the usual blotting method. There is a concern about heating of the specimen caused by the flashlight, but it can be alleviated or mitigated by the use of thick, aluminum-coated grids [31]. The flash-photolysis method is mainly limited by the availability of photoactive substrates, including small molecules, peptides and proteins (reviewed in [32]).
Recently, another time-resolved cryo-EM method based on capillary action was developed, but thus far only applied to some inorganic chemistry reactions [27]. Here the specimen is delivered to the grid via a capillary mounted perpendicular to the grid, and excess fluid is removed by another capillary mounted parallel to the grid. Simulations by these authors suggest that the capillary method results in reduced shear in the specimen and lower absorption of particles to the grid. The shortest reaction time is estimated to be ∼200 ms.
For completeness, we should mention that in the time range of sub-millisecond to femtosecond (10−15 s), the structural dynamics of some photo-responsive systems, e.g. amyloid fibrils co-crystallized with dyes [33,34], can still be studied using the so-called 4D cryo-EM technique [35]. In this method, analogous to flash photography, the sample is heated with a femtosecond pulsed laser and immediately diffracted with TEM [36].
Case study and future improvements of the mixing-spraying method
Both Shaikh et al. [29] and Chen et al. [30] studied the ribosome subunit association reaction using the mixing-spraying time-resolved cryo-EM method, as a proof-of-principle of the method and a first stride towards visual-kinetic studies of fast biological processes. The association of the small and large ribosomal subunits is an essential step in the initiation of translation, a step that also involves mRNA, initiator tRNA and a number of initiation factors in vivo (see, for example, [37–40]). The two groups used a simplified system that only contains the small and large ribosomal subunits, and initiated spontaneous subunit association by using a high Mg2+ buffer. Shaikh et al. analyzed cryo-EM datasets corresponding to 9 and 43 ms reaction times to identify the intermediate structures in the subunit association reaction, and proposed that eight intersubunit bridges (i.e. the contacts between the two subunits) form within 9 ms while the other four bridges take longer than 43 ms to form [29].
Chen et al. [30] used 60 and 140 ms reaction times to capture the pre-equilibrium states of the subunit association reaction, as indicated by the increasing, but lower-than-equilibrium-level, population of associated ribosomes (Fig. 3a). The temporal resolution of these mixing-spraying chips were estimated, using fluidic dynamic simulation, to be several tens of milliseconds, due to the interaction of aqueous solution with the wall of reaction channel (see Methods in [30]). The fraction of associated ribosomes at various reaction times allowed the association rate constant (ka) and the dissociation constant (KD) to be estimated. Chen et al. were able to distinguish three different conformations of the newly associated ribosomes, by applying a computational classification method to the combined dataset (i.e. combining all single particle data from different reaction times, including a control experiment) (Fig. 3b). In the canonical non-rotated ribosome, all the intersubunit bridges have formed within 60 ms, and the missing bridges in the other two conformations can be readily explained by the global conformational changes. Regarding the conformational dynamics of the associated ribosomes, the ratio of the three conformations are the same for 60 and 140 ms data, indicating that the three conformations have reached equilibrium before 60 ms (Fig. 3c).
Fig. 3.

Ribosome subunit association studied using the mixing-spraying method. (a) Proportions of associated ribosome (70S) and ribosomal large subunit (50S) at various reaction times. (b) Cryo-EM maps of the associated ribosomes in three conformations and the ribosomal large subunit. From left to right: non-rotated ribosome (NR), non-rotated ribosome with swiveled small subunit (30S) head (NRs), rotated ribosome (RT) and 50S subunit. The large subunit is colored in blue/dark gray, and the small subunit is colored in yellow or green/light gray. The 30S head in the NRs ribosome is colored in orange/darker gray to highlight the conformational change. (c) Proportions of the associated ribosomes in three conformations at various times. Figure adapted from [30].
This series of observation in Chen et al. [30] is in good agreement with the results of a fast chemical probing assay [41] and a number of single-molecular fluorescence resonance energy transfer studies [42–44], but disagrees with another chemical probing assay [45] and the previous time-resolved cryo-EM study [29]. In comparing the two time-resolved cryo-EM studies, the major reason why the two studies reached different conclusions is the difference in the resolutions of maps (9–12 Å in Chen et al. [30] and 23–33 Å in Shaikh et al. [29]), which stemmed from the difference in data yield. The major reason for the low data yield in the previous applications (about 1000–2000 particles per grid) was that only the area in the thin edge of the droplets was suitable for cryo-EM data collection [25,29]. Chen et al. [30] were able to increase the data yield 10-fold (to about 10 000 particles per grid) by optimizing the spray and grid surface properties, and thus were able to apply computational classification on an abundance of particles (30 000–50 000 particles at each reaction time, and combine the data at different reaction times to perform classification so that the ratios at different reaction times are comparable), thereby revealing multiple structures at higher resolutions. We also note that the angular distribution of 70S ribosomes in all grids prepared by mixing/spraying was found to be quite similar to the distribution regularly obtained in plunge-freezing experiments employing the same grids (S. Kaledhonkar, personal communication).
The success of the proof-of-principle experiments with the mixing-spraying device invites the design of experiments that explore biological function on the millisecond scale, such as translation initiation and ribosome recycling in the protein synthesis process. In addition, reactions involving one big molecule and some small factors/ligands, for example, the decoding process during translation and the conformational changes of some membrane receptors triggered by a small effector molecule such as calcium, are also amenable to this method, provided that the conformational/compositional changes of the big molecule occur within the accessible time frame.
To make the mixing-spraying method more convenient and accessible, further improvements will include increasing the data yield, decreasing the sample consumption, and increasing the availability and affordability of mixing-spraying chips. First and foremost, increasing the data yield requires more coverage of thinly spread droplets on the grid before freezing. A promising new sprayer with 3D spraying geometry [46] proved to yield a greater number of smaller droplets than the current sprayer [25]. Continuing efforts on increasing the hydrophilicity of the grid surface (e.g. developing new coating and cleaning protocols) may help the droplets spread thinner. However, the direct detector devices have dramatically increased the cryo-EM data quality and effectively alleviated the requirement for collecting large datasets, making it possible to obtain multiple reconstructions with decent resolutions (5–10 Å) from only tens of thousands of particles.
Second, the mixing-spraying method presently consumes ∼100× more sample per grid than the blotting method, because it requires micromolar concentration of sample (∼20× higher than blotting) and extra volume of solution (∼5× higher) to stabilize the spray. This sample consumption issue will pose extra burden on the upstream biochemistry, especially when the biological sample is hard to purify. A possible solution that we are testing is preparing multiple grids in one plunge. The use of a more controllable specimen dispensing system (e.g. Spotiton [47] and micro-capillary method [48]) may also help minimizing the sample consumption.
Third, the current mixing-spraying chip is made from silicon and glass, for it needs to withstand ∼106 Pa liquid pressure drop in the chip, mainly in the mixer channel. However, it takes a few weeks and on average hundreds of dollars to manufacture one chip (production steps including etching and dicing the silicon wafer and bonding it with glass). To this end, we are experimenting to apply a three-dimensional micromixer to decrease the pressure drop within the chip [49], so that we can switch to plastic (e.g. polydimethylsiloxane) for faster and cheaper manufacture of the chips. We envision that with all these efforts on further improvement, the mixing-spraying method will become a routine method for time-resolved cryo-EM in the near future.
Mapping and visualizing a continuum of states
The challenge posed by conformational and compositional heterogeneity
It is difficult to overemphasize the importance of classification in cryo-EM. From the outset, one of the main problems in addressing heterogeneity lies in the fact that each molecule contained in the electron micrograph is represented by a single projection only and thus, that the variation among the images collected may be due to two entirely unrelated factors: the variation of the molecule's orientation and the variation of its conformation/composition. It is the commingling of these effects that makes the recovery of the true structures existing in the specimen quite challenging [50,51]. Processive molecular machines such as the much-studied ribosome offer excellent examples for molecules varying both in conformation and composition. As the ribosome goes through its work cycle, once for each amino acid to be added to the nascent polypeptide chain, it changes its conformation in a profound way, manifested by changes in the constellation of its two subunits (ratchet-like intersubunit rotation [52]) as well as their domains (e.g. swing of the L1 stalk on the large subunit [53], and head swivel of the small subunit [54], see [55]). At the same time, the composition of the whole complex varies as tRNAs and translation factors processively arrive and depart from the ribosome.
Initial approaches of supervised classification, based on similarity to one or more known templates (see [56]) have meanwhile been replaced by sophisticated maximum-likelihood approaches [50,57]. As its forerunner ML3D [50], Relion [58] is an iterative algorithm that splits the data into a pre-given number of K classes. A probability distribution is assigned in each cycle to angular parameters (Eulerian angles of each projection), class membership and the density of each voxel in each of the K reconstructions.
Even though Relion-based classification and similar maximum-likelihood-based schemes implemented in other software packages have been successful in many cryo-EM studies (e.g. [3,9,10]), they have a number of shortcomings: their principal assumption is that the molecule exists in discrete configurations, whose number K has to be guessed; a minor issue is that it requires an initial starting map. In addition, related to the fact that K is unknown, the classification often has to proceed along several hierarchical stages, following more or less ad hoc decisions. The algorithm also does not usually lead to convergence but the iterative run must be terminated according to some heuristic criteria [59,60]. Another approach ([61,62]) requires no starting template map but is nevertheless limited in the same way to a discrete (pre-given) number of classes.
The limitation to a discrete number of classes is not just a technical problem that could be overcome by increasing the number of classes; rather, such limitation prevents the study of all processes that are continuous in nature. Prominent examples of structures that exhibit a continuum of states are provided by the work cycles of the ribosome (e.g. [55,63], see [38,64]) and the ATPase (see, for example, [65–67]).
Classification of a continuum of states
In a recent article [63] we proposed a radically different method, capable of dealing with projections from an ensemble of molecules that exhibit a continuum of states, requiring no knowledge of the number of states/classes. This method is based on a technique called manifold embedding [68]. In the following, we describe this approach briefly, but without being able to do justice to its underlying mathematical apparatus—here the reader is referred to the Supplement of Dashti et al. and references provided therein.
Given a large dataset containing projections of molecules in different states and lying in different orientations, we begin with a classification of the data into different orientations—the assumption here is that the changes in structure are relatively small so that a simple iterative refinement algorithm starting with a common template [69] can be used. Moreover, we choose angular increments such that the variation in the projection due to the angular increment is large compared with the changes in structure [70]. For illustration, consider that the largest compositional change during the work cycle of the ribosome is the binding of EF-G effecting mRNA–tRNA translocation, which amounts to the addition of only 3% to the total molecular mass of the ribosome complex. (It should be noted that the manifold embedding approach described below is capable, in principle, of doing away with the alignment and orientational pre-classification of the data altogether, but the computational effort is considerably more involved, and a fully automated performance of an analysis that includes both orientational and conformational/compositional classification has yet to be demonstrated. Thus it is mainly for practical reasons that at this stage of development of the method the data enter the analysis in a conventionally pretreated way. It should also be noted in this context that small molecules exhibiting dramatic conformational changes pose problems since the simplifying assumptions regarding relative size of these changes in the projection image do not hold.)
With these assumptions, we can characterize the subset of data falling into any given projection direction as a local (i.e. in angular space) manifestation of the same conformational spectrum. Each subset forms what is called a manifold—if each image is represented by an N-dimensional vector (N being the number of pixels), then the vector end points form a multidimensional cloud whose topology and internal distribution are characteristic for the conformational spectrum of the molecule as manifested in the experiment (see [71]).
In manifold embedding, the manifold is described in a Euclidean coordinate system tailored to its special topology (Fig. 4) [68]. In the next step, the manifold is represented in a low-dimensional space of ranked eigenvectors that depict the most important variations. The dimensionality of that space, much smaller than N and in practice not exceeding five in cases that have been tried, is a measure of the number of degrees of freedom of the molecule. For example, if the two ribosomal subunits were to rotate with respect to another, and the small subunit head were to swivel independently—a realistic scenario—the number of degrees of freedom would be 2. The next, most important and most involved step is a mapping designed to relate the manifold representations of all projection directions to one another. For this mapping to be successful, good coverage along at least one great circle in angular space is required.
Fig. 4.
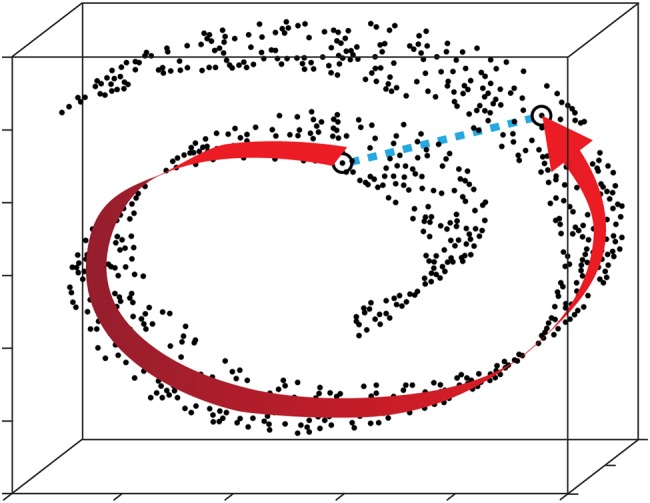
Schematic to describe the concept of manifold embedding. Each (single-particle) image is represented as a point (a vector end point) in a high-dimensional space. Similarity relationships among images are reflected by proximities among points in this space. In our example the points are clustered along a curved sheet, forming a manifold of lower dimensionality. We like to track relationships along the manifold (curved arrow) irrespective of the Euclidean distance in the high-dimensional space (dashed line). It should be noted that in the case of data without heterogeneity, the point cloud would have a spherical distribution only, reflecting the presence of noise. (Design courtesy by Abbas Ourmazd.)
Broadly, the mapping yields conformational spectra along any radial line in the eigenspace describing the manifold for each projection direction. By construction, these one-dimensional spectra are strictly comparable under the assumption that conformational changes of a molecule do not depend on its orientation. Thus the consolidation of all maps into a single one is akin to a process of histogram equalization. In the end, each ‘cell’ (or multidimensional ‘voxel,’ in the space of conformations) in the consolidated multidimensional map feeds from multiple projection directions yet relates to the same conformation. The axes of the consolidated map may be considered ‘reaction coordinates’ of the molecule in motion. For instance, a projection of the multidimensional map onto the first two coordinates depicts the distribution of the two most important features in a convenient way.
In this space of conformations, we will see local maxima in the density distribution, and these maxima one could call ‘states’. A discrete set of such maxima would be taken to indicate that the system has a discrete number of ‘states.’ But, most importantly, if the total number of images is sufficiently large—in the hundreds of thousands—we will observe a continuous coverage between these local maxima, indicating a continuum of more or less populated ‘micro-states.’ By grabbing images in a local region (large enough for statistical reasons, but small enough so as not to blur out the variations) one can now reconstruct the ‘local’ structure at any point in the map of conformations.
Next, it is possible now, by application of a relationship due to Stefan Boltzmann, to interpret the occupancies of states as free-energy differences, and thus construct a free-energy landscape—all we need is to take the negative logarithm of the density of states at each point in the map (see [22,55]). In this map of free-energy differences the stable states show up as minima.
In the first application of the manifold method to a large (∼800 000 particles) dataset of 80S ribosomes from yeast [63], we see a closed pathway suggestive of the peptide-elongation cycle during translation (Fig. 5). Indeed, reconstructions from selected points of the trajectory depict the ribosome in a variety of conformations that are characteristic for different stages of the elongation cycle. Intriguingly, the ribosomes used in the experiments were purified from cell extracts using a relatively harsh treatment that eliminates most ligands (tRNAs, eEF2, eEF1α) and any translational activity, leaving us with the conclusion that in the thermal bath even empty ribosomes idle along trajectories that would be productive in the presence of all required ligands.
Fig. 5.

Conformational variability and energy landscape of the ribosome. (a) Three views of a cryo-EM map of the 80S ribosome from yeast [72], with arrows and symbols indicating four prominent conformational changes associated with the elongation work cycle of the ribosome (see key on the bottom right). (b) The energy landscape constructed by the manifold embedding technique of Dashti et al. [63], showing the preferred path followed by the ribosome. The color bar shows the energy scale. The energy range has been truncated at 2 kcal/mol to show details of the roughly triangular minimum free-energy trajectory. The error in energy determination along the trajectory is 0.05 kcal/mol. The trajectory is divided into 50 states. The pointers indicate 7 selected minima, each identified by its position in a sequence of the 50 states. Arrows along circle between successive minima indicate combinations of observed conformational changes explained on the left. Figure reproduced from [63].
Outlook
Now that cryo-EM has reached resolutions that yield structural information on the atomic scale, it is worth exploring and characterizing the entire continuum of states of a molecule. This characterization is possible since we observe an ensemble of molecules that equilibrate under the prevalent conditions of the experiment.
What distinguishes single-particle cryo-EM from other ensemble methods is that the experimental measurement is not confined to the recording of a single average, but that it is multifaceted, representing tractable information (i.e. one projection image) from every single molecule. It is here where vast unexplored potential of data mining lies since patterns in the data induced by similarities of neighboring states can be recognized even in the presence of overwhelming noise, and since this recognition of patterns will be enhanced by finer conformational sampling that results from an increase of the dataset. The manifold method introduced by Dashti et al. [63] represents a first step into this direction of exhaustive data mining.
We can go one step further and add the time dimension, asking how an equilibrium of states evolves from a pre-equilibrium system that is started by mixing two components in a molecular reaction. Time-resolved cryo-EM combined with maximum-likelihood classification already allows us to follow the migration of subpopulations of molecules from one distinct state to the other. Recent development of mixing-spraying technology that we have reviewed above permits the mixing of large molecules and the spraying of the reaction product with high data yield.
It is tempting, finally, to think of combining the two methods and see how the distribution of states of an ensemble of molecules in a pre-equilibrium system, as captured by the manifold method, evolves over time. This idea awaits further development of both techniques, particularly the time-resolved cryo-EM as it still does not produce the kinds of data yields that enable the deep data mining implicit in the manifold approach.
Acknowledgements
We thank Dr Abbas Ourmazd for a discussion and helpful comments. We would like to thank Melissa Thomas-Baum for assistance with the preparation of figures. This work was supported by HHMI and grant National Institutes of Health R01 GM55440 (to J.F.).
References
- 1.Ludtke S J, Baker M L, Chen D H, Song J L, Chuang D T, Chiu W (2008) De novo backbone trace of GroEL from single particle electron cryomicroscopy. Structure 16: 441–448. [DOI] [PubMed] [Google Scholar]
- 2.Cao E, Liao M, Cheng Y, Julius D (2013) TRPV1 structures in distinct conformations reveal activation mechanisms. Nature 504: 113–118. [DOI] [PMC free article] [PubMed] [Google Scholar]
- 3.Liao M, Cao E, Julius D, Cheng Y (2013) Structure of the TRPV1 ion channel determined by electron cryo-microscopy. Nature 504: 107–112. [DOI] [PMC free article] [PubMed] [Google Scholar]
- 4.Amunts A, Brown A, Bai X C, Llacer J L, Hussain T, Emsley P, Long F, Murshudov G, Scheres S H, Ramakrishnan V (2014) Structure of the yeast mitochondrial large ribosomal subunit. Science 343: 1485–1489. [DOI] [PMC free article] [PubMed] [Google Scholar]
- 5.Brown A, Amunts A, Bai X C, Sugimoto Y, Edwards P C, Murshudov G, Scheres S H, Ramakrishnan V (2014) Structure of the large ribosomal subunit from human mitochondria. Science 346: 718–722. [DOI] [PMC free article] [PubMed] [Google Scholar]
- 6.Greber B J, Boehringer D, Leibundgut M, Bieri P, Leitner A, Schmitz N, Aebersold R, Ban N (2014) The complete structure of the large subunit of the mammalian mitochondrial ribosome. Nature 515: 283–286. [DOI] [PubMed] [Google Scholar]
- 7.Frank J. (2006) Three-dimensional Electron Microscopy of Macromolecular Assemblies: Visualization of Biological Molecules in Their Native State, 2nd edn. (Oxford University Press, USA: ). [Google Scholar]
- 8.Frank J. (2013) Story in a sample—the potential (and limitations) of cryo-electron microscopy applied to molecular machines. Biopolymers 99: 832–836. [DOI] [PMC free article] [PubMed] [Google Scholar]
- 9.Bai X C, Fernandez I S, McMullan G, Scheres S H (2013) Ribosome structures to near-atomic resolution from thirty thousand cryo-EM particles. Elife 2: e00461. [DOI] [PMC free article] [PubMed] [Google Scholar]
- 10.Lu P, Bai X C, Ma D, Xie T, Yan C, Sun L, Yang G, Zhao Y, Zhou R, Scheres S H et al. (2014) Three-dimensional structure of human gamma-secretase. Nature 512: 166–170. [DOI] [PMC free article] [PubMed] [Google Scholar]
- 11.Sun L, Zhao L, Yang G, Yan C, Zhou R, Zhou X, Xie T, Zhao Y, Wu S, Li X et al. (2015) Structural basis of human γ-secretase assembly. Proc. Natl. Acad. Sci. USA 112: 6003–6008. [DOI] [PMC free article] [PubMed] [Google Scholar]
- 12.Bai X-c, Yan C, Yang G, Lu P, Ma D, Sun L, Zhou R, Scheres S H W, Shi Y (2015) An atomic structure of human [ggr]-secretase. Nature 525: 212–217. [DOI] [PMC free article] [PubMed] [Google Scholar]
- 13.Zhang X, Ge P, Yu X, Brannan J M, Bi G, Zhang Q, Schein S, Zhou Z H (2013) Cryo-EM structure of the mature dengue virus at 3.5-Å resolution. Nat. Struct. Mol. Biol. 20: 105–110. [DOI] [PMC free article] [PubMed] [Google Scholar]
- 14.Zalk R, Clarke O B, des Georges A, Grassucci R A, Reiken S, Mancia F, Hendrickson W A, Frank J, Marks A R (2015) Structure of a mammalian ryanodine receptor. Nature 517: 44–49. [DOI] [PMC free article] [PubMed] [Google Scholar]
- 15.Nguyen T H D, Galej W P, Bai X-c, Savva C G, Newman A J, Scheres S H W, Nagai K (2015) The architecture of the spliceosomal U4/U6.U5 tri-snRNP. Nature 523: 47–52. [DOI] [PMC free article] [PubMed] [Google Scholar]
- 16.Yan C, Hang J, Wan R, Huang M, Wong C C L, Shi Y (2015) Structure of a yeast spliceosome at 3.6-angstrom resolution. Science 349: 1182–1191. [DOI] [PubMed] [Google Scholar]
- 17.Mandelkow E M, Mandelkow E, Milligan R A (1991) Microtubule dynamics and microtubule caps: a time-resolved cryo-electron microscopy study. J. Cell Biol. 114: 977–991. [DOI] [PMC free article] [PubMed] [Google Scholar]
- 18.Siegel D P, Burns J L, Chestnut M H, Talmon Y (1989) Intermediates in membrane fusion and bilayer/nonbilayer phase transitions imaged by time-resolved cryo-transmission electron microscopy. Biophys. J. 56: 161–169. [DOI] [PMC free article] [PubMed] [Google Scholar]
- 19.Dubochet J, Lepault J, Freeman R, Berriman J A, Homo J C (1982) Electron microscopy of frozen water and aqueous solutions. J. Microsc. 128: 219–237. [Google Scholar]
- 20.Heymann J B, Cheng N, Newcomb W W, Trus B L, Brown J C, Steven A C (2003) Dynamics of herpes simplex virus capsid maturation visualized by time-lapse cryo-electron microscopy. Nat. Struct. Biol. 10: 334–341. [DOI] [PubMed] [Google Scholar]
- 21.Mulder A M, Yoshioka C, Beck A H, Bunner A E, Milligan R A, Potter C S, Carragher B, Williamson J R (2010) Visualizing ribosome biogenesis: parallel assembly pathways for the 30S subunit. Science 330: 673–677. [DOI] [PMC free article] [PubMed] [Google Scholar]
- 22.Fischer N, Konevega A L, Wintermeyer W, Rodnina M V, Stark H (2010) Ribosome dynamics and tRNA movement by time-resolved electron cryomicroscopy. Nature 466: 329–333. [DOI] [PubMed] [Google Scholar]
- 23.Dubochet J, Adrian M, Chang J J, Homo J C, Lepault J, McDowall A W, Schultz P (1988) Cryo-electron microscopy of vitrified specimens. Q Rev. Biophys. 21: 129–228. [DOI] [PubMed] [Google Scholar]
- 24.Berriman J, Unwin N (1994) Analysis of transient structures by cryo-microscopy combined with rapid mixing of spray droplets. Ultramicroscopy 56: 12. [DOI] [PubMed] [Google Scholar]
- 25.Lu Z, Shaikh T R, Barnard D, Meng X, Mohamed H, Yassin A, Mannella C A, Agrawal R K, Lu T -M, Wagenknecht T (2009) Monolithic microfluidic mixing-spraying devices for time-resolved cryo-electron microscopy. J. Struct. Biol. 168: 388–395. [DOI] [PMC free article] [PubMed] [Google Scholar]
- 26.Menetret J F, Hofmann W, Schroder R R, Rapp G, Goody R S (1991) Time-resolved cryo-electron microscopic study of the dissociation of actomyosin induced by photolysis of photolabile nucleotides. J. Mol. Biol. 219: 139–144. [DOI] [PubMed] [Google Scholar]
- 27.Croote D, Godfrin M P, Bose A, Tripathi A, Lee J (2013) A platform for retaining native morphology at sub-second time scales in cryogenic transmission electron microscopy. Rev. Sci. Instrum. 84: 053707. [DOI] [PubMed] [Google Scholar]
- 28.Unwin N. (1995) Acetylcholine receptor channel imaged in the open state. Nature 373: 37–43. [DOI] [PubMed] [Google Scholar]
- 29.Shaikh T R, Yassin A S, Lu Z, Barnard D, Meng X, Lu T-M, Wagenknecht T, Agrawal R K (2014) Initial bridges between two ribosomal subunits are formed within 9.4 milliseconds, as studied by time-resolved cryo-EM. Proc. Natl. Acad. Sci. USA 111: 9822–9827. [DOI] [PMC free article] [PubMed] [Google Scholar]
- 30.Chen B, Kaledhonkar S, Sun M, Shen B, Lu Z, Barnard D, Lu T M, Gonzalez R L Jr, Frank J (2015) Structural dynamics of ribosome subunit association studied by mixing-spraying time-resolved cryogenic electron microscopy. Structure 23: 1097–1105. [DOI] [PMC free article] [PubMed] [Google Scholar]
- 31.Shaikh T R, Barnard D, Meng X, Wagenknecht T (2009) Implementation of a flash-photolysis system for time-resolved cryo-electron microscopy. J. Struct. Biol. 165: 184–189. [DOI] [PMC free article] [PubMed] [Google Scholar]
- 32.Shigeri Y, Tatsu Y, Yumoto N (2001) Synthesis and application of caged peptides and proteins. Pharmacol. Ther. 91: 85–92. [DOI] [PubMed] [Google Scholar]
- 33.Fitzpatrick A W, Lorenz U J, Vanacore G M, Zewail A H (2013) 4D cryo-electron microscopy of proteins. J. Am. Chem. Soc. 135: 19123–19126. [DOI] [PubMed] [Google Scholar]
- 34.Fitzpatrick A W, Park S T, Zewail A H (2013) Exceptional rigidity and biomechanics of amyloid revealed by 4D electron microscopy. Proc. Natl. Acad. Sci. USA 110: 10976–10981. [DOI] [PMC free article] [PubMed] [Google Scholar]
- 35.Zewail A H. (2010) Four-dimensional electron microscopy. Science 328: 187–193. [DOI] [PubMed] [Google Scholar]
- 36.Flannigan D J, Zewail A H (2012) 4D electron microscopy: principles and applications. Acc. Chem. Res. 45: 1828–1839. [DOI] [PubMed] [Google Scholar]
- 37.Ramakrishnan V. (2002) Ribosome structure and the mechanism of translation. Cell 108: 557–572. [DOI] [PubMed] [Google Scholar]
- 38.Schmeing T M, Ramakrishnan V (2009) What recent ribosome structures have revealed about the mechanism of translation. Nature 461: 1234–1242. [DOI] [PubMed] [Google Scholar]
- 39.Milon P, Rodnina M V (2012) Kinetic control of translation initiation in bacteria. Crit. Rev. Biochem. Mol. Biol. 47: 334–348. [DOI] [PubMed] [Google Scholar]
- 40.Caban K, Gonzalez R L Jr (2015) The emerging role of rectified thermal fluctuations in initiator aa-tRNA- and start codon selection during translation initiation. Biochimie 114: 30–38. [DOI] [PMC free article] [PubMed] [Google Scholar]
- 41.Nguyenle T, Laurberg M, Brenowitz M, Noller H F (2006) Following the dynamics of changes in solvent accessibility of 16 S and 23 S rRNA during ribosomal subunit association using synchrotron-generated hydroxyl radicals. J. Mol. Biol. 359: 1235–1248. [DOI] [PubMed] [Google Scholar]
- 42.Cornish P V, Ermolenko D N, Noller H F, Ha T (2008) Spontaneous intersubunit rotation in single ribosomes. Mol. Cell 30: 578–588. [DOI] [PMC free article] [PubMed] [Google Scholar]
- 43.Cornish P V, Ermolenko D N, Staple D W, Hoang L, Hickerson R P, Noller H F, Ha T (2009) Following movement of the L1 stalk between three functional states in single ribosomes. Proc. Natl Acad. Sci. USA 106: 2571–2576. [DOI] [PMC free article] [PubMed] [Google Scholar]
- 44.Ning W, Fei J, Gonzalez R L Jr (2014) The ribosome uses cooperative conformational changes to maximize and regulate the efficiency of translation. Proc. Natl Acad. Sci. USA 111: 12073–12078. [DOI] [PMC free article] [PubMed] [Google Scholar]
- 45.Hennelly S P, Antoun A, Ehrenberg M, Gualerzi C O, Knight W, Lodmell J S, Hill W E (2005) A time-resolved investigation of ribosomal subunit association. J. Mol. Biol. 346: 1243–1258. [DOI] [PubMed] [Google Scholar]
- 46.Lu Z, Barnard D, Shaikh T R, Meng X, Mannella C A, Yassin A, Agrawal R, Wagenknecht T, Lu T M (2014) Gas-assisted annular microsprayer for sample preparation for time-resolved cryo-electron microscopy. J Micromech. Microeng. 24: 115001. [DOI] [PMC free article] [PubMed] [Google Scholar]
- 47.Jain T, Sheehan P, Crum J, Carragher B, Potter C S (2012) Spotiton: a prototype for an integrated inkjet dispense and vitrification system for cryo-TEM. J. Struct. Biol. 179: 68–75. [DOI] [PMC free article] [PubMed] [Google Scholar]
- 48.Kemmerling S, Arnold S A, Bircher B A, Sauter N, Escobedo C, Dernick G, Hierlemann A, Stahlberg H, Braun T (2013) Single-cell lysis for visual analysis by electron microscopy. J. Struct. Biol. 183: 467–473. [DOI] [PubMed] [Google Scholar]
- 49.Feng X, Ren Y, Jiang H (2014) Effect of the crossing-structure sequence on mixing performance within three-dimensional micromixers. Biomicrofluidics 8: 034106. [DOI] [PMC free article] [PubMed] [Google Scholar]
- 50.Scheres S H W, Gao H, Valle M, Herman G T, Eggermont P P B, Frank J, Carazo J-M (2007) Disentangling conformational states of macromolecules in 3D-EM through likelihood optimization. Nat. Meth. 4: 27–29. [DOI] [PubMed] [Google Scholar]
- 51.Sigworth F J. (2007) From cryo-EM, multiple protein structures in one shot. Nat. Methods 4: 20–21. [DOI] [PubMed] [Google Scholar]
- 52.Frank J, Agrawal R K (2000) A ratchet-like inter-subunit reorganization of the ribosome during translocation. Nature 406: 318–322. [DOI] [PubMed] [Google Scholar]
- 53.Valle M, Zavialov A, Sengupta J, Rawat U, Ehrenberg M, Frank J (2003) Locking and unlocking of ribosomal motions. Cell 114: 123–134. [DOI] [PubMed] [Google Scholar]
- 54.Ratje A H, Loerke J, Mikolajka A, Brunner M, Hildebrand P W, Starosta A L, Donhofer A, Connell S R, Fucini P, Mielke T et al. (2010) Head swivel on the ribosome facilitates translocation by means of intra-subunit tRNA hybrid sites. Nature 468: 713–716. [DOI] [PMC free article] [PubMed] [Google Scholar]
- 55.Agirrezabala X, Liao H Y, Schreiner E, Fu J, Ortiz-Meoz R F, Schulten K, Green R, Frank J (2012) Structural characterization of mRNA-tRNA translocation intermediates. Proc. Natl Acad. Sci. USA 109: 6094–6099. [DOI] [PMC free article] [PubMed] [Google Scholar]
- 56.Valle M, Sengupta J, Swami N K, Grassucci R A, Burkhardt N, Nierhaus K H, Agrawal R K, Frank J (2002) Cryo-EM reveals an active role for aminoacyl-tRNA in the accommodation process. EMBO J 21: 3557–3567. [DOI] [PMC free article] [PubMed] [Google Scholar]
- 57.Scheres S H W. (2012) A Bayesian view on cryo-EM structure determination. J. Mol. Biol. 415: 406–418. [DOI] [PMC free article] [PubMed] [Google Scholar]
- 58.Scheres S H W. (2012) RELION: implementation of a Bayesian approach to cryo-EM structure determination. J. Struct. Biol. 180: 519–530. [DOI] [PMC free article] [PubMed] [Google Scholar]
- 59.Chen B, Shen B, Frank J (2014) Particle migration analysis in iterative classification of cryo-EM single-particle data. J. Struct. Biol. 188: 267–273. [DOI] [PMC free article] [PubMed] [Google Scholar]
- 60.Shen B, Chen B, Liao H, Frank J (2014) In: Herman GT, Frank J (eds), Computational Methods for Three-Dimensional Microscopy Reconstruction, pp. 67–95 (Birkhauser, Basel; ). [Google Scholar]
- 61.Elmlund H, Lundqvist J, Al-Karadaghi S, Hansson M, Hebert H, Lindahl M (2008) A new cryo-EM single-particle ab initio reconstruction method visualizes secondary structure elements in an ATP-fueled AAA+ motor. J. Mol. Biol. 375: 934–947. [DOI] [PubMed] [Google Scholar]
- 62.Elmlund D, Davis R, Elmlund H (2010) Ab initio structure determination from electron microscopic images of single molecules coexisting in different functional states. Structure 18: 777–786. [DOI] [PubMed] [Google Scholar]
- 63.Dashti A, Schwander P, Langlois R, Fung R, Li W, Hosseinizadeh A, Liao H Y, Pallesen J, Sharma G, Stupina V A et al. (2014) Trajectories of the ribosome as a Brownian nanomachine. Proc. Natl. Acad. Sci. USA 111: 17492–17497. [DOI] [PMC free article] [PubMed] [Google Scholar]
- 64.Frank J, Gonzalez R L (2010) Structure and dynamics of a processive Brownian motor: the translating ribosome. Annu. Rev. Biochem. 79: 381–412. [DOI] [PMC free article] [PubMed] [Google Scholar]
- 65.Kaplan J H. (2002) Biochemistry of NA,K-ATPASE. Annu. Rev. Biochem. 71: 511–535. [DOI] [PubMed] [Google Scholar]
- 66.Jorgensen P L, Håkansson K O, Karlish S J D (2003) Structure and mechanism of Na,K-ATPASE: functional sites and their interactions. Annu. Rev. Physiol. 65: 817–849. [DOI] [PubMed] [Google Scholar]
- 67.Pedersen P. (2007) Transport ATPases into the year 2008: a brief overview related to types, structures, functions and roles in health and disease. J. Bioenerg. Biomembr. 39: 349–355. [DOI] [PubMed] [Google Scholar]
- 68.Schwander P, Fung R, Ourmazd A (2014) Conformations of macromolecules and their complexes from heterogeneous datasets. Philos. Trans. R Soc. B Biol. Sci. 369: 20130567. [DOI] [PMC free article] [PubMed] [Google Scholar]
- 69.Penczek P A, Grassucci R A, Frank J (1994) The ribosome at improved resolution: new techniques for merging and orientation refinement in 3D cryo-electron microscopy of biological particles. Ultramicroscopy 53: 251–270. [DOI] [PubMed] [Google Scholar]
- 70.Fu J, Gao H, Frank J (2007) Unsupervised classification of single particles by cluster tracking in multi-dimensional space. J. Struct. Biol. 157: 226–239. [DOI] [PubMed] [Google Scholar]
- 71.van Heel M, Frank J (1981) Use of multivariates statistics in analysing the images of biological macromolecules. Ultramicroscopy 6: 187–194. [DOI] [PubMed] [Google Scholar]
- 72.Frank J, Gao H, Sengupta J, Gao N, Taylor D J (2007) The process of mRNA–tRNA translocation. Proc. Natl. Acad. Sci. 104: 19671–19678. [DOI] [PMC free article] [PubMed] [Google Scholar]