Abstract
Natural antibodies are used widely for important applications such as biomedical analysis, cancer therapy, and directed drug delivery, but they are expensive and may have limited stability. This study describes synthesis of antibody-like binding sites by molecular imprinting on silica nanoparticles (SiNP) using a combination of four organosilane monomers with amino acid-like side chains providing hydrophobic, hydrophilic, and H-bonding interactions with target proteins. This approach provided artificial antibody (AA) nanoparticles with good selectivity and specificity to binding domains on target proteins in a relatively low-cost synthesis. The AAs were made by polymer grafting onto SiNPs for human serum albumin (HSA) and glucose oxidase (GOx). Binding affinity, selectivity, and specificity was compared to several other proteins using adsorption isotherms and surface plasmon resonance (SPR). The Langmuir–Freundlich adsorption model was used to obtain apparent binding constants (KLF) from binding isotherms of HSA (6.7 × 10⁴) and GOx (4.7 × 10⁴) to their respective AAs. These values were 4–300 fold larger compared to a series of nontemplate proteins. SPR binding studies of AAs with proteins attached to a gold surface confirmed good specificity and revealed faster binding for the target proteins compared to nontarget proteins. Target proteins retained their secondary structures upon binding. Binding capacity of AAHSA for HSA was 5.9 mg HSA/g compared to 1.4 mg/g for previously report imprinted silica beads imprinted with poly(aminophenyl)boronic acid. Also, 90% recovery for HSA spiked into 2% calf serum was found for AAHSA.
Keywords: molecular imprinting, silica nanoparticles, human serum albumin (HSA), surface plasmon resonance (SPR), Langmuir–Freundlich adsorption
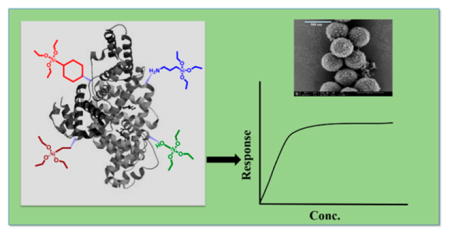
Graphical Abstract
INTRODUCTION
Synthesizing artificial receptor sites mimicking those of antibodies is a major challenge with potentially large payback in advanced materials for medical imaging, biosensors, biochemical separations, and drug delivery.1–3 Antibodies are part of the human body’s immune system, and they have been used in various scientific and medical disciplines due to their high affinity and specificity toward antigens.4–6 They are essential components for immunoassays and other bioanalytical applications,7–14 and are key components of novel and effective cancer immunotherapies.15–18 We have used antibodies in our laboratory in modern microfluidics devices to achieve ultra-sensitive multiplexed protein assay.19–23 While a wide variety of antibodies are commercially available, isolation and purification makes them quite expensive, and storage stability can be an issue.24 Recombinant technologies do not yet provide a general alternative.25–27 Thus, molecular imprinting of nanoparticles could yield high surface area, multiple-binding-site reagents with efficient, selective binding that could substitute for natural antibodies in some applications with significant advantages in cost and stability.
Recognition of small molecules and ions by artificial receptor sites has been moderately successful.28,29 However, making artificial receptors with high affinity for proteins comparable to natural antibodies is complicated by the size, structural diversity, and flexibility of the proteins.30,31 Surface molecular imprinting has been done by mimicking binding pockets using hydrogels polymerized on a flat surface from monomers that interact with the target protein in several modes such as hydrophobic, ion-dipole, and H-bonding.32–34 Following polymerization, the target is removed leaving a binding site with complementary shape, size and functional groups. Yin et al. reported artificial antibodies for lysozyme on track-etched polyethylene tetraphthalate with selectivity better than for similar sized cytochrome c.1 Zayats et al. imprinted polyacrylamide hydrogels with maltose binding proteins (MBP) on a glass slide.32
Shiomi et al. reported covalent immobilization of template protein on microporous silica and used two kinds of organosilanes to enhance affinity.35 However, synthesis of high affinity, high selectivity binding sites for proteins using this approach on nanoparticles is only beginning to be explored.36 Attempts have been made to synthesize artificial antibody binding sites for proteins using silane regents on solid surfaces.37–43 Li et al. showed that hydrophilic and hydrophobic interactions are major factors for recognition of template proteins using four silane monomers on chitosan microspheres.39 Abbas et al. synthesized stable, reusable imprinted polymers for proteins on gold nanorods using siloxane copolymerization.44 Cumbo et al. used multiple polymerizable organosilane monomers featuring different functional groups to construct virus-binding sites on silica nanoparticles.45 This approach produced molecular imprinted polymers on silica nanoparticles and created binding sites that mimic the organization of amino-acid side chains in antibodies with good specificity and selectivity for a tomato virus. Groups in the binding site featured hydrophilic, hydrophobic and H-bonding interactions with the virus’s protein coat.
Herein, we report the synthesis of selective artificial binding sites for proteins human serum albumin (HSA) and glucose oxidase (GOx) on silica nanoparticles using mixtures of organosilane monomers. Specifically, we constructed artificial antibody (AA) binding sites on 400 nm diameter silica nanoparticles using four monomers featuring hydrophobic, hydrophilic, and H-bonding interactions to ensure selective binding affinity and selectivity. The AA for HSA showed high selectivity toward target antigen protein HSA, that was better than for bovine serum albumin (BSA), which shares 76% sequence homology with HSA, and the nonhomologues glucose oxidase (GOx), lysozyme and hemoglobin. The apparent Langmuir–Freundlich binding constant (KLF) for AAHSA and HSA was 6.7 × 10⁴ (mL/mg)1/n, 4–300 times higher than that of the 4 other test proteins. The apparent association rate constant (ka) for AAHSA binding to HSA using surface plasmon resonance was 1.67 (mg/mL)−1 sec−1 2 to 85-fold larger than for other test proteins. Sites for glucose oxidase (AAGOx) on silica nanoparticles were similarly very specific for GOx. Bound target proteins retained their secondary structures as they do when bound to cognate antibodies. This work demonstrates artificial antibody sites for proteins for the first time by polymerizing four different monomers on silica nanoparticle surfaces. The organosilane monomers were chosen to mimic amino acid side chains that bind to antibodies to increase selectivity and specificity by facilitating antibody-protein-like interactions in addition to relying on size and shape recognition.
EXPERIMENTAL SECTION
Chemicals and Materials
Tetraethylorthosilicate (TEOS, ≥ 99%), (3-aminopropyl)-triethoxysilane (APTES, ≥ 98%), glutaraldehyde (Grade I, 25% in water), human serum albumin (HSA, lyophilized powder), glucose oxidase (GOx, type X-S, lyophilized powder), lysozyme (lyophilized powder), bovine serum albumin (BSA, lyophilized powder), hemoglobin (Hb, lyophilized powder), ammonium hydroxide solution (ACS reagent, 28–30%), ethanol (200 proof), hydrochloric acid (ACS reagent 37%), triton X-100, TWEEN 20, sodium phosphate dibasic and sodium phosphate monobasic, Bradford reagents, 3-(N,N-dimethylamino) propyl-N-ethylcarbodiimide (EDC), N-Hydroxysulfosuccinimide (NHSS), newborn calf serum, FITC (fluorescein isothiocyanate) and glycine were from Sigma–Aldrich. Hydroxymethyltriethoxysilane (HMTEOS), n-propyl-triethoxysilane (PTES), benzyltriethoxysilane (BTES) were from Gelest, Inc. The surface plasmon resonance (SPR) chip functionalized with polyethylene glycol/carboxyl was from Reichert Technologies Life Sciences (part no. 13206061). The TEM Formvar carbon on 300 mesh Cu grid was from Ted Pella, Inc. All solutions were prepared using 18 MΩ cm water purified by passing house-distilled water through a Hydro Service and Supplies purification system. Solutions were passed through 0.45 μm filters (Fisher) before use. Silica nanoparticles (SiNP) were synthesized by a modified Stober’s process46,47 (details in Supporting Information). All the chemicals and solvents were equilibrated at room temperature prior to use. Buffer for most experiments was 10 mM phosphate, pH 7.3.
Instrumentation
Scanning electron microscopy (SEM) was a Nova NanoSEM 450 and Transmission Electron Microscopy (TEM) was Tecnai 12 (FEI). Dynamic Light Scattering (DLS) was done with an ALV/CGS-3. Zeta potential measurements were done using ZetaPlus (Brookhaven Instruments Corp.) Zeta potential analyzer. Raman spectroscopy was done with a Thermo Scientific, NXR FT-Raman instrument. Fluorescence experiment was performed using a FlexStation 3 (Molecular Devices). Circular dichroism (CD) was done with a Jasco 710 CD spectometer. The surface plasmon resonance (SPR) experiments were done using a Reichert SPR700DC dual channel flow SPR spectrometer with gold chips prefunctionalized with a mixed monolayer (10% COOH-(PEG)6-alkanethiol and 90% OH-(PEG)3-alkanethiol) at 25 °C.
Synthesis of Artificial Antibody (AA) Sites
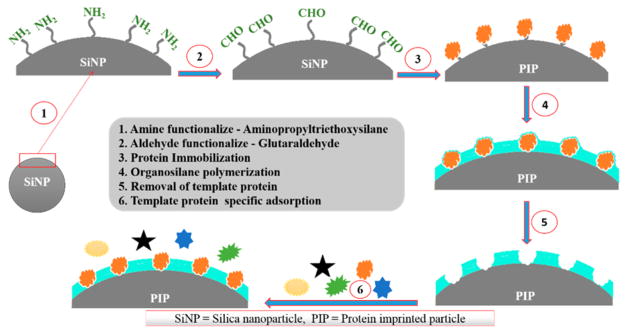
AA sites were prepared on silica nanoparticles (SiNP) for the proteins HSA and GOx. SiNP dispersions were first washed with water and phosphate buffer pH 7.3, centrifuged, and then redispersed in buffer. To functionalize the silica nanoparticles (SiNP) with amine groups, 20 mL of 3.0 mg/mL SiNP was reacted with 22 μL of aminopropyltriethyloxysilane, (APTES) in a round-bottomed flask under continuous stirring (400 rpm) for 2 h at room temperature. The resulting amine-functionalized SiNP were then centrifuged and redispersed in 20 mL of 1% (v/v) aqueous glutaraldehyde. After 20 min of incubation, the resultant aldehyde functionalized SiNP was centrifuged, washed with phosphate buffer, and redispersed in 20 mL template protein (either HSA or GOx, 50 μg/mL) solution in pH 7.3 buffer and reacted for 3 h with magnetic stirring. After that, the solution was centrifuged and reconstituted in 20 mL of pH 7.3 buffer and then 20 μL of tetraethylorthosilicate (TEOS) was added and reacted for 2 h at 10 °C under continuous stirring at 400 rpm. Then, a mixture of four organosilanes, 9 μL of each BTES, PTES, APTES, and 18 μL HMTEOS (Scheme 1) were added to synthesize the recognition site layer under the same stirring condition at 10 °C. After 48 h, the template protein was removed from the product by ultrasonic treatment for 10 min at 30 °C in 20 mL 1 M HCL containing 0.01% v/v Triton X-100. The resulting product was then incubated at 40 °C for 30 min at 600 rpm and subsequently another 30 min of ultrasonic treatment was done to remove all the template protein from the system. The synthesis pathway is shown in Scheme 2. The possible pathway for copolymerization is shown in Scheme 3. The imprinted particles were then washed 4 times, collected by centrifugation and finally reconstituted in pH 7.3 buffer and stored at 4 °C.
Scheme 1. Structure of Silane Monomers Used in the Imprinting Process.
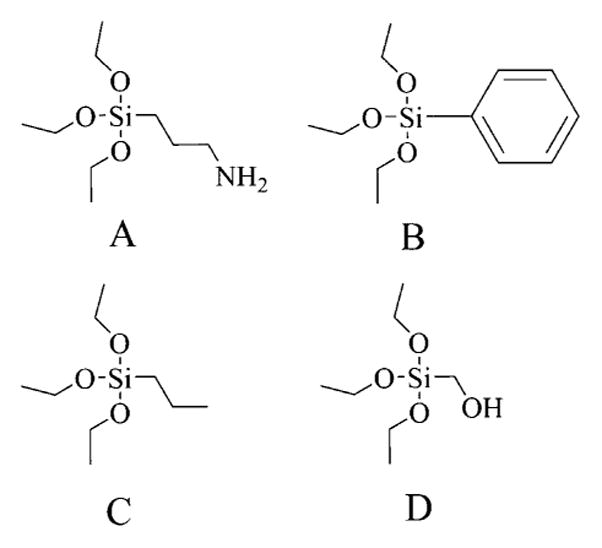
A(3-Aminopropyl)-triethoxysilane (APTES). BBenzyltriethoxysilane (BTES). Cn-Propyltriethoxysilane (PTES). DHydroxymethyltriethoxysilane (HMTEOS).
Scheme 2. Pathway for Synthesis of Artificial Antibody Sites.
Steps 1–3: The SiNP surface was aminated by APTES followed by addition of glutaraldehyde to bind the protein to the SiNP by imine bond formation between glutaraldehyde and free amines of the protein. Step 4: Monomers with amino acid-like functionality were added to generate binding sites around the template protein. Step 5: Protein template was removed with sonication in acidic detergent solution. Step 6: Binding of a range of proteins was examined to establish selectivity.
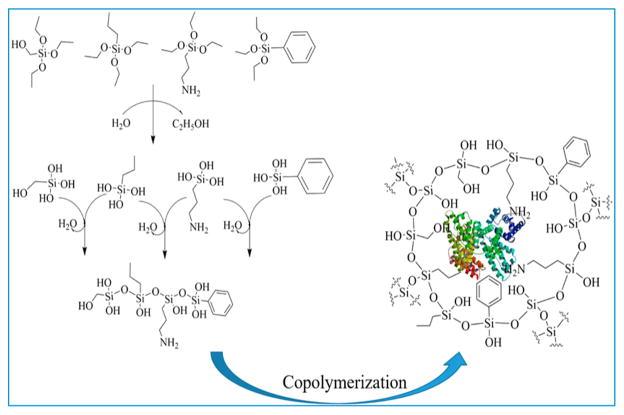
Scheme 3. Pathway of the Copolymerization of All the Organo-Silane Monomers Used Here in the Presence of Template Protein in pH 7.3 Buffer at 10°Ca.
aThe monomers undergo hydrolysis and then condensation reaction in this reaction condition to form the siloxane cage surround the template protein by incorporation amino acid like functional groups on the surface to maximum the binding efficiency.
Protein Binding
The selectivity of the AAs was tested for binding of HSA, glucose oxidase (GOx), bovine serum albumin (BSA), lysozyme and hemoglobin (Hb). A 1:1 ratio of freshly prepared protein solution (500 μL) in 10 mM phosphate buffer pH 7.3 was mixed with the corresponding 3.0 mg/mL (500 μL) AA in the same buffer and incubated for 2 h under slow rotation. Then, the solution was centrifuged at 3200 rpm for 3 min and the supernatant was analyzed by a Bradford assay to determine the amount of protein remaining in the supernatant.48 The protein in solution reacts with the Bradford reagent to form a blue product (stable unprotonated form of the Coomassie Brilliant Blue G-250 dye) with absorbance at 595 nm that was measured to quantify the proteins.35 The nominal equilibrium constant Kads is given by
where [AB] is the concentration of the bound protein, [A] and [B] are the concentrations of protein and binding sites, respectively. Kads is the ratio of rate constant for adsorption to that of desorption.49 For systems with multiple binding sites, a K-value can be estimated using the Langmuir–Freundlich equation.50,51
| (1) |
where here X is the concentration of protein bound per mg of SiNPAA, Xm is the maximum concentration of proteins bound, KLF is the Langmuir–Freundlich constant, C is concentration of protein in solution, and n is an empirical constant between 0.4 and 0.5 for protein adsorption on solid surfaces. Expressing X′ = X/Xm and C1/n as C′, KLF was estimated by nonlinear regression fits of isotherm data (Kaleidagraph) to the Langmuir–Freundlich equation using n = 0.45. Although the definition of Kads is not the same as KLF, the physical meaning is similar. Large values of KLF represent faster rates of adsorption versus desorption and larger binding affinities. Binding experiments were also performed at pH 6.3 and 8.0 with different salt concentrations (sodium chloride, 50 mM and 200 mM) to understand the effect of pH and salts for protein binding capacity.
The binding of HSA to AAHSA was also tested in serum samples. Template protein HSA was tagged by attaching fluorophor FITC, then dissolved in 2% calf serum and incubated with 3 mg/mL AAHSA. After 3 h, the AAHSA with bound FITC-tagged HSA was separated by centrifugation and washed three times with phosphate buffer pH 7.3 with centrifugation at 3200 rpm. Fluorescent intensity of the labeled nanoparticles redispersed in buffer was measured at 525 nm using 495 nm excitation. The amount of bound FITC-tagged HSA was then calculated (Supporting Information and Figure S4).
Surface Plasmon Resonance (SPR)
SPR was done at 25 °C using phosphate buffer with 0.05% TWEEN-20 (pH 7.3) as flow buffer with the SPR chip attached to an injection valve with a 500 μL injection loop.52 In brief, proteins, (1 mg/mL) were first immobilized on the carboxyl functionalized gold surface using amine coupling chemistry. Carboxyl groups were activated using a 1:2 mixture of freshly prepared 4 mg EDC (3-(N,N-dimethylamino) propyl-N-ethylcarbodiimide) and 11 mg NHSS (N-Hydroxysulfosuccinimide) by flowing for 10 min at 50 μL/min. Then, the proteins in buffer were immobilized at a flow rate of 20 μL/min for 1500 s. Unreacted sites were blocked using 1 M glycine at pH 8.0 buffer.52
AAHSA or AAGOx dispersions in buffer were injected into the SPR via the sample injection loop to monitor binding to surface proteins at a 100 μL/min flow rate, allowing 300 s for association and 300 s for dissociation. Data were initially analyzed by fitting eqs 1 and 2 to estimate the association binding constant ka and dissociation rate constant kd. However, binding of AAs to proteins did not show any dissociation even after 30 min dissociation time, and the data give very poor fits to the model (eqs 1 and 2). The rate in change in signal versus time during association for each experiment was then plotted against [AAHSA], and the apparent binding constant was estimated from the slope (eq 5).
| (2) |
| (3) |
| (4) |
| (5) |
Circular Dichroism (CD)
UV CD spectra were measured for all protein-particles conjugates. Protein solutions were incubated with AAHSA or AAGOx under slow rotation for 2 h and washed twice under same conditions as for adsorption isotherms. After centrifugation, the particles were reconstituted in buffer, and CD was scanned from 190 to 250 at 20 nm/min and an average of 8 spectra were represented after subtracting the buffer signal. Conformations of proteins structure were monitored by observing the negative peak at 210–220 nm and positive peak around 195 nm.53,54
RESULTS
Characterization of SiNP and AA
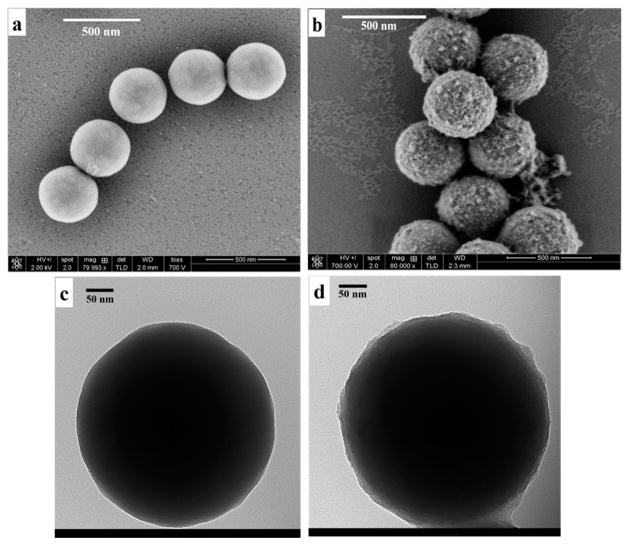
Average diameter of synthesized SiNPs from scanning electron microscopy (SEM) and transmission electron microscopy (TEM) was 390 nm (Figure 1a,c). The average diameter in buffer from DLS (410 nm, Table 1) was slightly larger than from SEM and TEM, which is reasonable since the hydrodynamic diameter is monitored by DLS.55 The zeta-potential for the SiNP was −57.5 ± 4.8 mV (Table 1) at pH 7.3 at a concentration of 3.2 ×10¹¹ SiNP particles/mL.
Figure 1.
Morphology of silica nanoparticles (SiNP) and artificial antibodies of human serum albumin (AAHSA) under microscopy. (a) SEM image shows smooth surface of bare SiNP; (b) SEM image reflects roughness on the surface of synthesized AAHSA; (c) TEM image of bare SiNP; and (d) TEM image of AAHSA.
Table 1.
Zeta-Potentials and Avgerage Hydrodynamic Radii from DLS of Particles in pH 7.3 Buffer
| particle | zeta-potential (mV) | hydrodynamic radius (nm) |
|---|---|---|
| SiNPa | −59.3 (±2) | 205 (±2) |
| SiNP-HSAb | −19.1 (±2) | 245 (±5) |
| SiNP-GOxc | −22.3 (±1.3) | 251 (±3) |
| AAHSAd | −20.4 (±1.4) | 430 (±6) |
| AAGOxe | −21.4 (±2.1) | 421 (±3) |
| AAHSA-HSAf | −17.6 (±3.1) | 490 (±6) |
| AAGOx-GOxg | −18.2 (±2.8) | 454 (±13) |
Silica nanoparticles (SiNPs) of 3.0 mg/mL.
SiNPs (3.0 mg/mL) and human serum albumin (HSA) conjugates.
SiNPs (3.0 mg/mL) and glucose oxidase (GOx) conjugates.
Artificial antibodies of HSA (AAHSA).
Artificial antibodies of GOx (AAGOx).
AAHSA and HSA conjugates in PB.
AAGOx and GOx conjugates.
To synthesize the AA sites on the surface of SiNP, aminopropyltriethoxysilane (APTES) was attached to generate free amines, which were then reacted with glutaraldehyde to form imines with some aldehyde groups remaining free for protein binding. To remove the template protein after copolymerization reaction, 1 M HCl was used to break the possible interactions with protein-amino acid like functional groups from organosilane monomers and then sonication was performed to release from the system. The surfactant triton X-100 helped to control any mechanical damage due to sonication. Different concentrations of the monomers were also incorporated to synthesize the AA; however, the above-mentioned composition of the monomers was significantly better for making the polymerized coat on the surface.
The reaction of APTES with the SiNP surface was confirmed by Raman spectroscopy by observing two strong bands at 1458 and 2936 cm−1 characteristic of C–H bending and stretching of the propyl group (Figure 2).
Figure 2.
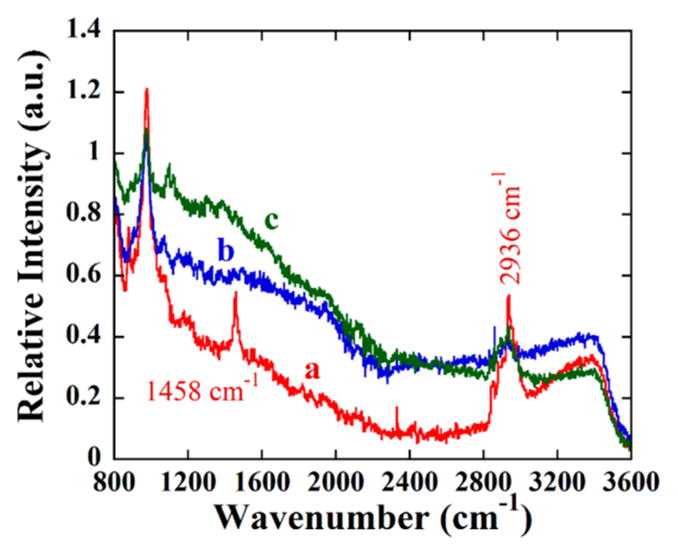
Raman spectra of (a, red) APTES-silica, (b, blue) SiNP, and (c, green) SiNP-imine with two strong bands at 1458 and 2936 cm−1, which are characteristic of C–H vibrations of the propyl group bands.
Template protein was then bound onto the APTES-gluteraldehyde treated AA-SiNPs via imine bonds formed by reaction of amine groups on the protein with free aldehydes of glutaraldehyde. Polymerization to make the binding sites was initiated by adding tetraethylorthosilicate (TEOS) at 10 °C, then after 2 h, benzyltriethoxysilane (BTES), n-propyltriethoxysilane (PTES), hydroxymethyltriethoxysilane (HMTEOS), and aminopropyltriethoxysilane (APTES) were added to react for 48 h. Binding sites were formed by subsequent removal of the template protein by ultrasonication with 1 M HCl and Triton X-100, where the weak imine bonds were broken in acidic contidion.35 The resulting surfaces of SiNP AAs were very rough (Figure 1b,d) compared to the smooth SiNPs (Figure 1a,c) consistent with the additional surface polymerization to make the binding sites.
Hydrodynamic radii (Table 1) showed that radius of the unreacted SiNP was the smallest, and increased by about 40–45 nm when HSA or GOx were adsorbed, reflecting multiple protein attachment to the silica. The radii of the synthesized SiNP-AAs were about 200 nm larger than bare SiNP. When target proteins were adsorbed to the AAs and the particles washed extensively, 60 nm for AAHSA–HSA and 35 nm for AAGOx–GOx increases in radii were found compared to AAHSA and AAGOx, respectively. These increases suggest that multiple protein bind to the SiNP-AAs, also perhaps swelling their outer polymer layers. The zeta potential is about −60 mV for bare SiNP, but decreases to about −20 mV for the AAs and SiNP-AAs with adsorbed proteins (Table 1).
Protein Binding Isotherms
Specificity and selectivity of SiNP-AAs for binding proteins was examined using Bradford total protein assays. HSA, bovine serum albumin (BSA), lysozyme, glucose oxidase (GOx), and hemoglobin (Hb; Table 2) were dissolved in 10 mM phosphate buffer pH 7.3. Then, 500 μL of 3.0 mg/mL artificial antibody dispersion was mixed with 500 μL of protein solution in buffer and kept for 2 h under slow rotation. After centrifugation, protein in the supernatant solution was measured by the Bradford assay to find the amount of proteins remain in the solution by measuring absorbance at 595 nm. Adsorption isotherms (Figure 3) show that template proteins HSA and GOx bind much more strongly to their respective artificial antibodies than other proteins. Data were fit to eq 1 using n as 0.45 for the best fit to obtain KLF, the Langmuir–Freundlich binding constant. Fits were reasonably good and KLF (Figure 3) for AAHSA–HSA was 6.7 × 10⁴, significantly larger than the other protein binding interaction for AAHSA which clearly indicates the selective nature of the artificial antibody (Table 3). KLF for GOx binding to AAGOx also and much larger than those of nontarget proteins (Table 3). Surface density of HSA at the saturation point was 109 μg/m2 for AAHSA while that of GOx on AAGOx was 127 μg/m2 both significantly more than these proteins on bare silica (~30 μg/m2). The AAHSA binding capacity was 5.9 mg HSA/g compared to 1.4 mg/g for poly(aminophenyl)boronic acid surface imprinted silica beads.56
Table 2.
Characteristics of Proteins Used
| protein | MW (kDa) | pI | amino acid residues / | unit cell lengths (nm)
|
||
|---|---|---|---|---|---|---|
| a | b | c | ||||
| human serum albumin58 | 66.5 | 4.7 | 585 | 5.97 | 9.70 | 5.97 |
| bovine serum albumin59 | 66.5 | 5.3 | 583 | 21.78 | 4.50 | 14.31 |
| glucose oxidase60 | 160 | 4.2 | 583 (each subunit) | 6.65 | 6.65 | 21.45 |
| lysozyme61 | 14.3 | 11.4 | 147 | 7.79 | 7.79 | 3.83 |
| hemoglobin62 | 64.5 | 6.8 | 572 | 9.71 | 9.95 | 6.61 |
Figure 3.
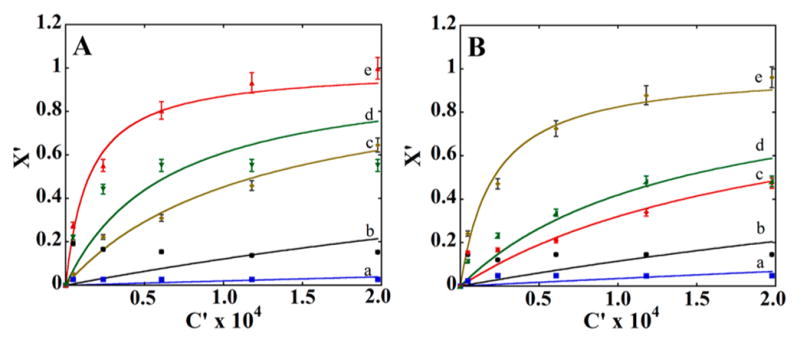
(A) Adsorption isotherms for proteins with AAHSA and AAGOx: Binding to AAHSA of (a) lysozyme, (b) BSA, (c) GOx, (d) hemoglobin, and (e) HSA. (B) Plot showing binding to AAGOx of (a) lysozyme, (b) BSA, (c) HSA, (d) hemoglobin, and (e) GOx.
Table 3.
KLF and ka Values for Artificial Antibody (AA) Protein Interaction
| proteins | KLF for AAHSA (mL/mg)1/n | KLF for AAGOx (mL/mg)1/n | ka for AAHSA (mg/ mL)−1sec−1 | ka for AAGOx (mg/mL)−1sec−1 |
|---|---|---|---|---|
| BSA | 0.14 × 10⁴ | 0.13 × 10⁴ | 0.079 | 0.41 |
| lysozyme | 0.02 × 10⁴ | 0.036 × 10⁴ | 0.019 | 0.25 |
| HSA | 6.7 × 10⁴ | 0.47 × 10⁴ | 1.67 | 0.91 |
| GOx | 0.83 × 10⁴ | 4.7 × 10⁴ | 0.54 | 1.31 |
| hemoglobin | 1.6 × 10⁴ | 0.72 × 10⁴ | 0.91 | 0.89 |
The effects of pH and salts on binding were analyzed by measuring KLF for HSA on AAHSA at pH 6.3, 7.3, and 8.0 and NaCl concentrations of 0, 50, and 200 mM at each pH. At pH 6.3 (KLF, 6.2 × 10⁴) and 8.0 (KLF, 5.8 × 10⁴) with no salt the binding efficiencies decreased compared to pH 7.3 (KLF, 6.7 × 10⁴). Increasing salt concentration decreases the binding efficiencies at these pH-values, e.g. at pH 8.0, KLF at 50 mM NaCl was 5.6 × 10⁴ and KLF at 200 mM NaCl was 5.1 × 10⁴. These changes may result from bound ions disrupting protein-AA binding by shielding electrostatic interactions and changes in pH that alter or decrease the number of hydrogen bonding interactions (Supporting Information, Figure S5, Table S1).
Stability of the AAHSA-HSA bound conjugate was monitored by subsequent washing and measurement of the protein concentration. Details are summarized in the Supporting Information. Approximately 99% of the proteins remained bound with AA even after three washings (details in Supporting Information).
The binding of HSA by AAHSA in 2% calf serum was investigated to mimic a real biological application. Fluorescent-labeled FITC-HSA was used, AAHSA added to the sample which was stirred 3 h, centrifugation, and particles redispersed in buffer (see Experimental Section). Bound HSA was measured by fluorescence. From the results, approximately 90% of HSA at 1–10 μg/mL levels was captured by AAHSA (Table 4). Calf serum contains ~50 mg/mL BSA,57 so 2% calf serum has ~1 mg/mL BSA, 100-fold or more that the amounts of added HSA in this experiment. Thus, these results demonstrate the high selectivity of AAHSA for binding the template protein in a biological sample with high content of multiple proteins.
Table 4.
HSA Binding onto AAHSA in 2% Calf Serums
| amount FITC-HSA added (μ g/mL) | amount FITC-HSA bound (μ g/mL) | % recovery of bound HSA |
|---|---|---|
| 10.0 | 8.9 | 89 |
| 5.0 | 4.6 | 92 |
| 1.0 | 0.9 | 90 |
Surface Plasmon Resonance
Binding of AAHSA to HSA, GOx, BSA, lysozyme, and hemoglobin were monitored by surface plasmon resonance (SPR) on Au SPR chips. Single proteins were attached onto a PEG-self-assembled monolayer on the Au surface at measured surface density 7 × 10⁹ proteins/mm2. Then, dispersions of AAHSA or AAGOx in pH 7.3 buffer were made to flow across the chip. Data in Figures 4 and 5 show rises in the SPR signals due to binding of the AAs to target proteins. After feed solution was changed to buffer, signals became flat suggesting little dissociation even after 30 min. Maximum binding SPR signals for AAHSA and AAGOx were largest for their respective template proteins.
Figure 4.
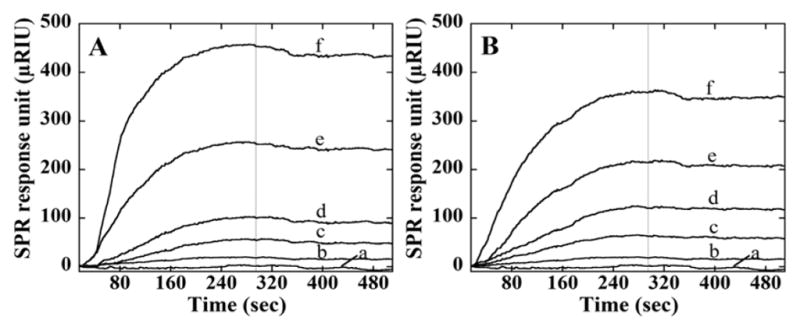
SPR responses at flow 100 μL/min for association (0–300 s) and dissociation (300–600 s) of AAHSA for protein films on an SPR chip. Different concentrations of AAHSA were injected: (a) 0 μg/mL, (b) 0.15 μg/mL, (c) 0.30 μg/mL, (d) 0.60 μg/mL, (e) 1.2 μg/mL, and (f) 1.8 μg/mL), and SPR signals were obtained. Chips were immobilized with (A) HSA and (B) GOx.
Figure 5.
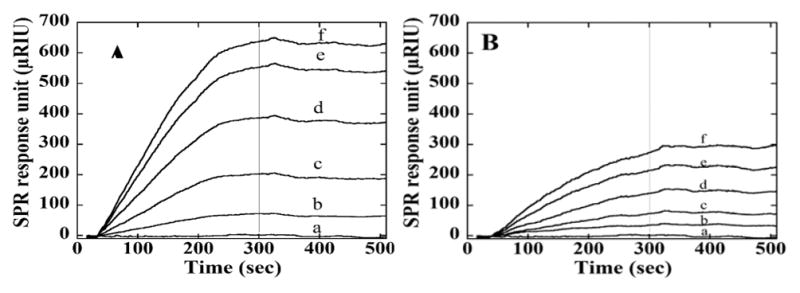
SPR responses at flow rate 100 μL/min for association (0–300 s) and dissociation (300–600 s) of AAGOx. Different concentration of AAGOx were injected: (a) 0 μg/mL, (b) 0.15 μg/mL, (c) 0.30 μg/mL, (d) 0.60 μg/mL, (e) 1.2 μg/mL, and (f) 1.8 μg/ mL. Chips were immobilized with (A) GOx and (B) HSA.
Figures 4 and 5 show SPR responses (R) for protein-AAHSA and protein-AAGOx binding. Nonlinear regression fits to the model in eqs 2 and 3 for the SPR data gave poor fits, most likely due to co-operative surface interactions. Thus, apparent association rate constants (ka, eq 5) were estimated from initial slopes (ΔR/Δt) of plots of ΔR/Δt vs [AAHSA] (Figure 6). SPR responses increased with increasing [AAHSA] (Figure 6) with either HSA or GOx on the SPR chips. The apparent ka was largest at 1.67 (mg/mL)−1 sec−1 for AAHSA-HSA, while AAHSA showed smaller ka values (Table 3). Also, AAGOx–GOx gave the largest ka, with other proteins giving smaller values (Table 3).
Figure 6.
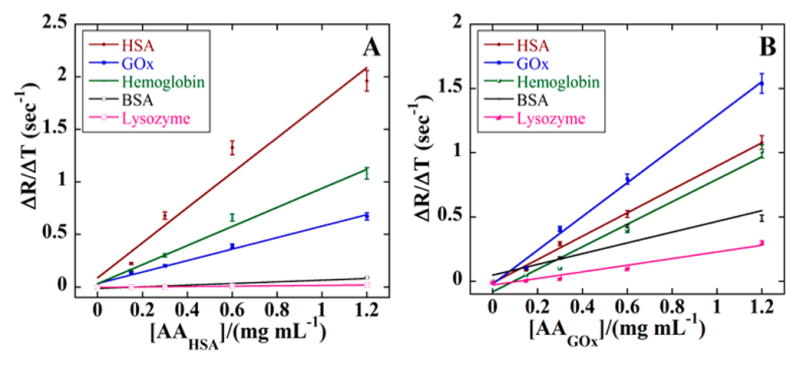
Initial rates of SPR response vs concentrations of AAs. Slopes represent the apparent association rate constant for AAs for (A) HSA and (B) GOx with HSA (red) GOx (blue), bovine serum albumin (black), lysozyme (pink) and hemoglobin (green).
Circular Dichroism
Circular dichroism (CD) spectra for SiNPs and SiNP-AAs with bound proteins revealed secondary structures of the proteins after binding. There is a strong maxima at 193 nm and double minima at 208 and 220 nm in the native HSA and GOx spectra (Figure 7A,B), and similar maximum at 190 nm and minimum at 210 nm for native glucose oxidase (GOx) that reflect predominant α–helical structures of the proteins in solution.53 Comparison of the spectra for bound proteins on AAHSA shows that bound HSA retains its secondary structure, whereas on AAGOx both GOx and HSA retain a major portion of their secondary structures.
Figure 7.
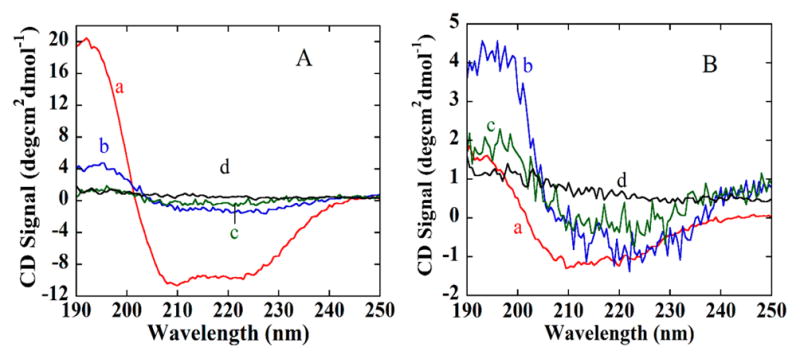
UV-CD spectra for proteins in pH 7.3 buffer. (A, a) HSA in buffer, (b) AAHSA-HSA conjugates, (c) AAHSA-GOx conjugates, and (d) SiNPs-HSA conjugate. (B, a) GOx in solution, (b) AAGOx-HSA conjugates, (c) AAGOx-GOx conjugates, (d) SiNP-GOx conjugates.
DISCUSSION
The above results demonstrate synthesis of highly selective antibody-like binding sites for target proteins on silica nanoparticles by surface molecular imprinting using silane monomers with four different amino-acid-like functional groups to provide binding interactions that mimic those of proteins with antibodies. The monomers provide protonated amine (NH3+), hydroxyl (OH), capable of H-boding, and benzyl (C6H6), and propyl (CH2CH2CH3) groups facilitating and hydrophobic interactions.63 These combined interactions along with size and shape selectivity in target protein binding provided much better selectively, binding strength, and binding rates for targets compared nontemplate proteins (Figures 3 and 6, Table 3). Also, ratios of these four monomers in the synthesis were optimized relative to ratios of amino acids like lysine, tyrosine, aromatic amino acids and more hydrophobic amino acids that are predominant responsible for antigen–antibody interaction.64
The AA-silica nanoparticles have very rough surfaces (Figure 1) and diameters of the SiNPs increased significantly (Table 1) after the imprinting process. The hydrodynamic radius for AAHSA was 430 nm which is larger than bare SiNP due to the imprinted polymerization, and may also reflect some swelling of the polymer layer in the aqueous buffer. The increase in radii after protein binding is consistent with the presence of proteins on the AAs surface, and may also be influenced by additional swelling after the hydrated protein is bound. Clearly, the situation is complex, and cannot be viewed simply as a globular protein binding to the outside of a spherical nanoparticle. However, the 30 nm increase in radius for AAGOx is roughly consistent with what we would expect for binding of GOx (max. dimension 21 nm, Table 2) within the polymer layer along with any water that hydrates it, and a possible swelling of the polymer layer to accommodate the binding. For HSA (max. dimension 10 nm, Table 2), the 60 nm increase in radius upon binding to AAHSA seems more complex, and may involve a network of binding sites in the polymer layer that is formally equivalent to multilayer protein binding and attendant swelling. Assuming that all the binding sites interact equally with the target protein, this situation provides more binding sites per nanoparticle and the chance for greater efficiency of binding at low protein concentrations.
After protein removal, sites with complementary shape, size, and functional groups are created, presumably featuring different arrangements and orientations of the monomer side chains. Most of the hydrophobic monomers interact with the proteins and there is only a small possibility for these to be present on the surface exposed to water.65 The small standard deviations of the radii in DLS (Table 1, Figure S6) argue against aggregation, so that multiple binding sites and swelling seem the most reasonable explanation for changes in the polymer film thickness.
Similar values for zeta-potential for bare SiNP and AA particles with bound proteins are consistent with lowering of the negative charge on the SiNP surface by both polymerization and protein binding (Table 1). At pH 7.3, HSA (pI 4.7) and GOx (pI 4.2) are negatively charged. Less negative and similar zeta potentials compared to silica were found for all particles binding these proteins (−20 ± 2). This is consistent with earlier work that reported that zeta potentials of silica, alumina, and titania colloids are controlled by the charge and zeta potential of protein adsorbed to their surfaces.66
Raman spectroscopy confirmed the covalent binding of APTES to SiNP in the initial stage of binding site construction. In APTES-SiNP, the NH2 peaks (for out of plane bending at 895 cm−1 and rocking/twisting or bending at ~1100 cm−1)67 overlap with Si–O peaks in the same region. However, new bands for APTES-SiNPs at 1458 and 2936 cm−1 can be assigned to C–H bending (1458 cm−1) and C–H stretching (2936 cm−1)68 from multiple C–H bonds in APTES (Figure 2). After addition of the glutaraldehyde the C=O bond involved in hydrogen bonding and CH bending of the aldehyde group interact with the other vibrations and might appear in a wide spectral range around 1430–1200 cm−1.69
The AAs bind target proteins at high loading and efficiency after protein removal (Table 3, Figure 3). This also shows that target proteins have been efficiently removed by sonication in the detergent–acid medium. Different models have been used to evaluate binding equilibrium. In this case, the molecularly imprinted particle system is heterogeneous and probably three-dimensional, and thus the Langmuir–Freundlich model was employed for the best results.70 The apparent Langmuir–Freundlich binding constant (KLF) for HSA onto the AAHSA was 6.7 × 10⁴ ((mL/mg)1/n), 4–300 times larger compared to other nontemplate proteins. KLF for GOx binding to AAGOx was 4.7 × 10⁴ ((mL/mg)1/n), 6.5–130 fold larger than those of nontarget proteins (Table 3). These results are consistent with very selective binding of the target proteins to cognate AAs.
Binding selectivity is also influenced by protein size. From Table 2, the dimensions of HSA (5.97 × 9.70 × 5.97 nm) are comparable with Hb (9.71 × 9.95 × 6.61 nm) and GOx (6.65 × 6.65 × 21.45 nm). As a result, the AAHSA also bound with these two proteins, but much less strongly than HSA, whereas AAHSA bound very poorly to the much larger protein BSA (21.78 × 4.50 × 14.31 nm) and to the smaller protein lysozyme (7.79 × 7.79 × 3.83 nm). Similar results were found for binding to AAGOx. Results are consistent with selective binding based on both specific polymer–proteins interactions and the size and shape of the binding site. In addition, the UV-CD spectra for AA-protein conjugates suggests that conformations of bound target proteins are retained after binding with AAs (Figure 7). This feature is in common with true antibodies and their cognate binding partners.15,16
Surface plasmon resonance (SPR) indicated very strong binding of AAHSA to HSA attached to the SPR chip, with very little dissociation of AAHSA from the protein-decorated surface. Thus, only association rate constants (ka) could be determined from SPR. The ka-value was 1.67 (mg/mL)−1 sec−1 for AAHSA on HSA, which was 2 to 85-fold larger compared to nontemplate proteins. For AAGOx, ka was 1.31 (mg/mL)−1 sec−1, which was 1.4–5 fold larger that for the other proteins. The lack of dissociation is due to cooperative binding with multiple binding sites on SiNP-AAs to proteins on the Au SPR surface, as also observed for multiple-antibody magnetic beads onto surface proteins.52 This consequence of co-operative binding of the AAs to surface proteins occurs for AAs bound to either GOx or HSA, regardless of the target template of the AA. The association responses were larger for all AA concentrations for the target protein surfaces compared to nontarget proteins (Figures 4 and 5), again suggesting stronger affinity toward the target proteins. This is consistent with the KLF values that were always much larger for the target proteins compared to other proteins. Selectivity of the AA for HSA was slightly better than for GOx. While BSA and HSA have similar amino acid compositions, dimensions of HSA (6 × 9.7 × 6 nm) are smaller than for BSA (21.8 × 4.5 × 14.3 nm; Table 2). Another issue is the absence of sugar binding moieties in the AA binding sites because GOx has glucose-like groups on its surface but HSA does not. These results underline the importance of cooperative molecular group interactions and size that influence binding to the AAs.
Calf serum diluted to 2% contains hundreds of proteins including BSA at 1 mg/mL57 so recovery of 90% of HSA in this medium (Table 4) confirms strong selective binding of the synthetic artificial antibody toward template protein in a protein laden-medium. This result also is proof-of-concept for possible biological applications such as separation and bioanalysis.
CONCLUSIONS
Results above demonstrate the synthesis of prototype antibody-like binding sites on nanoparticles for two proteins with very promising specificity and selectivity. The use of mixtures of silane monomers with amino-acid-like side chains for surface imprinting provided excellent affinity and selectivity toward the template proteins, and a 4-fold larger binding capacity compared to an earlier single polymer imprinted silica.56 Apparent binding constants (KLF) of HSA and GOx bound to their respective AAs were 4–300 fold larger compared to a series of nontemplate proteins. Excellent recovery of HSA was found using AAHSA in protein-rich calf serum. If improvements in affinity and selectivity can be realized for a broad range of proteins, this approach may offer a general route to artificial antibody nanoparticles that could replace natural antibodies for some applications.
Supplementary Material
Acknowledgments
The authors thank the Green Emulsions, Micelles, and Surfactants Center (GEMS) at University of Connecticut and grants EB016707 and EB014586 from the National Institute of Biomedical Imaging and Bioengineering (NIBIB), U.S. National Institutes of Health, for financial support of this work. We thank Amit Joshi and Dr. Chandra Dixit (University of Connecticut) for valuable suggestions on surface plasmon resonance experiments. We also thank Dr. C. V. Kumar for use of circular dichroism, SPR, fluorescence and zeta-potential instruments.
Footnotes
Notes
The authors declare no competing financial interest.
The Supporting Information is available free of charge on the ACS Publications website at DOI: 10.1021/acsami.5b11650.
Additional experimental details referring to synthesis, binding, particle size distributions, protein removal, applications and stability. Six additional figures and one table are included. (PDF)
References
- 1.Yin D, Ulbricht M. Protein-selective Adsorbers by Molecular Imprinting via a Novel Two-step Surface Grafting Method. J Mater Chem B. 2013;1:3209–3219. doi: 10.1039/c3tb20333f. [DOI] [PubMed] [Google Scholar]
- 2.Takeuchi T, Mori T, Kuwahara A, Ohta T, Oshita A, Sunayama H, Kitayama Y, Ooya T. Conjugated-Protein Mimics with Molecularly Imprinted Reconstructible and Transformable Regions that are Assembled Using Space-Filling Prosthetic Groups. Angew Chem. 2014;126:12979–12984. doi: 10.1002/anie.201406852. [DOI] [PubMed] [Google Scholar]
- 3.Vashist A, Vashist A, Gupta YK, Ahmad S. Recent Advances in Hydrogel Based Drug Delivery Systems for the Human Body. J Mater Chem B. 2014;2:147–166. doi: 10.1039/c3tb21016b. [DOI] [PubMed] [Google Scholar]
- 4.Lipman NS, Jackson LR, Trudel LJ, Weis-Garcia F. Monoclonal versus Polyclonal Antibodies: Distinguishing Characteristics, Applications, and Information Resources. ILAR J. 2005;46:258–268. doi: 10.1093/ilar.46.3.258. [DOI] [PubMed] [Google Scholar]
- 5.Adams GP, Weiner LM. Monoclonal Antibody Therapy of Cancer. Nat Biotechnol. 2005;23:1147–1157. doi: 10.1038/nbt1137. [DOI] [PubMed] [Google Scholar]
- 6.Payne WJ, Marshall DL, Shockley RK, Martin WJ. Clinical Laboratory Applications of Monoclonal Antibodies. Clin Microbiol Rev. 1988;1:313–329. doi: 10.1128/cmr.1.3.313. [DOI] [PMC free article] [PubMed] [Google Scholar]
- 7.Chiarella P, Fazio VM. Mouse Monoclonal Antibodies in Biological Research: Strategies for High-throughput Production. Biotechnol Lett. 2008;30:1303–1310. doi: 10.1007/s10529-008-9706-5. [DOI] [PubMed] [Google Scholar]
- 8.Flanagan JJ, Arjomandi A, Delanoy ML, Du Paty E, Galea P, Laune D, Rieunier F, Walker RP, Binder SR. Development of Monoclonal Antibodies to Pre-haptoglobin 2 and Their Use in an Enzyme-linked Immunosorbent Assay (ELISA) J Immunol Methods. 2014;406:34–42. doi: 10.1016/j.jim.2014.02.009. [DOI] [PubMed] [Google Scholar]
- 9.Zhang S, Garcia-D’Angeli A, Brennan JP, Huo Q. Predicting Detection Limits of Enzyme-linked Immunosorbent Assay (ELISA) and Bioanalytical Techniques in General. Analyst. 2014;139:439–445. doi: 10.1039/c3an01835k. [DOI] [PubMed] [Google Scholar]
- 10.Engvall E, Perlmann P. Enzyme-linked Immunosorbent Assay (ELISA) Quantitative Assay of Immunoglobulin G. Immunochemistry. 1971;8:871–874. doi: 10.1016/0019-2791(71)90454-x. [DOI] [PubMed] [Google Scholar]
- 11.Bolton AE, Hunter WM. The Labelling of Proteins to High Specific Radioactivities by Conjugation to a 125 I-containing Acylating Agent. Application to the Radioimmunoassay. Biochem J. 1973;133:529–538. doi: 10.1042/bj1330529. [DOI] [PMC free article] [PubMed] [Google Scholar]
- 12.Grange RD, Thompson JP, Lambert DG. Radioimmunoassay, Enzyme and Non-Enzyme-based Immunoassays. Br J Anaesth. 2014;112:213–216. doi: 10.1093/bja/aet293. [DOI] [PubMed] [Google Scholar]
- 13.Algenäs C, Agaton C, Fagerberg L, Asplund A, Björling L, Björling E, Kampf C, Lundberg E, Nilsson P, Persson A, Wester K, Pontén F, Wernérus H, Uhlén M, Ottosson TJ, Hober S. Antibody Performance in Western Blot Applications is Context-dependent. Biotechnol J. 2014;9:435–445. doi: 10.1002/biot.201300341. [DOI] [PubMed] [Google Scholar]
- 14.Lu H, Wang X, Urvalek AM, Li T, Xie H, Yu L, Zhao J. Transformation of Human Ovarian Surface Epithelial Cells by Krüppel-like Factor 8. Oncogene. 2014;33:10–18. doi: 10.1038/onc.2012.545. [DOI] [PMC free article] [PubMed] [Google Scholar]
- 15.Scott AM, Allison JP, Wolchok JD. Monoclonal Antibodies in Cancer Therapy. Cancer Immun. 2012;12:14–21. [PMC free article] [PubMed] [Google Scholar]
- 16.Scott AM, Wolchok JD, Old LJ. Antibody Therapy of Cancer. Nat Rev Cancer. 2012;12:278–287. doi: 10.1038/nrc3236. [DOI] [PubMed] [Google Scholar]
- 17.Ries CH, Cannarile MA, Hoves S, Benz J, Wartha K, Runza V, Rey-Giraud F, Pradel LP, Feuerhake F, Klaman I, Jones T, Jucknischke U, Scheiblich S, Kaluza K, Gorr IH, Walz A, Abiraj K, Cassier PA, Sica A, Gomez-Roca C, de Visser KE, Italiano A, Le Tourneau C, Delord JP, Levitsky H, Blay JY, Rüttinger D. Targeting Tumor-associated Macrophages with Anti-CSF-1R Antibody Reveals a Strategy for Cancer Therapy. Cancer Cell. 2014;25:846–859. doi: 10.1016/j.ccr.2014.05.016. [DOI] [PubMed] [Google Scholar]
- 18.Sharma P, Allison JP. The Future of Immune Checkpoint Therapy. Science. 2015;348:56–61. doi: 10.1126/science.aaa8172. [DOI] [PubMed] [Google Scholar]
- 19.Sardesai NP, Kadimisetty K, Faria R, Rusling JF. A Microfluidic Electrochemiluminescent Device for Detecting Cancer Biomarker Proteins. Anal Bioanal Chem. 2013;405:3831–3838. doi: 10.1007/s00216-012-6656-5. [DOI] [PMC free article] [PubMed] [Google Scholar]
- 20.Malhotra R, Chikkaveeraiah BV, Munge BS, Cheong SC, Zain RB, Abraham MT, Dey DK, Gutkind JS, Rusling JF, Patel V. Ultrasensitive Detection of Cancer Biomarkers in the Clinic by Use of a Nanostructured Microfluidic Array. Anal Chem. 2012;84:6249–6255. doi: 10.1021/ac301392g. [DOI] [PMC free article] [PubMed] [Google Scholar]
- 21.Rusling JF, Bishop GW, Doan N, Papadimitrakopoulos F. Nanomaterials and Biomaterials in Electrochemical Arrays for Protein Detection. J Mater Chem B. 2014;2:12–30. doi: 10.1039/C3TB21323D. [DOI] [PMC free article] [PubMed] [Google Scholar]
- 22.Wang Y, Kececi K, Mirkin MV, Mani V, Sardesai N, Rusling JF. Resistive-pulse Measurements with Nanopipettes: Detection of Au Nanoparticles and Nanoparticle-bound Anti-peanut IgY. Chem Sci. 2013;4:655–663. doi: 10.1039/C2SC21502K. [DOI] [PMC free article] [PubMed] [Google Scholar]
- 23.Dixit CK, Kadimisetty K, Otieno BA, Tang C, Malla S, Krause CE, Rusling JF. Electrochemistry-based Approaches to Low Cost, High Sensitivity, Automated, Multiplexed Protein Immunoassays for Cancer Diagnostics. Analyst. 2016 doi: 10.1039/C5AN01829C. Advance Article. [DOI] [PMC free article] [PubMed] [Google Scholar]
- 24.Zhang Z, Guan Y, Li M, Zhao M, Ren J, Qu X. Highly Stable and Reusable Imprinted Artificial Antibody Used for in situ Detection and Disinfection of Pathogens. Chem Sci. 2015;6:2822–2826. doi: 10.1039/c5sc00489f. [DOI] [PMC free article] [PubMed] [Google Scholar]
- 25.Birch JR, Racher AJ. Antibody Production. Adv Drug Delivery Rev. 2006;58:671–685. doi: 10.1016/j.addr.2005.12.006. [DOI] [PubMed] [Google Scholar]
- 26.Albert B, Lewis J, Raff M, Roberts K, Walter P. Mol Biol Cell. 4. Garland Science; New York: 2002. [Google Scholar]
- 27.Daniell H, Streatfield SJ, Wycoff K. Medical Molecular Farming: Production of Antibodies, Biopharmaceuticals and Edible Vaccines in Plants. Trends Plant Sci. 2001;6:219–226. doi: 10.1016/S1360-1385(01)01922-7. [DOI] [PMC free article] [PubMed] [Google Scholar]
- 28.Li J, Zhang L, Wei G, Zhang Y, Zeng Y. Highly Sensitive and Doubly Orientated Selective Molecularly Imprinted Electrochemical Sensor for Cu 2+ Biosens Bioelectron. 2015;69:316–320. doi: 10.1016/j.bios.2015.03.010. [DOI] [PubMed] [Google Scholar]
- 29.Lee WC, Cheng CH, Pan HH, Chung TH, Hwang CC. Chromatographic Characterization of Molecularly Imprinted Polymers. Anal Bioanal Chem. 2008;390:1101–1109. doi: 10.1007/s00216-007-1765-2. [DOI] [PubMed] [Google Scholar]
- 30.Wulff G. Fourty Years of Molecular Imprinting in Synthetic Polymers: Origin, Features and Perspectives. Microchim Acta. 2013;180:1359–1370. [Google Scholar]
- 31.Jia X, Xu M, Wang Y, Ran D, Yang S, Zhang M. Polydopamine-based Molecular Imprinting on Silica-modified Magnetic Nanoparticles for Recognition and Separation of Bovine Hemoglobin. Analyst. 2013;138:651–658. doi: 10.1039/c2an36313e. [DOI] [PubMed] [Google Scholar]
- 32.Zayats M, Kanwar M, Ostermeier M, Searson PC. Molecular Imprinting of Maltose Binding Protein: Tuning Protein Recognition at the Molecular Level. Macromolecules. 2011;44:3966–3972. [Google Scholar]
- 33.Verheyen E, Schillemans JP, van Wijk M, Demeniex M, Hennink WE, van Nostrum CF. Challenges for the Effective Molecular Imprinting of Proteins. Biomaterials. 2011;32:3008–3020. doi: 10.1016/j.biomaterials.2011.01.007. [DOI] [PubMed] [Google Scholar]
- 34.Tian L, Liu KK, Morrissey JJ, Gandra N, Kharasch ED, Singamaneni S. Gold Nanocages with Built-in Artificial Antibodies for Label-free Plasmonic Biosensing. J Mater Chem B. 2014;2:167–170. doi: 10.1039/c3tb21551b. [DOI] [PubMed] [Google Scholar]
- 35.Shiomi T, Matsui M, Mizukami F, Sakaguchi K. A Method for the Molecular Imprinting of Hemoglobin on Silica Surfaces Using Silanes. Biomaterials. 2005;26:5564–5571. doi: 10.1016/j.biomaterials.2005.02.007. [DOI] [PubMed] [Google Scholar]
- 36.Hansen DE. Recent Developments in the Molecular Imprinting of Proteins. Biomaterials. 2007;28:4178–4191. doi: 10.1016/j.biomaterials.2007.06.017. [DOI] [PubMed] [Google Scholar]
- 37.Gao R, Mu X, Hao Y, Zhang L, Zhang J, Tang Y. Combination of Surface Imprinting and Immobilized Template Techniques for Preparation of Core–shell Molecularly Imprinted Polymers Based on Directly Amino-modified Fe3O4 Nanoparticles for Specific Recognition of Bovine Hemoglobin. J Mater Chem B. 2014;2:1733–1741. doi: 10.1039/c3tb21684e. [DOI] [PubMed] [Google Scholar]
- 38.Kan X, Zhao Q, Shao D, Geng Z, Wang Z, Zhu JJ. Preparation and Recognition Properties of Bovine Hemoglobin Magnetic Molecularly Imprinted Polymers. J Phys Chem B. 2010;114:3999–4004. doi: 10.1021/jp910060c. [DOI] [PubMed] [Google Scholar]
- 39.Li F, Li J, Zhang SS. Molecularly Imprinted Polymer Grafted on Polysaccharide Microsphere Surface by the Sol–gel Process for Protein recognition. Talanta. 2008;74:1247–1255. doi: 10.1016/j.talanta.2007.08.032. [DOI] [PubMed] [Google Scholar]
- 40.Pradhan S, Boopathi M, Kumar O, Baghel A, Pandey P, Mahato TH, Singh B, Vijayaraghavan R. Molecularly Imprinted Nanopatterns for the Recognition of Biological Warfare Agent Ricin. Biosens Bioelectron. 2009;25:592–598. doi: 10.1016/j.bios.2009.03.041. [DOI] [PubMed] [Google Scholar]
- 41.Yang Y, He X, Wang Y, Li W, Zhang Y. Epitope Imprinted Polymer Coating CdTe Quantum Dots for Specific Recognition and Direct Fluorescent Quantification of the Target Protein Bovine Serum Albumin. Biosens Bioelectron. 2014;54:266–272. doi: 10.1016/j.bios.2013.11.004. [DOI] [PubMed] [Google Scholar]
- 42.Yao W, Ning B, Zhou H, Fang Y, Gao Z. Recognition of Staphylococcus Enterotoxin via Molecularly Imprinted Beads. J Sep Sci. 2008;31:413–418. doi: 10.1002/jssc.200700429. [DOI] [PubMed] [Google Scholar]
- 43.Zhang Z, Long Y, Nie L, Yao S. Molecularly Imprinted Thin Film Self-assembled on Piezoelectric Quartz Crystal Surface by the Sol–gel Process for Protein Recognition. Biosens Bioelectron. 2006;21:1244–1251. doi: 10.1016/j.bios.2005.05.009. [DOI] [PubMed] [Google Scholar]
- 44.Abbas A, Tian L, Morrissey JJ, Kharasch ED, Singamaneni S. Hot Spot-Localized Artificial Antibodies for Label-Free Plasmonic Biosensing. Adv Funct Mater. 2013;23:1789–1797. doi: 10.1002/adfm.201202370. [DOI] [PMC free article] [PubMed] [Google Scholar]
- 45.Cumbo A, Lorber B, Corvini PFX, Meier W, Shahgaldian P. A Synthetic Nanomaterial for Virus Recognition Produced by Surface Imprinting. Nat Commun. 2013;4:1503. doi: 10.1038/ncomms2529. [DOI] [PubMed] [Google Scholar]
- 46.Stöber W, Fink A, Bohn EJ. Controlled Growth of Monodisperse Silica Spheres in the Micron Size Range. J Colloid Interface Sci. 1968;26:62–69. [Google Scholar]
- 47.Venton DL, Gudipati E. Influence of Protein on Polysiloxane Polymer Formation–Evidence for Induction of Complementary Protein-polymer Interactions. Biochim Biophys Acta, Protein Struct Mol Enzymol. 1995;1250:126–136. doi: 10.1016/0167-4838(95)00080-e. [DOI] [PubMed] [Google Scholar]
- 48.Bradford MM. A Rapid and Sensitive Method for the Quantitation of Microgram Quantities of Protein Utilizing the Principle of Protein-dye Binding. Anal Biochem. 1976;72:248–254. doi: 10.1006/abio.1976.9999. [DOI] [PubMed] [Google Scholar]
- 49.Duff DG, Ross SMC, Vaughan DH. Adsorption form Solution: An Experiment to Illustrate the Langmuir Isotherm. J Chem Educ. 1988;65:815–816. [Google Scholar]
- 50.Yoon JY, Kim JH, Kim WS. The Relationship of Interaction Forces in the Protein Adsorption onto Polymeric Microspheres. Colloids Surf, A. 1999;153:413–419. [Google Scholar]
- 51.Yoon JY, Park HM, Kim JH, Kim WS. Adsorption of BSA on Highly Carboxylated Microspheres—Quantitative Effects of Surface Functional Groups and Interaction Forces. J Colloid Interface Sci. 1996;177:613–620. [Google Scholar]
- 52.Mani V, Wasalathanthri DP, Joshi AA, Kumar CV, Rusling JF. Highly Efficient Binding of Paramagnetic Beads Bioconjugated with 100000 or more Antibodies to Protein-coated Surfaces. Anal Chem. 2012;84:10485–10491. doi: 10.1021/ac3028257. [DOI] [PMC free article] [PubMed] [Google Scholar]
- 53.Greenfield NJ. Using Circular Dichroism Spectra to Estimate Protein Secondary Structure. Nat Protoc. 2007;1:2876–2890. doi: 10.1038/nprot.2006.202. [DOI] [PMC free article] [PubMed] [Google Scholar]
- 54.Thilakarathne V, Briand VA, Zhou Y, Kasi RM, Kumar CV. Protein Polymer Conjugates: Improving the Stability of Hemoglobin with Poly(Acrylic Acid) Langmuir. 2011;27:7663–7671. doi: 10.1021/la2015034. [DOI] [PubMed] [Google Scholar]
- 55.Cai H, Wang Y, Yu Y, Mirkin MV, Bhakta S, Bishop GW, Joshi AA, Rusling JF. Resistive-Pulse Measurements with Nanopipettes: Detection of Vascular Endothelial Growth Factor C (VEGF-C) Using Antibody-Decorated Nanoparticles. Anal Chem. 2015;87:6403–6410. doi: 10.1021/acs.analchem.5b01468. [DOI] [PMC free article] [PubMed] [Google Scholar]
- 56.Bonini F, Piletsky S, Turner APF, Speghini A, Bossi A. Surface imprinted beads for the recognition of human serum albumin. Biosens Bioelectron. 2007;22:2322–2328. doi: 10.1016/j.bios.2006.12.034. [DOI] [PubMed] [Google Scholar]
- 57.Francis GL. Albumin and Mammalian Cell Culture: Implications for Biotechnology Applications. Cytotechnology. 2010;62:1–16. doi: 10.1007/s10616-010-9263-3. [DOI] [PMC free article] [PubMed] [Google Scholar]
- 58.Sugio S, Kashima A, Mochizuki S, Noda M, Kobayashi K. Crystal Structure of Human Serum Albumin at 2.5 Å Resolution. Protein Eng, Des Sel. 1999;12:439–446. doi: 10.1093/protein/12.6.439. [DOI] [PubMed] [Google Scholar]
- 59.Bujacz A. Structures of Bovine, Equine and Leporine Serum Albumin. Acta Crystallogr, Sect D: Biol Crystallogr. 2012;68:1278–1289. doi: 10.1107/S0907444912027047. [DOI] [PubMed] [Google Scholar]
- 60.Hecht J, Kalisz HM, Hendle J, Schmid RD, Schomburg D. Crystal Structure of Glucose Oxidase from Aspergillus Niger Refined at 2·3 Å Resolution. J Mol Biol. 1993;229:153–172. doi: 10.1006/jmbi.1993.1015. [DOI] [PubMed] [Google Scholar]
- 61.Coquelle N, Brewster AS, Kapp U, Shilova A, Weinhausen B, Burghammer M, Colletier JP. Raster-scanning Serial Protein Crystallography Using Micro- and Nano-focused Synchrotron Beams. Acta Crystallogr, Sect D: Biol Crystallogr. 2015;71:1184–1196. doi: 10.1107/S1399004715004514. [DOI] [PMC free article] [PubMed] [Google Scholar]
- 62.Paoli M, Liddington R, Tame J, Wilkinson A, Dodson G. Crystal Structure of T State Haemoglobin with Oxygen Bound at All Four Haems. J Mol Biol. 1996;256:775–792. doi: 10.1006/jmbi.1996.0124. [DOI] [PubMed] [Google Scholar]
- 63.Chen L, Xu S, Li J. Recent Advances in Molecular Imprinting Technology: Current Status, Challenges and Highlighted Applications. Chem Soc Rev. 2011;40:2922–2942. doi: 10.1039/c0cs00084a. [DOI] [PubMed] [Google Scholar]
- 64.Ramaraj T, Angel T, Dratz EA, Jesaitis AJ, Mumey B. Antigen–antibody Interface Properties: Composition, Residue Interactions, and Features of 53 Non-redundant Structures. Biochim Biophys Acta, Proteins Proteomics. 2012;1824:520–532. doi: 10.1016/j.bbapap.2011.12.007. [DOI] [PMC free article] [PubMed] [Google Scholar]
- 65.Gao R, Kong X, Wang X, He X, Chen L, Zhang Y. Preparation and Characterization of Uniformly Sized Molecularly Imprinted Polymers Functionalized with Core–shell Magnetic Nanoparticles for the Recognition and Enrichment of Protein. J Mater Chem. 2011;21:17863–17871. [Google Scholar]
- 66.Rezwan K, Studart AR, Voros J, Gauckler LJ. Change of Zeta Potential of Biocompatible Colloidal Oxide Particles upon Adsorption of Bovine Serum Albumin and Lysozyme. J Phys Chem B. 2005;109:14469–14474. doi: 10.1021/jp050528w. [DOI] [PubMed] [Google Scholar]
- 67.Stewart JE. Vibrational Spectra of Primary and Secondary Aliphatic Amines. J Chem Phys. 1959;30:1259–1265. [Google Scholar]
- 68.De Gelder J, De Gussem K, Vandenabeele P, Moens L. Reference Database of Raman Spectra of Biological Molecules. J Raman Spectrosc. 2007;38:1133–1147. [Google Scholar]
- 69.Jastrzebska M, Wrzalik R, Kocot A, Zalewska-Rejdak J, Cwalina B. Raman Spectroscopic Study of Glutaraldehyde-stabilized Collagen and Pericardium Tissue. J Biomater Sci, Polym Ed. 2003;14:185–197. doi: 10.1163/156856203321142605. [DOI] [PubMed] [Google Scholar]
- 70.Umpleby RJ, Baxter SC, Chen Y, Shah RN, Shimizu KD. Characterization of Molecularly Imprinted Polymers with the Langmuir-Freundlich Isotherm. Anal Chem. 2001;73:4584–4591. doi: 10.1021/ac0105686. [DOI] [PubMed] [Google Scholar]
Associated Data
This section collects any data citations, data availability statements, or supplementary materials included in this article.


