Abstract
Purpose
We assessed the effects of anti-angiogenic therapy (AAT) on radiation therapy (RT), evaluating the tumor growth and perfusion patterns on dynamic contrast enhanced MR (DCE-MR) images.
Methods
Thirteen nude mice with heterotopic xenograft cancer of human lung cancer cell line were used. To observe the interval change of the tumor size and demonstrate the time-signal intensity enhancement curve of the tumor, the mice were subdivided into four groups: control (n = 2), AAT (n = 2), RT (n = 5), and combined therapy (AART, n = 4). DCE-MR images were taken four weeks after treatment. Perfusion parameters were obtained based on the Brix model. To compare the interval size changes in the RT group with those in the AART group, repeated measures ANOVA was used. Perfusion parameters in both the RT and AART groups were compared using a Mann-Whitney U test.
Results
Tumor growth was more suppressed in AART group than in the other groups. Control group showed the rapid wash-in and wash-out pattern on DCE-MR images. In contrast to RT group with delayed and prolonged enhancement, both AAT and AART groups showed the rapid wash-in and plateau pattern. The signal intensity in the plateau/time to peak enhancement (P<0.016) and the maximum enhancement ratio (P<0.016) of AART group were higher than those of RT group.
Conclusions
AART showed synergistic effects in anticancer treatment. The pattern of the time-intensity curve on the DCE-MR images in each group implies that AAT might help maintain the perfusion in the cancer of AART group.
Introduction
The main goal of radiation therapy (RT) is local cancer control for a better outcome. To improve the cure rates or reduce side effects, the combination treatment of RT and pharmaceutical agents such as anti-angiogenic (AA) agents or anti-vascular drugs is being used and clinically investigated [1, 2]. However, the mechanism of the enhanced effect of the combination therapy of RT and drugs such as AA agents is still unclear.
AA agents can induce primary tumor shrinkage by pruning the formation of immature tumor vessels. Because RT can cause cell injury by inducing oxygen-free radicals in tumor cells, oxygen is essential for achieving the anti-cancer effect of RT. However, RT can induce extensive necrosis especially in the central portion of a tumor. Necrosis with decreased blood supply causes a hypoxic condition of the tumor and eventually decreases the tumoricidal effect of RT by reducing the oxygen-free radicals [3–6].
The hypothesis that AA therapy (AAT) may help normalize the vascular structures of a tumor and promote improved blood perfusion was recently suggested [7]. The hypoxic area in the tumor may eventually decrease, and the effect of RT could be optimized. The perfusion changes can be demonstrated on dynamic contrast enhanced-magnetic resonance (DCE-MR) images by obtaining the time-signal intensity curves and analyzing the perfusion parameters [1, 8, 9]. For example, high values of the peak enhancement and the time to peak enhancement (TTP) of a tumor have been shown after RT, compared to those of non-irradiated tumors [10]. This finding suggests that the prolonged enhancement and delayed wash-out pattern of the contrast materials were due to the increased extracellular extravascular space, i.e., the necrotic component, and the decreased vascular permeability of the irradiated tumor [10].
In this study, we demonstrated and evaluated the tumor growth and perfusion changes induced by RT and the combination therapy of RT and an AA agent in a murine cancer model. With DCE-MR imaging, we might help to draw insights into the synergistic effect of the combination therapy of AAT and RT.
Methods
The Institutional Animal Care and Use Committee in Asan Medical Center approved this study, and all the experiments were performed in accordance with the committee guidelines. Animal care and treatment were guided according to the 8th edition of the Guide for the Care and Use of Laboratory Animals.
Animal and experimental protocol
Thirteen nude mice were implanted with A549 heterotopic xenograft cancer cells from the human lung cancer cell line (CCL-185TM; American Type of Culture Collection, Manassas, VA, USA), which was cultivated in Dulbecco’s modified Eagle’s Medium (DMEM, GIBCO, Carlsbad, CA, USA) mixed with 10% heat-inactivated FBS and 1% streptomycin-neomycin (GIBCO) at 37°C in a humidified CO2 environment. With the harvested amount of 3 x 10⁶ cancer cells, a total volume of 50 μL of Hank’s Balanced Salt Solution (HBSS; GIBCO) was implanted in the left thigh muscles of the seven-week-old male BALB/c nude mice (OrientBio, Sungnam, Korea).
Each mouse was randomly assigned to one of the following four groups: (1) the control group (n = 2); (2) AAT group (n = 2); (3) RT group (n = 5); and (4) the combination therapy (AART) group (n = 4). The second-generation multi-targeted receptor tyrosine kinase inhibitor, SU11248 (sunitinib malate, Pfizer Inc., New York, NY, USA), inhibits cellular signaling by targeting the receptors of the platelet-derived growth factor (PDGF) and the vascular endothelial growth factor (VEGF), which have important roles in cancer angiogenesis and proliferation. Using this drug, an experimental trial for the evaluation of the additional effect of an AA agent on RT was performed. In the AAT group, 25 mg/kg/day of SU11248 with a dimethyl sulfoxide (DMSO, GIBCO, Carlsbad, CA, USA) solution was given orally. For the control group and the RT group, the DMSO solution was given as a placebo. The tumor was subjected to the scheduled RT (8x2.5 Gy, three times/week) three times a week from Day 0 while the other body parts were shielded (Clinac 21EX, Varian Medical Systems, Palo Alto, CA, USA).
The tumor diameters (length and width) were measured with calipers on Days 0, 2, 4, 7, 9, 11, 14, 16, 18, 21, 23, and 25. The tumor growth in each group was evaluated by measuring the volumes (width2 x length/2) of the tumors on a given day [1]. The tumor volume on a given day was calculated as the ratio of the initial volume (V0) at the onset of the treatment (Day 0) to the volume of the given day. To avoid potential adverse events related to the expected outcome, all tumors should not exceed 20 mm in a longest diameter and be no more than 10% body weight.
Mice were fed with sterilized food and housed in laminar flow filtered hoods. All mice were monitored their conditions twice per day. We have planned to euthanize for any mice found to be moribund, cachectic, lethargic, bleeding from the tumor, or with any conditions unable to eat or drink. However, there were no severely ill animals prior to the endpoint of the study. Two mice died during the anesthesia for MR acquisition. On the 25th day, thirteen mice underwent MR imaging followed by euthanasia using carbon dioxide.
MR imaging technique
The shortening of the T1-relaxation time by the contrast agent enhanced the tissue. The T1-weighted gradient-echo was also used in the DCE-MR imaging to estimate the T1-relaxation rate and to measure the contrast agent concentration. The baseline DCE MR images at the start of the experiment and the follow-up image were obtained after four weeks in each group. The DCE-MR images of the right thigh tumor masses were obtained using a 4.7-T MR scanner (Biospec; Bruker Medical System, Karlsruhe, Germany) and a 30 mm, single-tuned surface coil. The transverse T1-weighted dynamic MR images were acquired for 12 minutes and 48 seconds (repetition time/echo time = 60.0/4.5 msec; flip angle = 70°; slice thickness = 1 mm; field of view = 30x30 mm; and matrix size = 128x128). After the four initial images were obtained as the baseline images, a contrast agent (gadoteric acid, Gd-DOTA, Guerbet, Roissy CdG, France) was intravenously injected into the tail vein of each mouse. In all the mice, 3 μmol/g (6 μL/g) of gadoteric acid was administered at a flow rate of 129 mL/hr. One hundred continuous dynamic MR images were acquired every 7.6 seconds for 12 minutes and 48 seconds. During the MR imaging, anesthesia was maintained using 1.5% isoflurane in a 1:2 mixture of O2/N2O. Gadoteric acid was intravenously injected with a 25-gauge needle into the tail vein. A heated pad was placed under each mouse to maintain its body temperature during the MR examination.
MR image analysis and perfusion parameters
The tumor time-signal intensity curve of each MR image was drawn with dots that indicated the signal intensities of the 100 continuous MR images of each mouse. Four initial images were marked at the starting point, and the other signal intensities were counted based on the ratio of the initial point to the following points. The time-signal intensity curves were obtained and interpreted according to the wash-in and wash-out patterns (Fig 1); for example, Pattern I, the rapid wash-in followed by wash-out phase; Pattern II, rapid wash-in followed by a plateau after the peak enhancement; and Pattern III, delayed wash-in and prolonged enhancement. Similarly, a previous report that evaluated the perfusion changes in seven patients with unresectable hepatocellular carcinoma using DCE-MR imaging after treatment with the AA agent thalidomide showed a significant change in the enhancement slope of the time-intensity curve after the treatment [11].
Fig 1. Patterns of the time-intensity curves demonstrating the perfusion state of a tumor on dynamic contrast-enhanced MR images.
(A) Pattern I: Rapid wash-in followed by the washout phase. (B) Pattern II: Rapid wash-in followed by a plateau after the peak enhancement. (C) Pattern III: Delayed wash-in and prolonged enhancement.
In this study, the Brix model [12, 13], a linear two-compartment open model where in the peripheral compartment has negligible effects on the central compartment, was used because it did not need T10 mapping or arterial input function measurements. In the Brix model, with the S0 (baseline signal intensity), TA (time of arrival), and AH (the constant that corresponded to the size of the interstitial space), we obtained each parameter according to the following formula.
As the concentration of the contrast agents decreased in the plasma due to the renal excretion of the contrast, the contrast agents diffused back into the plasma from the interstitial space in the target lesion. This phenomenon is represented by the rate constant Kep (sec -1, exchange rate constant from the extracellular space back to the plasma in the vascular structure, Kep = Ktrans / ve, in the Tofts model parameters) [14]. Kel (sec -1, the elimination rate constant from the plasma to the renal excretion, although some contrast agents show hepatic excretion) is the elimination coefficient used to denote the amount of the renal excretion of contrast from the plasma. This model showed dynamic tissue responses after the intravenous bolus contrast injection. Splat (the signal intensity in the plateau), TTP (time to peak enhancement), and MER (maximum enhancement ratio) were also analyzed by an in-house program developed using Matlab™ (The Mathworks, Inc., Natick, MA, USA).
Two radiologists measured the five quantitative perfusion parameters, i.e., Kep, Kel, AH, Splat/TTP, and MER, in the regions of interest (ROIs) of the tumors all together, and the ROIs were placed within the tumors to avoid overlap with normal tissue and the far peripheral zone. Because oxygen can be supplied to the peripheral zone of a tumor through diffusion and without adequate vascular supply, necrosis is usually initiated in the central portion of the tumor. According to this concept, the central area was selected for the estimation of the effect of the AA agent, and the ROIs were located in the tumors, 2 mm from their peripheral margin. Each ROI was obtained three times, and the average value of each parameter was calculated.
Statistical analysis
To show the interval increase in the tumor size, the control, AAT, RT, and AART groups were used. The ratio of the tumor growth in each group on the follow-up dates was plotted as median and interquartile range (25th– 75th percentile). To compare the interval size changes in the RT group with those in the AART group, repeated measures ANOVA was used. Due to the small sample size, to evaluate the additive effect of the combination therapy, the parameters obtained based on the Brix model from the T1-weighted DCE-MR images in both the RT and AART groups were analyzed using a Mann-Whitney U test (SPSS 20.0 version, SPSS Inc., Chicago, IL, USA). In the statistical analysis, a value was considered significant when the p value was less than 0.05.
Results
Tumor growth rate
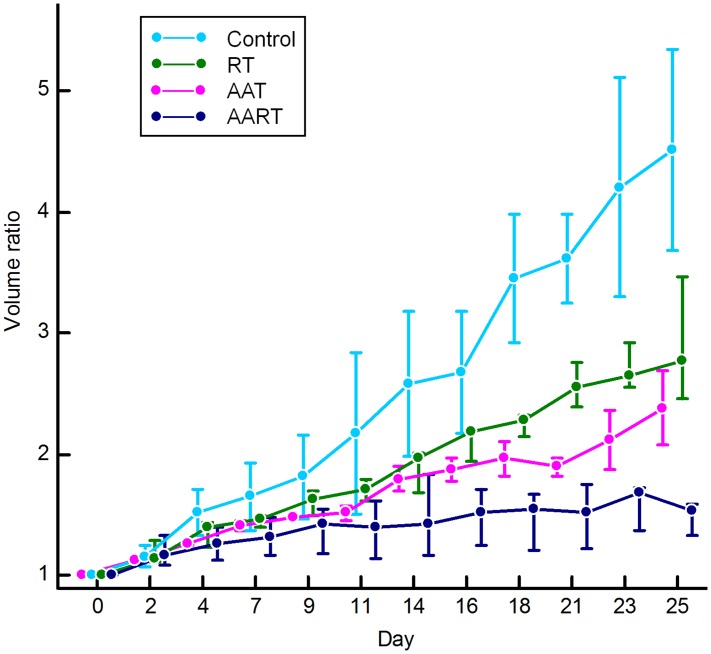
The maximum volume of the tumors was 780 mm3 in the control group (mean 215 mm3 for all time points), and the maximum diameter of the tumors was 13.5 mm. All measured serial volumes of the tumors are demonstrated in S1 Table. The tumor growth rate was more suppressed in the group treated with AART (n = 4) than in the RT alone group (n = 5) (p<0.001) (Fig 2). Moreover, compared to the control group that showed an increase in the tumor volume, which was measured at the last follow-up day, approximately five times that in the initial state, the AART group showed approximately only a two-fold increase from the initial state.
Fig 2. Tumor growth curves obtained by measuring the volumes of the tumors in the study groups.
The volume ratio of the tumor was obtained from the initial volume (V0) at the onset of the treatment (Day 0) to the following day. On the tumor growth curve, the mean volume ratio in each group on the follow-up dates was plotted. In the AART group, the tumor growth rate is much more suppressed than those in the other groups. RT, radiation therapy; AAT, antiangiogenic agent therapy; and AART, AAT plus RT.
MR images and enhancement-time curve
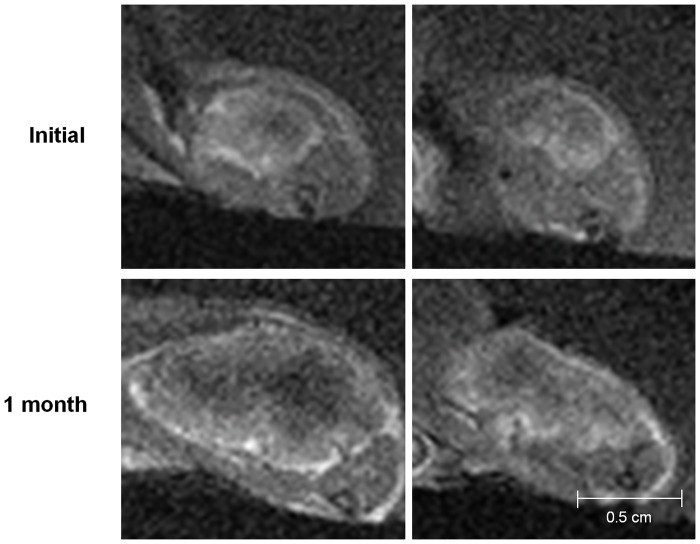
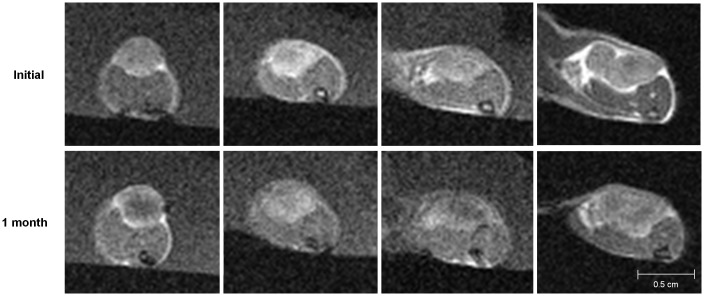
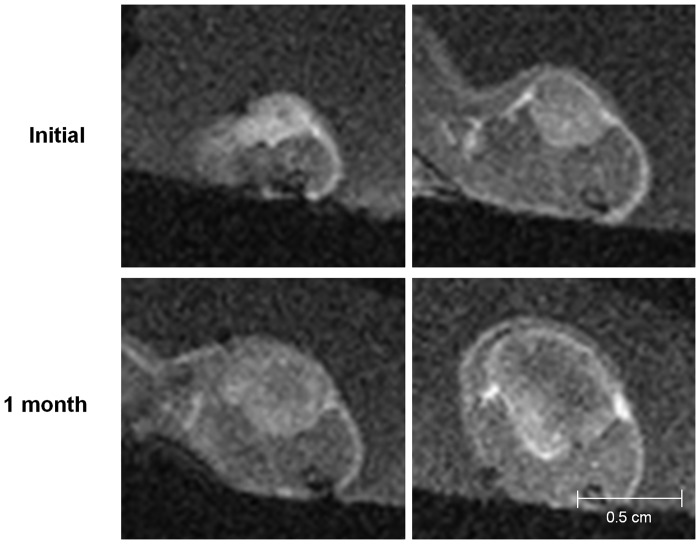
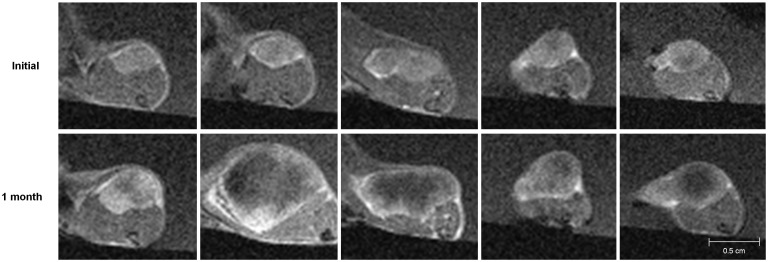
The MR images showed the interval changes of the tumors in each group (Figs 3–6). The post-treatment DCE-MR images of the control group showed significant increases in the tumor sizes and extensive poorly enhanced areas that suggested central necrosis. A wide central poorly enhanced area was also noted in the RT group. The tumors in the AAT group treated only with SU11248 showed a better-perfused state with enhancement than the tumors in the control and RT groups.
Fig 3. Initial and post-treatment MR images of the control group.
The sizes of the tumors increase and show low signal intensity changes in the central portion of the tumors that indicate necrosis.
Fig 6. Initial and post-treatment MR images of the combination therapy (AART) group.
The tumors in the AART group minimally increase and enhance without remarkable necrosis.
Fig 4. Initial and post-treatment MR images of the antiangiogenic therapy (AAT) group.
Tumors in the AAT group mildly increase in size and show a better-perfused state with enhancement than the tumors in the control or radiation therapy group.
Fig 5. Initial and post-treatment MR images of the radiation therapy group.
The tumors increase in size and show extensive central necrosis with low signal intensity and peripheral enhancement.
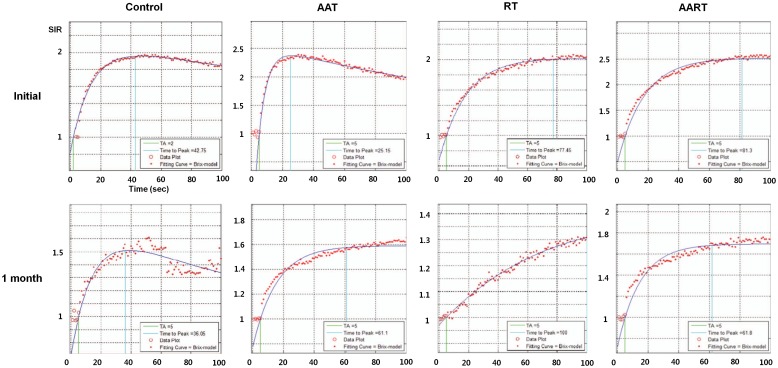
To show the time-signal intensity curves at the post-treatment states, the measured serial signal intensities in each tumor were plotted (Fig 7). In the control group, the graph slope, i.e., the speed of enhancement, was steep and gradually decreased after the peak enhancement as Pattern I. On the other hand, in the RT group, the slope of the time-signal intensity curve four weeks after the treatment was flat, and its Pattern III indicated delayed enhancement of the tumor. In the tumors in the AAT group that were treated only with the SU11248, the slope of the time-signal intensity curve after the treatment showed Pattern II, i.e., rapid wash-in and a plateau. Although the tumors in both the RT and AAT groups also showed interval growths with internal necrosis on their DCE-MR images, considering the time-signal intensity curve, the extent of the tumor necrosis seemed lesser in the AAT group than in the RT group. Among the four groups, the tumors in the AART group showed strong and rapid enhancement and a plateau, similar to Pattern II of the AAT group, and had smaller necrotic areas on the MR images than those in the other groups.
Fig 7. Tumor time-signal intensity curves obtained from the initial and post-treatment MR images of the four cases in each group that represented the interval changes.
In the control group, the time-signal intensity curve of the post-treatment MR showed a rapid enhancement and rapid washout pattern. In the AAT group, the enhancement ratios of the tumor are markedly decreased compared to the initial curve even though it shows prolonged enhancement. In the RT group, the signal intensity curve shows a delayed and prolonged enhancement pattern. The rapid wash-in and a plateau pattern of the enhancement in the AART group is similar to that of the tumor managed with AAT alone. However, the enhancement ratio is still higher than those in the AAT case. AAT, antiangiogenic therapy; AART, combination therapy; RT, radiation therapy; SIR, signal intensity ratio—measured by comparison with the initial signal intensity on the precontrast MR images.
MR perfusion biomarkers
The measured perfusion parameters in the two groups are shown in Table 1. In the AART group, the MER of the tumors was significantly high (p = 0.016), and the Splat/TTP, i.e., the time to peak enhancement, which indicates the speed of enhancement, was significantly shorter (p = 0.016) than in the RT group (Table 1). The other parameters, such as Kep, Kel, and AH, did not differ significantly between the two groups.
Table 1. The five measured perfusion parameters in the RT-alone and AART groups.
| Parameter | RT (n = 5) | AART (n = 4) | P-value |
|---|---|---|---|
| Kep | 0.0002 (0.0001, 0.0049) | 0.00006 (0.00003, 0.00012) | 0.190 |
| Kel | 0.0062 (0.0032, 0.0214) | 0.0490 (0.0202, 0.0753) | 0.063 |
| Splat/TTP | 0.0049 (0.0035, 0.0061) | 0.0107 (0.0078, 0.0142) | 0.016 |
| AH | 9.40 (1.85, 162.3) | 794.05 (201.13, 1958.61) | 0.063 |
| MER | 1.49 (1.354, 1.6126) | 1.81 (1.7488, 1.8925) | 0.016 |
The data are medians with the interquartile ranges in parentheses. RT, radiation therapy; AART, SU11248 plus RT; Kep (sec -1), exchange rate constant from the extracellular space back to the plasma in the vascular structure; Kel (sec -1), elimination rate constant from the plasma to the renal excretion; Splat, signal intensity in the plateau; TTP, time to peak enhancement; AH, constant corresponding to the size of the interstitial space; and MER, maximum enhancement ratio.
Discussion
In this study, we showed that the combination therapy of RT and AAT has a synergistic effect on anticancer treatment using DCE-MR imaging. As a tumor grows, its oxygen demand increases. However, if the cancer vessels cannot supply enough oxygen to the central portion of the tumor, the tumor becomes hypoxic in the central area. Finally, the increased tumor burden and the hypoxic environment that decreases the oxygen-free radicals result in the tumor radio-resistance [15]. AA agents can inhibit PDGF and VEGF signaling and suppress the formation of immature cancer angiogenesis, which is vulnerable to RT. AA agents can also help to retain normal vasculature in the tumor, and thus, reduce the hypoxic area after RT in the tumor [9].
In the RT group, the radiation induced extensive necrosis in the central portion of the tumor and decreased vascular supply. Necrosis with decreased blood supply creates a hypoxic area and decreases the tumoricidal effect of RT by reducing the oxygen-free radicals. However, the tumors in the AAT group showed strong and rapid enhancement with a plateau, although they also showed an interval growth similar to that of the tumors in the RT group. Moreover, the tumors in the AART group were highly enhanced without significant necrosis, and their growth was more significantly suppressed than that of the tumors in the three other groups. These results are consistent with those of previous studies that showed that AA agents suppressed immature angiogenesis and might have helped maintain the normal vasculature in the tumor [7, 9]. By maintaining the tumor perfusion and reducing tumor necrosis, the tumoricidal effects of the oxygen radicals induced by RT could be increased even in the central area of the tumors.
The enhancement curve of the AAT group appeared similar to that of the AART group in terms of the rapid enhancement and maintained plateau even after the treatment. The similar patterns of the time-signal intensity curves on the DCE-MR images imply the similar perfusion patterns of the tumors. Rodgan et al. demonstrated that the microvessel density of a tumor was correlated with the early enhancement of the tumor, and the necrotic tumor portion was correlated with late enhancement [16]. These suggest that the tumors in the AAT group and the AART group might have retained their microvessel density to show rapid and early enhancement; that is, the AA agent might have helped prevent tumor necrosis. Because AA agents can help reduce tumor growth by suppressing the cancer angiogenesis while preserving the normal vasculature, they can eventually help reduce tumor hypoxia [15]. In the other studies, the oxygen levels might have increased in the combination therapy rather than in the RT alone [17–19]. On the other hand, the RT group showed a delayed enhancement pattern with an increased time to peak enhancement. This suggests that the vulnerable cancer vessels in the tumor had been damaged by RT and resulted in more necrotic portions than in the other groups. It has been reported that the time to the peak enhancement of the parotid gland had increased on the DCE-MR images as the vascular permeability decreased and the extracellular extravascular space increased after the RT of the parotid gland [10].
The perfusion changes after each treatment were demonstrated by the DCE-MR images with the expected biomarkers. In this study, the AART group showed a significantly higher Splat/TTP (P< 0.016) and MER (P< 0.016) than the RT group. There are many published studies that attempted to find the quantitative imaging parameters related to the treatment effect on DCE-MR images. The usefulness of Ktrans and Kep in the assessment of the treatment response has been mentioned in several reports [20–23]. Akisik et al. suggested that the pretreatment Ktrans for pancreatic tumors might be useful in predicting the treatment response to an AA agent [24]. The effect of anticancer therapy measured by DCE-MR imaging has also been reported with regard to neoadjuvant chemotherapy [25–28] and RT [29–32]. In this study, we showed that one of the explanations of the synergistic effect of AAT on RT could be the retention of the tumor perfusion, which was represented by the higher values of Splat/TTP and MER. These results suggest that the early and prolonged enhancement with the plateau seen in the AART group was due to the relatively small portion of the necrosis and from the maintenance of the perfusion in the tumor.
This study had several limitations. First, we used only one type of cancer model, A549, which is a well—differentiated human lung cancer cell line. However, the treatment effect might be diversely demonstrated according to the tumor-specific characteristics such as the expression level of PDGF or VEGF, the angiogenesis potential, the oxygen tension, or the tumor stage. Therefore, the results of this study cannot be directly applied to other types of cancer models. To overcome this limitation, tumor-specific experiments in each cancer cell line and in various clinical settings are needed. Second, as we used only one kind of AA agent, a receptor tyrosine kinase inhibitor, the various mechanisms of AA agents pertaining to RT cannot be sufficiently inferred. Other types of AA agents that target the matrix metalloprotease, inhibit the angiogenesis growth factors and the activation of endothelial cells, and have multiple or unknown mechanisms of action should be investigated for combination with RT [33, 34]. Third, because we have performed MR twice for each mouse before and after the treatment, we could not demonstrate the serial course of tumor changes in each group. To better visualize the perfusion changes in the tumors, follow-up MR during each treatment could be of value. Fourth, although we did not obtain the specimens of the tumors from the mice, the imaging-pathologic correlation could help explain the perfusion changes of the tumors. Finally, this study was not designed to see the tumor changes according to the treatment dose or schedule. Such changes could also affect the tumor condition. A patient’s general health condition could also influence the treatment effect in the clinical setting.
Conclusion
The combination therapy of an AA agent and RT showed synergistic effects in the anticancer treatment. The AA agent helped maintain the perfusion in the central portion of the cancer mass in the AART group during and after the radiation therapy. The different pattern of the time-signal intensity curve on the DCE-MR imaging in each group implied the perfusion changes of the tumors, which were shown by the perfusion parameters such as Splat/TTP and MER on the DCE-MR imaging.
Supporting Information
AAT, antiangiogenic therapy group; AART, combination therapy group; RT, radiation therapy.
(DOCX)
Data Availability
All relevant data are within the paper and its Supporting Information files. Any of interested researchers can contact jslee@amc.seoul.kr to request the data of this study.
Funding Statement
This study was supported by a grant (HI10C2014) of the Korean Health Technology R&D Project of the Ministry of Health & Welfare of the Republic of Korea. The funders had no role in study design, data collection and analysis, decision to publish, or preparation of the manuscript.
References
- 1.Timke C, Zieher H, Roth A, Hauser K, Lipson KE, Weber KJ, et al. Combination of vascular endothelial growth factor receptor/platelet-derived growth factor receptor inhibition markedly improves radiation tumor therapy. Clin Cancer Res. 2008;14(7):2210–9. [DOI] [PubMed] [Google Scholar]
- 2.Yoo DS, Kirkpatrick JP, Craciunescu O, Broadwater G, Peterson BL, Carroll MD, et al. Prospective trial of synchronous bevacizumab, erlotinib, and concurrent chemoradiation in locally advanced head and neck cancer. Clin Cancer Res. 2012;18(5):1404–14. Epub 2012/01/19. 10.1158/1078-0432.ccr-11-1982 . [DOI] [PubMed] [Google Scholar]
- 3.Gorski DH, Beckett MA, Jaskowiak NT, Calvin DP, Mauceri HJ, Salloum RM, et al. Blockage of the vascular endothelial growth factor stress response increases the antitumor effects of ionizing radiation. Cancer Res. 1999;59(14):3374–8. [PubMed] [Google Scholar]
- 4.Gorski DH, Mauceri HJ, Salloum RM, Gately S, Hellman S, Beckett MA, et al. Potentiation of the antitumor effect of ionizing radiation by brief concomitant exposures to angiostatin. Cancer Res. 1998;58(24):5686–9. [PubMed] [Google Scholar]
- 5.Mauceri HJ, Hanna NN, Beckett MA, Gorski DH, Staba MJ, Stellato KA, et al. Combined effects of angiostatin and ionizing radiation in antitumour therapy. Nature. 1998;394(6690):287–91. [DOI] [PubMed] [Google Scholar]
- 6.Mauceri HJ, Hanna NN, Wayne JD, Hallahan DE, Hellman S, Weichselbaum RR. Tumor necrosis factor alpha (TNF-alpha) gene therapy targeted by ionizing radiation selectively damages tumor vasculature. Cancer Res. 1996;56(19):4311–4. [PubMed] [Google Scholar]
- 7.Sorensen AG, Emblem KE, Polaskova P, Jennings D, Kim H, Ancukiewicz M, et al. Increased survival of glioblastoma patients who respond to antiangiogenic therapy with elevated blood perfusion. Cancer research. 2012;72(2):402–7. Epub 2011/12/01. [DOI] [PMC free article] [PubMed] [Google Scholar]
- 8.Padhani AR, Leach MO. Antivascular cancer treatments: functional assessments by dynamic contrast-enhanced magnetic resonance imaging. Abdom Imaging. 2005;30(3):324–41. [DOI] [PubMed] [Google Scholar]
- 9.Loges S, Mazzone M, Hohensinner P, Carmeliet P. Silencing or fueling metastasis with VEGF inhibitors: antiangiogenesis revisited. Cancer Cell. 2009;15(3):167–70. 10.1016/j.ccr.2009.02.007 [DOI] [PubMed] [Google Scholar]
- 10.Juan CJ, Chen CY, Jen YM, Liu HS, Liu YJ, Hsueh CJ, et al. Perfusion characteristics of late radiation injury of parotid glands: quantitative evaluation with dynamic contrast-enhanced MRI. Eur Radiol. 2009;19(1):94–102. 10.1007/s00330-008-1104-9 [DOI] [PubMed] [Google Scholar]
- 11.Wang J, Chen LT, Tsang YM, Liu TW, Shih TT. Dynamic contrast-enhanced MRI analysis of perfusion changes in advanced hepatocellular carcinoma treated with an antiangiogenic agent: a preliminary study. AJR Am J Roentgenol. 2004;183(3):713–9. [DOI] [PubMed] [Google Scholar]
- 12.Brix G, Semmler W, Port R, Schad LR, Layer G, Lorenz WJ. Pharmacokinetic parameters in CNS Gd-DTPA enhanced MR imaging. Journal of computer assisted tomography. 1991;15(4):621–8. Epub 1991/07/01. . [DOI] [PubMed] [Google Scholar]
- 13.Buckley DL, Kerslake RW, Blackband SJ, Horsman A. Quantitative analysis of multi-slice Gd-DTPA enhanced dynamic MR images using an automated simplex minimization procedure. Magnetic resonance in medicine: official journal of the Society of Magnetic Resonance in Medicine / Society of Magnetic Resonance in Medicine. 1994;32(5):646–51. Epub 1994/11/01. . [DOI] [PubMed] [Google Scholar]
- 14.Leach MO, Brindle KM, Evelhoch JL, Griffiths JR, Horsman MR, Jackson A, et al. The assessment of antiangiogenic and antivascular therapies in early-stage clinical trials using magnetic resonance imaging: issues and recommendations. British journal of cancer. 2005;92(9):1599–610. Epub 2005/05/05. 10.1038/sj.bjc.6602550 [DOI] [PMC free article] [PubMed] [Google Scholar]
- 15.Wachsberger P, Burd R, Dicker AP. Tumor response to ionizing radiation combined with antiangiogenesis or vascular targeting agents: exploring mechanisms of interaction. Clin Cancer Res. 2003;9(6):1957–71. [PubMed] [Google Scholar]
- 16.Rodjan F, de Graaf P, van der Valk P, Moll AC, Kuijer JP, Knol DL, et al. Retinoblastoma: Value of Dynamic Contrast-Enhanced MR Imaging and Correlation with Tumor Angiogenesis. AJNR Am J Neuroradiol. 2012;7:7. [DOI] [PMC free article] [PubMed] [Google Scholar]
- 17.Griffin RJ, Williams BW, Wild R, Cherrington JM, Park H, Song CW. Simultaneous inhibition of the receptor kinase activity of vascular endothelial, fibroblast, and platelet-derived growth factors suppresses tumor growth and enhances tumor radiation response. Cancer Res. 2002;62(6):1702–6. Epub 2002/03/26. . [PubMed] [Google Scholar]
- 18.Lee CG, Heijn M, di Tomaso E, Griffon-Etienne G, Ancukiewicz M, Koike C, et al. Anti-Vascular endothelial growth factor treatment augments tumor radiation response under normoxic or hypoxic conditions. Cancer Res. 2000;60(19):5565–70. Epub 2000/10/18. . [PubMed] [Google Scholar]
- 19.Teicher BA, Williams JI, Takeuchi H, Ara G, Herbst RS, Buxton D. Potential of the aminosterol, squalamine in combination therapy in the rat 13,762 mammary carcinoma and the murine Lewis lung carcinoma. Anticancer research. 1998;18(4a):2567–73. Epub 1998/08/15. . [PubMed] [Google Scholar]
- 20.Galbraith SM, Maxwell RJ, Lodge MA, Tozer GM, Wilson J, Taylor NJ, et al. Combretastatin A4 phosphate has tumor antivascular activity in rat and man as demonstrated by dynamic magnetic resonance imaging. J Clin Oncol. 2003;21(15):2831–42. [DOI] [PubMed] [Google Scholar]
- 21.Maxwell RJ, Wilson J, Prise VE, Vojnovic B, Rustin GJ, Lodge MA, et al. Evaluation of the anti-vascular effects of combretastatin in rodent tumours by dynamic contrast enhanced MRI. NMR Biomed. 2002;15(2):89–98. [DOI] [PubMed] [Google Scholar]
- 22.Morgan B, Thomas AL, Drevs J, Hennig J, Buchert M, Jivan A, et al. Dynamic contrast-enhanced magnetic resonance imaging as a biomarker for the pharmacological response of PTK787/ZK 222584, an inhibitor of the vascular endothelial growth factor receptor tyrosine kinases, in patients with advanced colorectal cancer and liver metastases: results from two phase I studies. J Clin Oncol. 2003;21(21):3955–64. Epub 2003/10/01. . [DOI] [PubMed] [Google Scholar]
- 23.Thukral A, Thomasson DM, Chow CK, Eulate R, Wedam SB, Gupta SN, et al. Inflammatory breast cancer: dynamic contrast-enhanced MR in patients receiving bevacizumab—initial experience. Radiology. 2007;244(3):727–35. Epub 2007/08/22. 10.1148/radiol.2443060926 . [DOI] [PubMed] [Google Scholar]
- 24.Akisik MF, Sandrasegaran K, Bu G, Lin C, Hutchins GD, Chiorean EG. Pancreatic cancer: utility of dynamic contrast-enhanced MR imaging in assessment of antiangiogenic therapy. Radiology. 2010;256(2):441–9. 10.1148/radiol.10091733 [DOI] [PubMed] [Google Scholar]
- 25.Barentsz JO, Berger-Hartog O, Witjes JA, Hulsbergen-van der Kaa C, Oosterhof GO, VanderLaak JA, et al. Evaluation of chemotherapy in advanced urinary bladder cancer with fast dynamic contrast-enhanced MR imaging. Radiology. 1998;207(3):791–7. [DOI] [PubMed] [Google Scholar]
- 26.Knopp MV, Brix G, Junkermann HJ, Sinn HP. MR mammography with pharmacokinetic mapping for monitoring of breast cancer treatment during neoadjuvant therapy. Magn Reson Imaging Clin N Am. 1994;2(4):633–58. [PubMed] [Google Scholar]
- 27.Reddick WE, Taylor JS, Fletcher BD. Dynamic MR imaging (DEMRI) of microcirculation in bone sarcoma. J Magn Reson Imaging. 1999;10(3):277–85. [DOI] [PubMed] [Google Scholar]
- 28.van der Woude HJ, Bloem JL, Verstraete KL, Taminiau AH, Nooy MA, Hogendoorn PC. Osteosarcoma and Ewing's sarcoma after neoadjuvant chemotherapy: value of dynamic MR imaging in detecting viable tumor before surgery. AJR Am J Roentgenol. 1995;165(3):593–8. [DOI] [PubMed] [Google Scholar]
- 29.de Vries A, Griebel J, Kremser C, Judmaier W, Gneiting T, Debbage P, et al. Monitoring of tumor microcirculation during fractionated radiation therapy in patients with rectal carcinoma: preliminary results and implications for therapy. Radiology. 2000;217(2):385–91. [DOI] [PubMed] [Google Scholar]
- 30.Devries AF, Griebel J, Kremser C, Judmaier W, Gneiting T, Kreczy A, et al. Tumor microcirculation evaluated by dynamic magnetic resonance imaging predicts therapy outcome for primary rectal carcinoma. Cancer research. 2001;61(6):2513–6. [PubMed] [Google Scholar]
- 31.George ML, Dzik-Jurasz AS, Padhani AR, Brown G, Tait DM, Eccles SA, et al. Non-invasive methods of assessing angiogenesis and their value in predicting response to treatment in colorectal cancer. Br J Surg. 2001;88(12):1628–36. [DOI] [PubMed] [Google Scholar]
- 32.Mayr NA, Yuh WT, Arnholt JC, Ehrhardt JC, Sorosky JI, Magnotta VA, et al. Pixel analysis of MR perfusion imaging in predicting radiation therapy outcome in cervical cancer. J Magn Reson Imaging. 2000;12(6):1027–33. [DOI] [PubMed] [Google Scholar]
- 33.Deplanque G, Harris AL. Anti-angiogenic agents: clinical trial design and therapies in development. European journal of cancer (Oxford, England: 1990). 2000;36(13 Spec No):1713–24. Epub 2000/08/26. . [DOI] [PubMed] [Google Scholar]
- 34.Nielsen DL, Sengelov L. Inhibition of placenta growth factor with TB-403: a novel antiangiogenic cancer therapy. Expert opinion on biological therapy. 2012;12(6):795–804. Epub 2012/04/18. 10.1517/14712598.2012.679655 . [DOI] [PubMed] [Google Scholar]
Associated Data
This section collects any data citations, data availability statements, or supplementary materials included in this article.
Supplementary Materials
AAT, antiangiogenic therapy group; AART, combination therapy group; RT, radiation therapy.
(DOCX)
Data Availability Statement
All relevant data are within the paper and its Supporting Information files. Any of interested researchers can contact jslee@amc.seoul.kr to request the data of this study.


