Abstract
In this work the ability of EGFR structures to distinguish true inhibitors from decoys in docking and MM-PBSA is assessed by statistical procedures. The docking performance depends critically on the receptor conformation and bound state. The enrichment of known inhibitors is well correlated with the difference between EGFR structures rather than the bound-ligand property. The optimal structures for virtual screening can be selected based purely on the complex information. And the mixed combination of distinct EGFR conformations is recommended for ensemble docking. In MM-PBSA, a variety of EGFR structures have identically good performance in the scoring and ranking of known inhibitors, indicating that the choice of the receptor structure has little effect on the screening.
Keywords: EGFR conformation, receptor flexibility, molecular docking, enrichment, MM-PBSA
Introduction
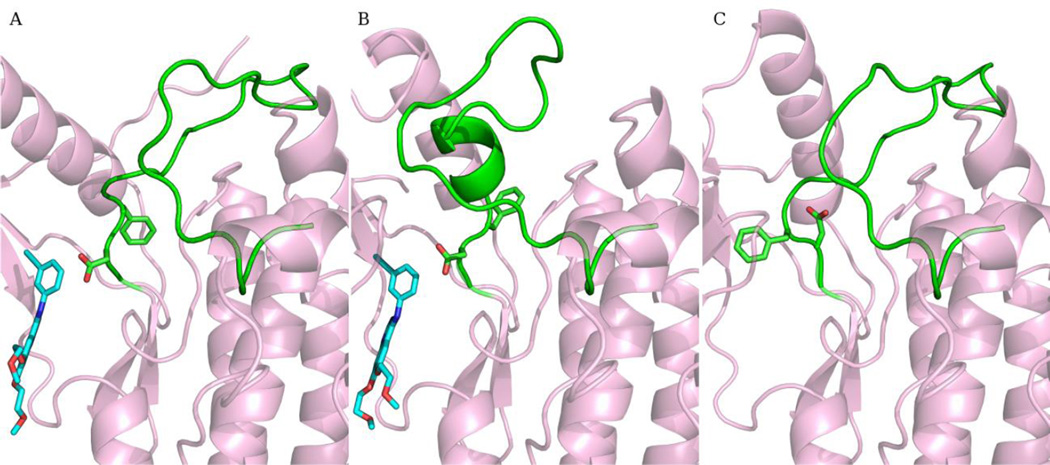
In receptor-based virtual screening, the primary challenge is the choice of the optimal structures without a prior knowledge about their docking performance. The selection will largely influence the screening results because the discernment of individual structures varies greatly and combination of distinct structures may be counter productive.[1–4] Efforts have been made to pick suitable structures for virtual screening based on properties of the ligand and receptor.[3–6] However, it is controversial if the discriminating ability of receptor structures is related with the properties. A quantitative correlation has not been established. And it remains elusive how the optimal structures can be chosen without a prior knowledge. Recent crystallography studies reveal that a ligand may bind to different conformations of a receptor. For example, Erlotinib and Gefitinib, two approved drugs for blocking Epidermal Growth Factor Receptor (EGFR), can bind with either the DFG-in active form or the Src-like inactive form (Fig. 1).[7,8] Moreover, Gefitinib can bind to the wild type and mutated EGFR both with high affinities.[9] This raises a question if the receptor conformation and mutation has an effect on virtual screening, which has not been investigated yet. In this report we start out to answer these questions by statistically analyzing the performance of EGFR structures in virtual screening.
Fig. 1.
Conformations of EGFR. (A) The DFG-in active conformation bound with Erlotinib. (B) The Src-like inactive conformation bound with Erlotinib. (C) The DFG-out inactive conformation. The activation loop is colored green. The DFG motif and Erlotinib are shown in sticks. Carbon in Erlotinib is colored cyan.
EGFR is a clinically validated drug target for cancer therapy and has been extensively studied. Three distinct conformations of EGFR have been solved (Fig. 1): the DFG-in active form (A), the Src-like inactive form (T), and the DFG-out inactive form (I). For simplicity, they will be represented by A, T, and I in the following. The structural features of EGFR conformations have been discussed as well as the transitions between them.[10] Structurally diverse EGFR inhibitors have been developed. Here we focus on EGFR kinase domain and ATP-competitive reversible inhibitors. The ability of EGFR structures to recognize known inhibitors from decoy compounds is scrutinized using Glide and, in an attempt to pursue high accuracy and explicit receptor flexibility, molecular mechanics with Poisson-Boltzmann surface area (MM-PBSA). MM-PBSA, an end-point free energy method, has been widely applied for exact estimation of binding affinities.[11–15] It has been proven helpful in understanding the correlation between experimental activities and calculated binding free energies. Due to high computational demand, MM-PBSA has rarely been employed in virtual screening.
In this work the docking performance of EGFR structures is compared, and the difference is assessed by the hypothesis testing (T-test and Wilcoxon test). The relationship between the docking performance and receptor structure as well as ligand property is measured by the Pearson and Spearman correlation coefficient. We demonstrate that it is likely to select the optimal structures for virtual screening based only on the structural information. In MM-PBSA, the scoring and ranking of known inhibitors with a variety of EGFR structures are examined. The ranking difference between two EGFR structures is evaluated by the hypothesis testing for paired data. In addition, we discuss the influence of the internal dielectric constant (IDC) and molecular dynamics (MD) simulation time on scoring and ranking.
Results
In our dataset, there are 49 EGFR structures, 27 known EGFR inhibitors, and 7561 decoy compounds (see Methods). Pose prediction and enrichment are two popular indicators of docking performance. Usually binding poses are able to be reproduced precisely,[16] so here we focus on enrichment of known inhibitors that is not very successful in benchmark exercises. The discerning ability of a single EGFR structure is measured by the enrichment factor (EF) at the top 1%. The EF is calculated as EF = (a / n) / (A / N), where N is the total size of the ligand library, n is the number of compounds selected, A is the number of known inhibitors, and a is the number of known inhibitors in the selection. In this case, n / N equals to 1%.
Ensemble Performance
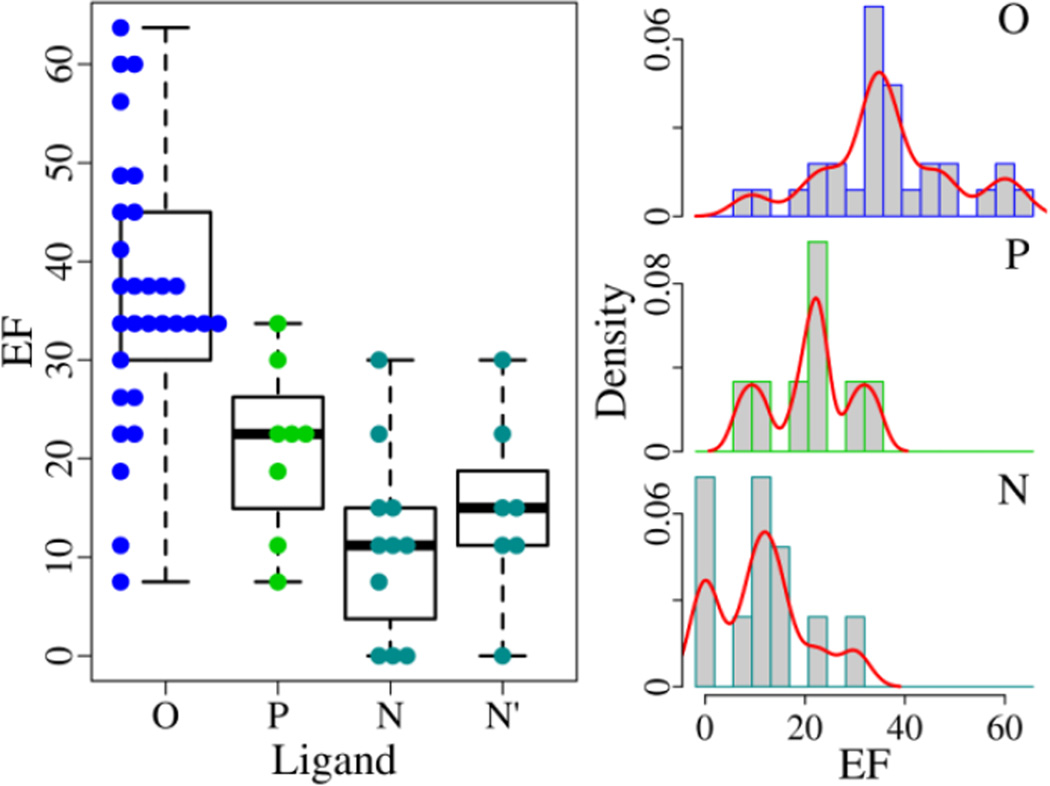
Among the 49 EGFR structures, there are 8 complex structures bound with an ATP derivative (ensemble P), 30 complex structures associated with a small-molecule organic compound (ensemble O), and 11 apo structures without a ligand (ensemble N). According to Fig. 2, the ensemble O with the mean EF of 36.3±13.4 has stronger discriminating power than the ensemble P and N with the EF average of 21.1±8.7 and 11.2±9.5, respectively. The p-values between the ensemble O and P/N are less than 0.003 with both the T-test and Wilcoxon test (Table S1), suggesting that there is significant difference between them. The ensemble P and N are likely different from each other with the p-values of 0.03 (T-test) and 0.05 (Wilcoxon test). Inspection of the two ensembles shows that the ensemble P contains only A/T-structures (the active and Src-like inactive EGFR form) and all I-structures (the DFG-out inactive EGFR form) belong to the ensemble N. As will be mentioned in the following, the I-structures have a very poor capacity of discernment. The performance of the ensemble N may deteriorate because of the I-structures. After removing the I-structures from the ensemble N, the ensemble N' is acquired with 7 A/T-structures and the mean EF is 15.0±9.4 (Table S1). The p-values between the ensemble P and N' are 0.22 (T-test) and 0.26 (Wilcoxon test), suggesting that there is no difference from each other.
Fig. 2.
Discerning ability of EGFR structures bound with different ligands in virtual screening. For the ensembles (O, P, N and N'), the EF varies from 7.5, 7.5, 0, and 0 to 63.7, 33.7, 30.0, and 30.0, respectively. The best EF (63.7) is achieved with a structure bound with an organic compound. The density curve is plotted in red.
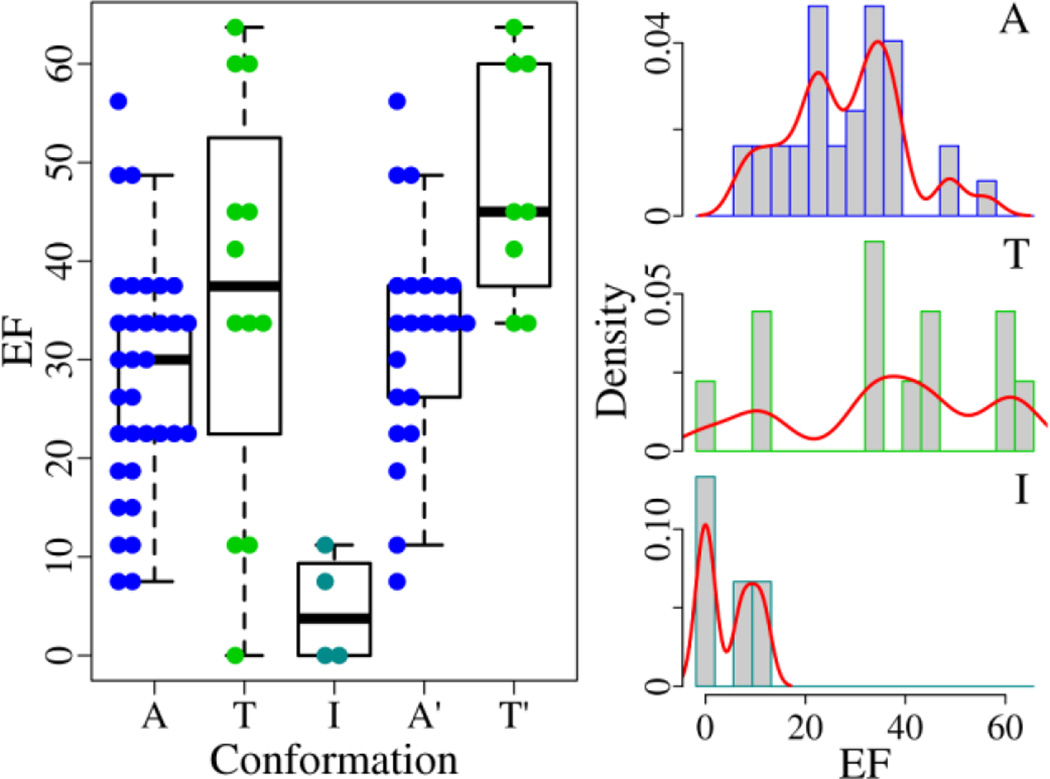
In the 49 EGFR structures, there are 33 structures adopting the form A (the active form, ensemble A), 4 I-structures (the DFG-out inactive form, ensemble I), and 12 T-structures (the Src-like inactive form, ensemble T). Apparently, the I-structures with the mean EF of 4.7±5.6 have much worse discerning power than the other two ensembles (A and T) with the EF average of 28.0±11.7 and 36.5±20.6 (Fig. 3 and Table S1). The p-values between the ensemble A and T are 0.20 (T-test) and 0.11 (Wilcoxon test), indicating that their capacity of discernment is matched. Then we compare the performance of the structures bound with an organic compound, considering the weak ability of other structures to identify known inhibitors. Among 30 structures associated with an organic compound, there are 22 A-structures (ensemble A') with the mean EF of 32.2±11.5 and 8 T-structures (ensemble T') with the EF average of 47.8±12.0 (Table S1). For the ensemble A' and T', the EF varies from 7.5 and 33.7 to 56.2 and 63.7, respectively. The p-values between them are 0.008 (T-test) and 0.007 (Wilcoxon test), suggesting that the ensemble T' has superior performance to the ensemble A'.
Fig. 3.
Discriminating power of EGFR structures adopting different conformations in virtual screening. For the ensembles (A, T, I, A', and T'), the EF fluctuates from 7.5, 0, 0, 7.5, and 33.7 to 56.2, 63.7, 11.2, 56.2, and 63.7. The best EF is reached with a T-structure. The density curve is drawn in red.
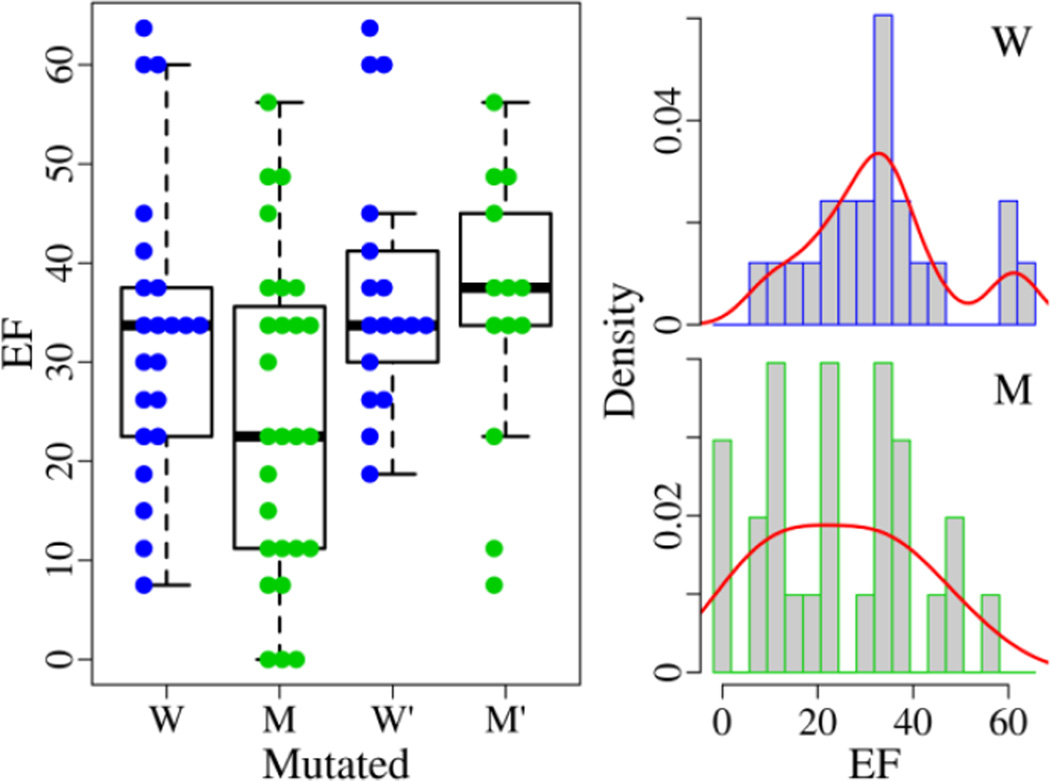
In the 49 EGFR structures, there are 22 wild type structures (ensemble W) with the EF average of 32.9±14.9 and 27 mutated structures (ensemble M) with the mean EF of 24.4±16.1 (Fig. 4 and Table S1). There is no performance difference between them with the p-values of 0.06 (T-test) and 0.10 (Wilcoxon test). Then we inspect the structures bound with an organic compound. Among 30 structures, there are 17 wild type structures (ensemble W') with the mean EF of 37.5±13.1 and 13 mutated structures (ensemble M') with the EF average of 34.9±14.2. Their abilities to retrieve known inhibitors are alike with the p-values of 0.61 (T-test) and 0.95 (Wilcoxon test). Furthermore, we examine the performance of the A/T-structures (the active and Src-like inactive form) bound with an organic compound. In 22 A'-structures (the active form A bound with an organic compound), there are 11 wild type structures with the mean EF of 30.3±6.2 and 11 mutated structures with the EF average of 34.1±15.2. Among 8 T'-structures (the Src-like inactive form bound with an organic compound), there are 6 wild type structures with the mean EF of 50.6±12.3 and 2 mutated structures with the EF average of 39.4±8.0. There is no difference in each pair of ensembles with the p-values all over 0.2 (Table S1).
Fig. 4.
Discriminative ability of wild type and mutated EGFR structures in virtual screening. For the ensembles (W, M, W' and M'), the EF changes from 7.5, 0, 18.7, and 7.5 to 63.7, 56.2, 63.7, and 56.2. The best EF is achieved with a wild type structure. The density curve is plotted in red.
According to our results, the receptor conformation and bound state play a vital role in establishing discernment of EGFR structures while the mutation has little effect. It is well known that a holo structure is preferred in virtual screening. However, we find that a structure associated with an ATP derivative is not the best option in screening for EGFR inhibitors. Statistically, the T'-structure (the Src-like inactive form bound with an organic compound), instead of the A-structure (the active conformation) or the I-structure (the DFG-out inactive form), should be the favorite choice in virtual screening for EGFR inhibitors when additional information is not available. Given that the EF of the ensemble T' fluctuates in a large range, a rule for selection of high-performance structures is still needed that is based purely on the complex conformation.
Correlations between EF and Receptor/Ligand
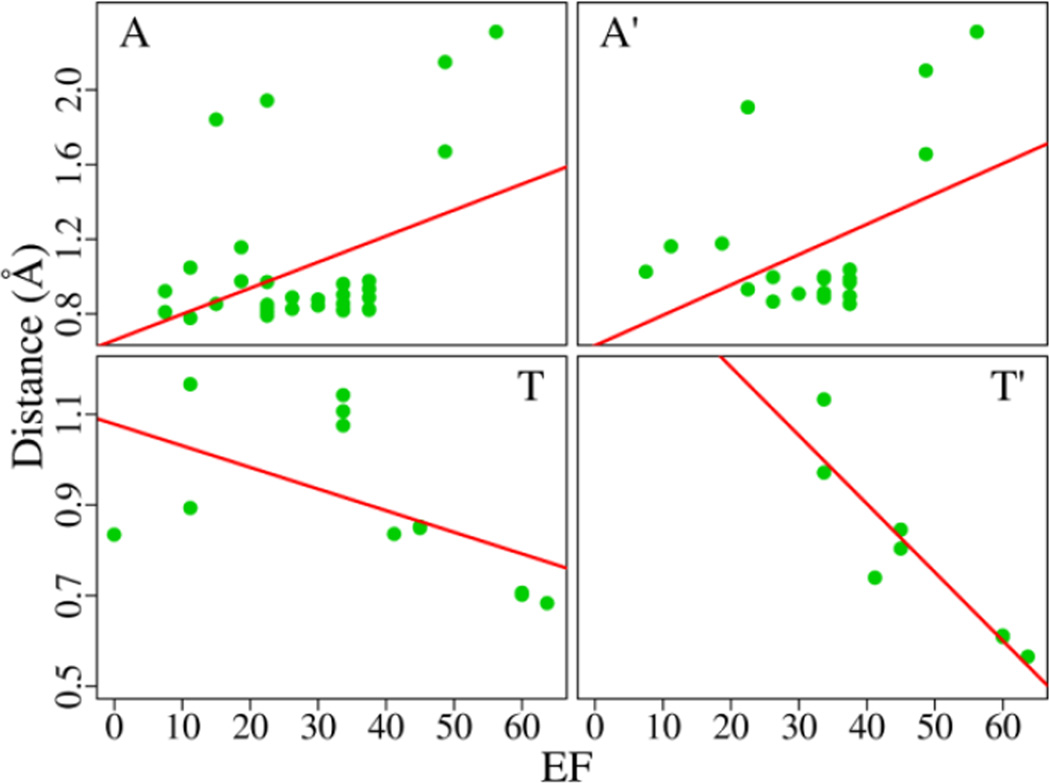
In this section we investigate if the docking performance is correlated with the EGFR structure and ligand property. The relationship is assessed by the Pearson correlation coefficient (rp) and Spearman correlation coefficient (rs). The similarity of the EGFR structures is described by root mean square deviation (RMSD) of Cα atoms. We first compute the correlation coefficient between the Cα RMSD of EGFR structures and the EF difference (ΔEF) with respect to a template structure. The ΔEF for the structure i equals to EFi − EFtemplate. For the template structure, the RMSD and ΔEF both are 0. Each EGFR structure works as the template, respectively, and the correlation coefficients are calculated in five ensembles of structures (all structures, the active form A, the Src-like inactive form T, the active form bound with an organic compound A', and the Src-like inactive form bound with an organic compound T'). With some structures as the template, the coefficients (rp and rs) are pretty good; whereas, with other structures, the coefficients are very poor (Fig. S1). It implies that the results largely depend on the selection of the template structure. To circumvent the need of a template, we define the RMSD distance between the structure i and other structures in an ensemble of n structures as: di=ΣRMSDij(n−1)/, j = 1 ⋯ n and j ≠ i, RMSDij is the pairwise Cα RMSD of the structure i and j. For all EGFR structures, the coefficients (rp and rs) between the RMSD distance and EF are close to 0 with high p-values (for selected data, see Table 1; for full data, see Table S2). For the active form (the ensemble A and A'), rp is about 0.4 with the p-values below 0.05, suggesting that the distance and EF may be linearly related. For the Src-like inactive form (the ensemble T), rp = −0.56 indicates a moderate correlation between the distance and EF whereas, with the p-value of 0.06, the assumption of linear correlation should not be accepted. On the other hand, rs is −0.66 with the p-value of 0.02 implying that the data show a monotonic relationship. For the ensemble T' (the form T bound with an organic compound), the coefficients are about −0.9 with the p-values below 0.01, suggesting that the RMSD distance and EF are strongly related. For the ensemble A and A', the coefficients are positive, indicating that an EGFR structure distant from other structures may have a powerful capacity of discernment. For the ensemble T and T', the coefficients are negative, suggesting that the structure with a good discernment should be in the center of the ensemble. As shown in Fig. 5, the best A and T structures for virtual screening can be determined based on the RMSD distance. The likeness of EGFR structures is also evaluated by Cα RMSD of the binding site (within 10 Å of the ligand), and similar but weak correlations are observed (data not shown).
Table 1.
The Pearson and Spearman correlation coefficients between the RMSD distance and EF for five ensembles of EGFR structures.
| Ensemble | Pearson | Spearman | ||
|---|---|---|---|---|
| rp | p-value | rs | p-value | |
| All | −0.05 | 0.76 | −0.08 | 0.60 |
| A | 0.39 | 0.02 | 0.18 | 0.31 |
| T | −0.56 | 0.06 | −0.66 | 0.02 |
| A' | 0.44 | 0.04 | 0.06 | 0.81 |
| T' | −0.92 | 0.001 | −0.91 | 0.002 |
Fig. 5.
Correlations between the EF and RMSD distance in four ensembles of EGFR structures.
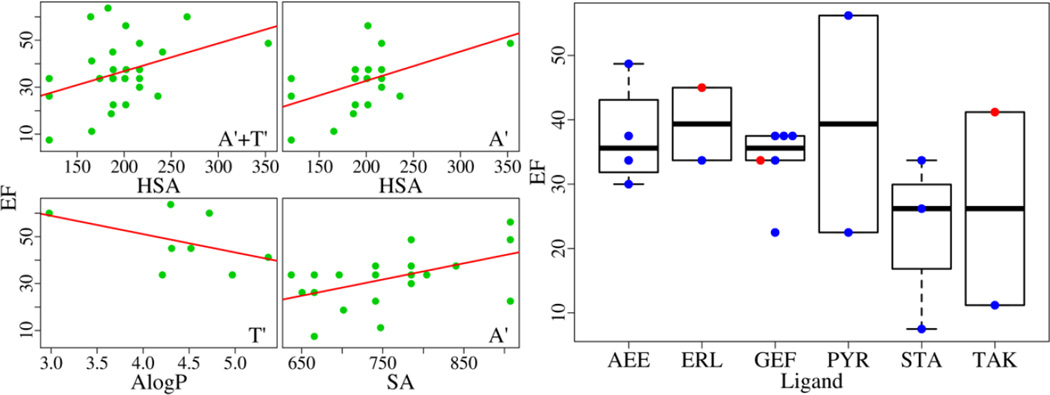
The EGFR inhibitors are described with molecular weight (MW), partition coefficient (AlogP), total surface area (SA), and hydrophobic SA (HSA) computed using Maestro. For all EGFR structures bound with an organic compound (ensemble A'+T'), the best correlation is found between EF and HSA with the rp of 0.39 and the p-value of 0.03 (Table S3). For the ensemble T' (the Src-like inactive form), the optimal rp is −0.46 with the p-value of 0.26 between EF and AlogP. For the ensemble A' (the active form), the correlation between EF and SA/HSA is very close with the rp about 0.5 and the p-value of 0.02 as well as the rs around 0.45 and the p-value below 0.05. As shown in Fig. 6, the best structures for virtual screening cannot be identified based on ligand properties. What makes the situation more intriguing is that six inhibitors are found to appear in multiple complex structures (Fig. 6). Three inhibitors can be associated with both the active form (A) and Src-like inactive form (T). Even bound to the same inhibitor, the EGFR structures have very different EFs.
Fig. 6.
Correlations between the EF and ligand properties. The best correlations for three ensembles (A'+T', A', and T') are plotted in the left panel. Six inhibitors, AEE788 (AEE), Erlotinib (ERL), Gefitinib (GEF), Pyrimidine (PYR), Staurosporine (STA), and TAK-285 (TAK), bound with multiple EGFR structures, are shown in the right panel where A-structures are colored blue and T-structures are colored red.
Ensemble Docking
All combinations of two and three EGFR structures have been enumerated. The docking score of a ligand is determined to be the lowest score or the average score obtained from distinct structures. The EF for each combination is computed. As aforementioned, the structures bound with an organic compound are more powerful in discernment than other structures. Consistently, conjunctions of A'/T' structures (the active and Src-like inactive form bound with an organic compound) perform much better than other assemblages (data not shown). For clarity and simplicity, only combinations of the A'/T' structures are discussed in this section and A/T replaces A'/T' in the representation of multiple structures.
The capacity of discernment between the lowest score and average score is compared first. There always is significant difference between them with low p-values (Table S4), indicating that the lowest score leads to stronger discriminating power than the average score. The distribution of EFs with the lowest score and average score is plotted in Fig. 7 and S2. In the following we will discuss only the EFs acquired from the lowest score.
Fig. 7.
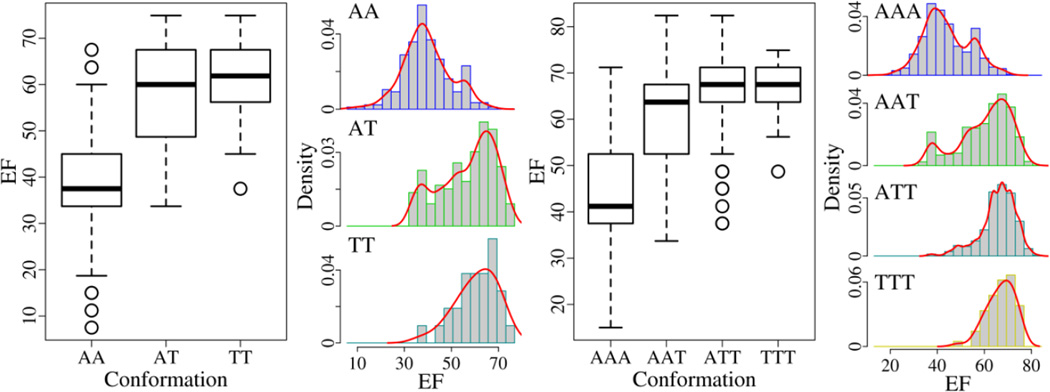
Discernment of two and three EGFR structures in virtual screening with the lowest score as the ligand score.
The performance of multiple structures is evaluated to determine which ensemble has the best discerning ability (Table S5). For two-structure combinations (Fig. 7), the maximal EF (74.9) is reached by the ensemble AT (combinations of an active structure and a Src-like inactive structure) and TT (combinations of two Src-like inactive structures). The discriminative power between the ensemble AT (the mean EF is 56.8) and TT (the EF average is 60.6) looks alike with the p-values of 0.05 (T-test) and 0.15 (Wilcoxon test). And there is pronounced difference between the ensemble AA (combinations of two active structures with the mean EF of 39.4) and AT/TT with the p-values smaller than 0.001 (Table S5). Thus, the optimal two-structure ensemble is AT or TT. For three-structure combinations (Fig. 7), the highest EF (82.4) is achieved by the ensemble AAT (combinations of two active structures and one Src-like inactive structure) and ATT (combinations of one active structure and two Src-like inactive structures). The ensemble ATT (the mean EF is 65.8) is akin to the ensemble TTT (combinations of three Src-like inactive structures with the EF average of 66.9) in the capacity of discernment with the p-values of 0.17 (T-test) and 0.40 (Wilcoxon test). And any other two ensembles are significantly different from each other with the p-values under 0.001 (Table S5). Therefore, the optimal three-structure ensemble is ATT or TTT. The results suggest that a mix of the active structures (A) and Src-like inactive structures (T) or a combination of the Src-like inactive structures (T) is preferred to a conjunction of the active structures (A) in virtual screening for EGFR inhibitors.
In previous studies it has been pointed out that multiple structures can perform better than single structures in docking. Here we examine if the performance difference is statistically meaningful. The discriminative power of the optimal one-structure (T', the Src-like inactive form bound with an organic compound), two-structure (AT/TT, combinations of an active structure and a Src-like inactive structure or two Src-like inactive structures), and three-structure (ATT/TTT, combinations of one active structure and two Src-like inactive structure or three Src-like inactive structures) ensembles is compared. The highest EF grows from 63.7 (T') to 74.9 (AT/TT), and then to 82.4 (ATT). The mean EF ascends from 47.8 (T') to 56.8/60.6 (AT/TT), and then to 65.8/66.9 (ATT/TTT). The difference between the ensemble T' and AT/TT is not pronounced with the p-values over 0.01, whereas there is significant difference between the ensemble T'/AT/TT and ATT/TTT with the p-values below 0.01 (Table S6). These results suggest that three EGFR structures joining together drastically improve the capacity of discernment in virtual screening compared with one-structure and two-structure ensembles. Although the A'-structures (the active form bound with an organic compound) are not preferred in virtual screening for EGFR inhibitors, for many kinases, only the active conformation has been solved in reality. Therefore, we inspect if multiple A'-structures also ameliorate the capacity of discernment. The mean EF of the ensemble A', AA, and AAA is 32.2±11.5, 39.4±10.2, and 44.0±9.9, respectively. The p-values between them are all less than 0.01 (Table S7), indicating that the docking performance is enhanced with multiple A'-structures.
Furthermore, we investigate if it is likely to choose a small subset of structures for the optimal productivity without a prior knowledge about the docking performance. According to Fig. 5, the top 2 A'-structures (the active form) and 3 T'-structures (the Src-like inactive form) can be selected based on the RMSD distance (Table 2). The best A'-structure (3W2R) coupled with the optimal T'-structure (2RGP) results in an EF of 74.9, which is the maximum in the two-structure combinations. Three top structures joining together are able to reach an EF up to 78.7, which is close to the best EF of 82.4 in the three-structure combinations. The assemblage of three top T-structures has an EF of 74.9, the maximal EF in the ensemble TTT. The union of other two or three top structures leads to outcomes better than a single structure, and even equal to the highest EF. Thus, the best single structure is easily identified based on the RMSD distance. The optimal two-structure conjunction can be acquired by simply combining the best A and T structures. Whereas the best EF in the three-structure ensemble is inaccessible without a prior knowledge, a high EF close to the maximum can be obtained. In addition, we find that the conjunction of distinct EGFR conformations has a good chance to hit the optimal EF. For the two-structure ensemble, there are 7 combinations that have the highest EF of 74.9, of which 6 are from the ensemble AT (combinations of an active structure and a Src-like inactive structure) and only one comes from the ensemble TT (combinations of two Src-like inactive structures). For the three-structure ensemble, the best EF of 82.4 is reached by three mixed combinations (one AAT, the combination of two active structures and one Src-like inactive structures, and two ATT, combinations of one active structure and two Src-like inactive structures).
Table 2.
Five EGFR structures with high EFs identified based on the RMSD distance.
| Structure | Ensemble | EF | Distance |
|---|---|---|---|
| 3W2R | A' | 56.2 | 2.3 |
| 3LZB | A' | 48.7 | 2.1 |
| 2RGP | T' | 63.7 | 0.57 |
| 3BEL | T' | 60 | 0.61 |
| 1XKK | T' | 60 | 0.61 |
Many EGFR structures are unsuitable for MD simulations because of missing residues. Out of the 49 EGFR structures, 17 complete structures are employed for the MM-PBSA calculations, including 13 A-structures (the active form), 1 T-structure (the Src-like inactive form), and 3 I-structures (the DFG-out inactive form). There are five structures in apo form, comprised of 2 A-structures and 3 I-structures. Ninety-two compounds top-ranked in docking are selected, and each of them appears at the top 1% with at least 10 EGFR structures. These compounds are considered the most easily recognized ones, of which 15 are known EGFR inhibitors.
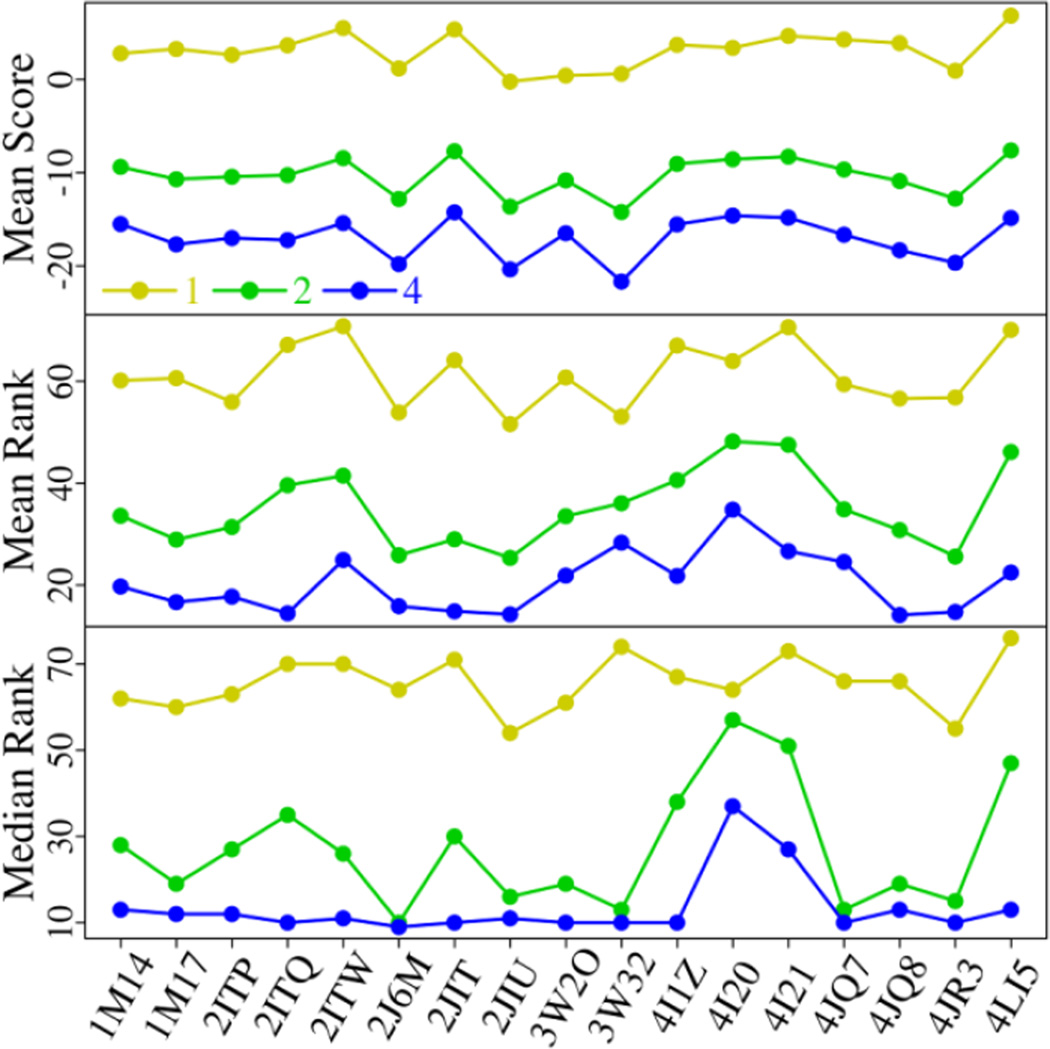
We first discuss the IDC’s (internal dielectric constant) effect on MM-PBSA results. The mean score, mean rank, and median rank of 15 known inhibitors with the IDC value of 1, 2, and 4 are listed in Fig. 8 for each EGFR structure. With the IDC rising from 1 to 4, the mean score decreases steadily. Experimentally, most of the inhibitors have been reported to be against EGFR with Kd/IC50 at low-nanomolar range. Since the IC50 values do not directly correspond to the binding free energies, we assume that the activities of these potent inhibitors will not diverge heavily from each other, and thereby the mean binding affinity is expected to be around −10 kcal/mol (RTlnKd). According to Fig. 8, the scores computed from the IDC of 2 agree well with the experimental activities. Similarly, there is a marked drop in the mean and median rank with the IDC increasing. The median rank is a good indicator for evaluation of enrichment. A median rank of 10 means that 8 EGFR inhibitors (half of the 15 known inhibitors) are ranked at the top 10. With the IDC of 4, all EGFR structures except two (4I20 and 4I21) have a median rank equal to or below 13. By contrast, with the IDC of 2, only three EGFR structures have a median rank no more than 13. The enrichment of known inhibitors is greatly improved with the IDC augmented. Thus, the IDC value exerts immense influence over the scoring and ranking of EGFR inhibitors. With the IDC of 4, the known inhibitors can be well distinguished from decoys though the calculated scores are a little lower than the experimental values. Our results suggest that the IDC needs to be carefully adjusted when MM-PBSA is applied for virtual screening. Moreover, we examine if the MD simulation length will affect the scoring and ranking. The results show that, within 10 ns, the simulation time has little effect on the mean score, mean rank, and median rank when the IDC is 2 or 4 (Fig. S3).
Fig. 8.
The mean score, mean rank, and median rank of 15 EGFR inhibitors with the IDC of 1, 2, and 4, respectively, for 17 EGFR structures. The scores between 17 EGFR structures and 92 compounds including the 15 EGFR inhibitors are calculated using MM-PBSA with a 10-ns MD simulation for each EGFR-compound complex.
In Fig. 8 we notice that, with the same IDC, the mean score, mean rank, and median rank achieved from distinct structures do not alter very much. The ranking difference of the 15 known inhibitors between any pair of EGFR structures is evaluated by the hypothesis testing for paired data (paired T-test and Wilcoxon signed rank test). When the IDC is 4, the number of structure pairs that are statistically different (p-values < 0.05) reduces from 17 to 4 with the simulation extended from 2 to 10 ns (Table 3). When the MD simulation is over 8 ns, there is no pronounced difference (p-values < 0.01) between any pair of EGFR structures. It looks that the ranking difference induced by diverse EGFR structures diminishes when the simulation is prolonged. The same tendency is observed with the IDC of 2 (Table 3) whereas a few pairs of structures are still prominently different even in 10-ns simulations. The results suggest that the ranking of known inhibitors is crucially dependent on the IDC and simulation time, while relatively insensitive to the starting structure.
Table 3.
The evolving number of pairs of EGFR structures that are statistically different with the MD simulation time increasing.
| Time (ns) | 2 | 4 | 6 | 8 | 10 | ||
|---|---|---|---|---|---|---|---|
| Number of pairs | IDC = 2 | p-values < 0.05 | 17 | 14 | 17 | 13 | 13 |
| p-values < 0.01 | 6 | 4 | 4 | 2 | 1 | ||
| IDC = 4 | p-values < 0.05 | 17 | 12 | 13 | 9 | 4 | |
| p-values < 0.01 | 4 | 2 | 1 | 0 | 0 | ||
In docking, the 17 EGFR structures have an EF varying widely from 0 to 48.7. The docking performance critically relies on the receptor conformation and bound state as aforementioned. By contrast, with MM-PBSA where the receptor moves freely, most of EGFR structures resemble each other in the scoring and ranking despite of dissimilarity of the starting structures. Among the 17 EGFR structures, two I-structures (4I20 and 4I21) have a big median rank, indicating weak capacity of discernment, and are involved in nearly all structure pairs that are statistically different. The other 15 structures, no matter what conformation adopted and if bound or not, all perform identically well with small median ranks. Thus, the structural preference in docking, induced by the rigid-receptor assumption and status of crystal structures, can be effectively eliminated. The MM-PBSA results are slightly influenced by the selection of the EGFR structure.
Discussion
In this work we scrutinize the ability of EGFR structures to distinguish true inhibitors from decoys by accounting for receptor flexibility to various degrees. Docking strikes a balance between the efficiency and accuracy with the rigid-receptor assumption. Ensemble docking makes use of multiple receptor structures, and is an implicit approach of incorporating receptor flexibility in the standard docking protocol. MM-PBSA explicitly takes receptor plasticity into account and is supposed to be more precise than docking. We demonstrate that the EF is well correlated with the RMSD distance of EGFR structures rather than ligand properties. Accordingly, the optimal structures can be picked for virtual screening without a prior knowledge. With current computer power, it is too demanding to fully implement protein flexibility in docking, especially when a large database is screened. As a compromise, docking is satisfactory for the large-scale virtual screening with a few high-performance structures, and then advanced approaches such as MM-PBSA can be employed in post-processing of docking outcomes. Our results suggest that ensemble docking is preferred in virtual screening for the optimal productivity while a single receptor structure is usually good enough in MM-PBSA.
We emphasize the importance of receptor conformations (the active form A, the Src-like inactive form T, and the DFG-out inactive form I) in virtual screening. However, due to limitation of available EGFR structures, the discriminative power of the ensemble I may be underestimated. Considering that the apo structures usually fail to recognize known inhibitors, the inferior performance of the I-structures, that all are in the free state, is likely caused by the lack of complex structures associated with an organic compound. Although inhibitors targeting the DFG-out inactive form (I) have been discovered for some kinases, to date it is unclear if an EGFR inhibitor can bind to the conformation I. Moreover, in MM-PBSA one I-structure (4I1Z), that has a very low EF in docking, performs as well as the active (A) and Src-like inactive (T) structures. Therefore, the discerning ability of the ensemble I needs to be reappraised when complex structures are accessible.
Methods
EGFR Structures
EGFR structures were downloaded from Protein Data Bank (PDB). The structures bound with an irreversible inhibitor or without the kinase domain were excluded. The chain A was chosen in multiple-chain PDB files. The different chains in one PDB file were found to be almost the same. The choice of any one should be fine, though the selection of chain A was a little arbitrary. At the time of analysis 49 EGFR structures of kinase domain were obtained: 1M14, 1M17,[17] 1XKK,[18] 2EB2, 2EB3, 3UG1, 3UG2, 3VJN, 3VJO,[19] 2GS2, 2GS7,[20] 2ITN, 2ITO, 2ITP, 2ITQ, 2ITT, 2ITU, 2ITV, 2ITW, 2ITX, 2ITY, 2ITZ, 2J6M,[21] 2JIT, 2JIU,[9] 2RF9, 2RFD, 2RFE,[22] 2RGP,[23] 3BEL,[24] 3GT8,[25] 3LZB,[26] 3POZ,[27] 3W2O, 3W2R, 3W2S,[28] 3W32, 3W33,[29] 4HJO,[7] 4I1Z, 4I20, 4I21, 4I22, 4I23,[8] 4JQ7, 4JQ8, 4JR3, 4JRV,[30] 4LI5.[31]
Ligand dataset
The set of Clean Drug-Like T60 (2013-11-05) retrieved from the ZINC database[32] worked as the decoys, including 7561 compounds with the Tanimoto cutoff level of 60%. We collected 27 reversible inhibitors targeting the ATP-binding site of EGFR experimentally tested (Fig. S4). The 27 compounds were processed by LigPrep implemented in the Schrödinger Suite release 2014[33] and Ionization/tautomeric states were generated. These compounds were assigned AMSOL charge with the same parameters used in the ZINC database. The 27 inhibitors were compared with the T60 set, and the Tanimoto similarity between them was less than 0.3.
Docking
The EGFR structures were processed by the Protein Preparation Wizard (PrepWizard) in Maestro. Water molecules, ions, and other small molecules were removed. The hydrogen was added to the EGFR structures and the hydrogen bonding network was optimized. The entire structures including all atoms were then energy-minimized with the OPLS 2005 force field. Docking grids were generated with the enclosing box of 20 Å. All docking calculations were performed with Glide in the SP (Standard Precision) mode. The above procedures were carried out in the Schrödinger Suite release 2014. The docking score of the top-ranked 1%, 2%, 10% and all compounds was compared (Table S8). With any EGFR structure, the p-values between the top 1% and others were less than 0.01, indicating that the compounds ranked at top 1% has significantly lower scores than others and 1% is a cutoff stricter than 2% or 10%.
Hypothesis testing
Two hypothesis testing methods, T-test and Wilcoxon test, are employed to assess if two groups of data are statistically different from each other. The null hypothesis is that there is no difference. The T-test is a parametric statistical procedure, and the Wilcoxon test is a nonparametric statistical procedure. Parametric procedures presume that the data follow a normal distribution while nonparametric procedures do not rely on assumptions of the underlying population distribution. Neither method is a perfect solution in all cases. Therefore, both approaches are utilized to compute the p-value between two datasets in this work. Normality of our data is checked with the Shapiro normality test. The null hypothesis that the data are normal should be rejected in many cases with the p-value below 0.05. Fortunately, the p-values calculated from the T-test and Wilcoxon test are usually close to each other no matter if the data look like a normal distribution. Accordingly, the hypothesis testing method has little effect on our conclusions.
Two-sample T-test and Wilcoxon rank sum test were employed to measure the docking power of two ensembles of EGFR structures. Paired T-test and Wilcoxon signed rank test were utilized to evaluate the ranking of known inhibitors between two EGFR structures with MM-PBSA. All hypothesis testing was carried out at 5% significance level with the statistical software R v3.1.[34]
Correlation coefficient
Pearson product-moment correlation coefficient, a parametric procedure, assesses the degree of linear dependence between two variables. Spearman rank correlation coefficient, a nonparametric procedure, estimates how well two variables are monotonically related. The null hypothesis in the hypothesis testing is that there is no correlation between two variables.
Pearson and Spearman correlation coefficients were employed to evaluate the degree of association between the EF and properties of receptor/ligand. The correlation coefficients and p-values were calculated with R v3.1.
Molecular Dynamics
The 17 EGFR structures were edited and some residues at the two ends were removed so that they all had 282 residues. The binding poses of 92 compounds were retrieved from the docking results. For each EGFR-compound complex, the ligand pose with the lowest docking score was chosen. These complexes worked as the starting structures in MD simulations.
The protein of EGFR was modeled using the Amber ff03 force field,[35] and the ligands were modeled using the general Amber force field (GAFF).[36] The complex structures were explicitly solvated in a rectangular box with TIP3P[37] water molecules. Counter ions (Na+/Cl2212;) were added to neutralize uncompensated charges when needed. After the whole system was set up, a series of energy minimizations and equilibrations were performed. First, the water molecules, hydrogen atoms and salt ions were subjected to 3000 steps of steepest descent minimization followed by 12000 steps of conjugate gradient minimization while other heavy atoms were constrained with a harmonic force of 2.0 kcal/(mol·Å2). Next, the whole system was energy minimized with 20000 steps of L-BFGS algorithm without any harmonic restraint. Then, coupled to a Langevin thermostat, the system was heated from 10 K up to 300 K by increments of 100 K in 20 ps and continued to run for 40 ps at 300 K at constant volume. Finally, the system was equilibrated for 200 ps in NPT ensemble with the Langevin thermostat and isotropic position scaling, at 300 K and 1 bar. In the production run, a 10-ns simulation for each complex was performed in NVT ensemble with the Langevin thermostat at 300 K using the parallel CUDA version of PMEMD[38] on 2 GPUs. The trajectories were sampled at a time interval of 10 ps.
The MD simulations were carried out with Amber 14.[39] The equations of motion were solved with the leapfrog integration algorithm with a time step of 2 fs. The lengths of all bonds involving hydrogen atoms were kept constrained with the SHAKE algorithm.[40] The particle mesh Ewald (PME) method was applied for treating long-range electrostatic interactions. Periodic boundary condition was used in all simulations.[41]
MM-PBSA
In MM-PBSA, the binding affinity (ΔGbind) is estimated from the free energies of the reactants (receptor and ligand) and product (complex): ΔGbind=Gcomplex − (Greceptor + Gligand). The free energy of a state (receptor, ligand, or complex) is decomposed into the gas-phase molecular mechanics energies (EMM), solvation energies (Gsolv), and conformational entropy (TS). The standard molecular mechanics energy includes internal (bond, angle, and dihedral), electrostatic, and van der Waals interactions. The solvation energy is determined by the polar (Gpol) and nonploar (Gnp) contributions. The polar solvation contribution is calculated by solving the Poisson-Boltzmann (PB) equation, and the nonploar contribution is estimated by the solvent accessible surface area (SASA). The entropy contribution is obtained by the normal mode analysis or quasi-harmonic approximation, which is usually ignored in MM-PBSA reports. Thus, the binding affinity is calculated as the sum of the three energy terms.
The MM-PBSA calculations were performed with MMPBSA.py[42] implemented in Amber 14. The internal dielectric constant was set to 1, 2, and 4, respectively. Other parameters were kept default. For the calculations with 2, 4, 6, 8, and 10 ns MD simulations, 200, 400, 600, 800, and 1000 snapshots sampled in the corresponding time were used. The entropy contribution was omitted because of its controversial effect on results and high computational cost.
Supplementary Material
Acknowledgment
This work was supported by The Hormel Foundation and National Institutes of Health grants CA172457, CA166011 and R37 CA081064.
Footnotes
The authors declare no competing financial interests.
References
- 1.Damm KL, Carlson HA. Exploring experimental sources of multiple protein conformations in structure-based drug design. J Am Chem Soc. 2007;129:8225–8235. doi: 10.1021/ja0709728. [DOI] [PubMed] [Google Scholar]
- 2.Huang SY, Zou XQ. Ensemble docking of multiple protein structures: Considering protein structural variations in molecular docking. Proteins. 2007;66:399–421. doi: 10.1002/prot.21214. [DOI] [PubMed] [Google Scholar]
- 3.Rueda M, Bottegoni G, Abagyan R. Recipes for the Selection of Experimental Protein Conformations for Virtual Screening. J Chem Inf Model. 2010;50:186–193. doi: 10.1021/ci9003943. [DOI] [PMC free article] [PubMed] [Google Scholar]
- 4.Li Y, Kim DJ, Ma WY, Lubet RA, Bode AM, et al. Discovery of Novel Checkpoint Kinase 1 Inhibitors by Virtual Screening Based on Multiple Crystal Structures. J Chem Inf Model. 2011;51:2904–2914. doi: 10.1021/ci200257b. [DOI] [PMC free article] [PubMed] [Google Scholar]
- 5.Ben Nasr N, Guillemain H, Lagarde N, Zagury JF, Montes M. Multiple Structures for Virtual Ligand Screening: Defining Binding Site Properties-Based Criteria to Optimize the Selection of the Query. J Chem Inf Model. 2013;53:293–311. doi: 10.1021/ci3004557. [DOI] [PubMed] [Google Scholar]
- 6.Wang B, Buchman CD, Li L, Hurley TD, Meroueh SO. Enrichment of Chemical Libraries Docked to Protein Conformational Ensembles and Application to Aldehyde Dehydrogenase 2. J Chem Inf Model. 2014;54:2105–2116. doi: 10.1021/ci5002026. [DOI] [PMC free article] [PubMed] [Google Scholar]
- 7.Park JH, Liu Y, Lemmon Ma, Radhakrishnan R. Erlotinib binds both inactive and active conformations of the EGFR tyrosine kinase domain. Biochem J. 2012;448:417–423. doi: 10.1042/BJ20121513. [DOI] [PMC free article] [PubMed] [Google Scholar]
- 8.Gajiwala KS, Feng JL, Ferre R, Ryan K, Brodsky O, et al. Insights into the Aberrant Activity of Mutant EGFR Kinase Domain and Drug Recognition. Structure. 2013;21:209–219. doi: 10.1016/j.str.2012.11.014. [DOI] [PubMed] [Google Scholar]
- 9.Yun CH, Mengwasser KE, Toms AV, Woo MS, Greulich H, et al. The T790M mutation in EGFR kinase causes drug resistance by increasing the affinity for ATP. Proc Natl Acad Sci USA. 2008;105:2070–2075. doi: 10.1073/pnas.0709662105. [DOI] [PMC free article] [PubMed] [Google Scholar]
- 10.Li Y, Li X, Ma W, Dong Z. Conformational Transition Pathways of Epidermal Growth Factor Receptor Kinase Domain from Multiple Molecular Dynamics Simulations and Bayesian Clustering. J Chem Theory Comput. 2014;10:3503–3511. doi: 10.1021/ct500162b. [DOI] [PMC free article] [PubMed] [Google Scholar]
- 11.Wang JM, Morin P, Wang W, Kollman PA. Use of MM-PBSA in reproducing the binding free energies to HIV-1 RT of TIBO derivatives and predicting the binding mode to HIV-1 RT of efavirenz by docking and MM-PBSA. J Am Chem Soc. 2001;123:5221–5230. doi: 10.1021/ja003834q. [DOI] [PubMed] [Google Scholar]
- 12.Okimoto N, Futatsugi N, Fuji H, Suenaga A, Morimoto G, et al. High-performance drug discovery: computational screening by combining docking and molecular dynamics simulations. PLoS Comput Biol. 2009;5:e1000528. doi: 10.1371/journal.pcbi.1000528. [DOI] [PMC free article] [PubMed] [Google Scholar]
- 13.Rastelli G, Del Rio A, Degliesposti G, Sgobba M. Fast and Accurate Predictions of Binding Free Energies Using MM-PBSA and MM-GBSA. J Comput Chem. 2010;31:797–810. doi: 10.1002/jcc.21372. [DOI] [PubMed] [Google Scholar]
- 14.Homeyer N, Gohlke H. Free Energy Calculations by the Molecular Mechanics Poisson-Boltzmann Surface Area Method. Mol Inf. 2012;31:114–122. doi: 10.1002/minf.201100135. [DOI] [PubMed] [Google Scholar]
- 15.Genheden S, Ryde U. The MM/PBSA and MM/GBSA methods to estimate ligand-binding affinities. Expert Opin Drug Discov. 2015;10:449–461. doi: 10.1517/17460441.2015.1032936. [DOI] [PMC free article] [PubMed] [Google Scholar]
- 16.Damm-Ganamet KL, Smith RD, Dunbar JB, Jr, Stuckey JA, Carlson HA. CSAR Benchmark Exercise 2011–2012: Evaluation of Results from Docking and Relative Ranking of Blinded Congeneric Series. J Chem Inf Model. 2013;53:1853–1870. doi: 10.1021/ci400025f. [DOI] [PMC free article] [PubMed] [Google Scholar]
- 17.Stamos J, Sliwkowski MX, Eigenbrot C. Structure of the epidermal growth factor receptor kinase domain alone and in complex with a 4-anilinoquinazoline inhibitor. J Biol Chem. 2002;277:46265–46272. doi: 10.1074/jbc.M207135200. [DOI] [PubMed] [Google Scholar]
- 18.Wood ER, Truesdale AT, McDonald OB, Yuan D, Hassell A, et al. A unique structure for epidermal growth factor receptor bound to GW572016 (Lapatinib): Relationships among protein conformation, inhibitor off-rate, and receptor activity in tumor cells. Cancer Res. 2004;64:6652–6659. doi: 10.1158/0008-5472.CAN-04-1168. [DOI] [PubMed] [Google Scholar]
- 19.Yoshikawa S, Kukimoto-Niino M, Parker L, Handa N, Terada T, et al. Structural basis for the altered drug sensitivities of non-small cell lung cancer-associated mutants of human epidermal growth factor receptor. Oncogene. 2013;32:27–38. doi: 10.1038/onc.2012.21. [DOI] [PubMed] [Google Scholar]
- 20.Zhang X, Gureasko J, Shen K, Cole PA, Kuriyan J. An allosteric mechanism for activation of the kinase domain of epidermal growth factor receptor. Cell. 2006;125:1137–1149. doi: 10.1016/j.cell.2006.05.013. [DOI] [PubMed] [Google Scholar]
- 21.Yun CH, Boggon TJ, Li YQ, Woo MS, Greulich H, et al. Structures of lung cancer-derived EGFR mutants and inhibitor complexes: Mechanism of activation and insights into differential inhibitor sensitivity. Cancer Cell. 2007;11:217–227. doi: 10.1016/j.ccr.2006.12.017. [DOI] [PMC free article] [PubMed] [Google Scholar]
- 22.Zhang X, Pickin KA, Bose R, Jura N, Cole PA, et al. Inhibition of the EGF receptor by binding of MIG6 to an activating kinase domain interface. Nature. 2007;450:741-U713. doi: 10.1038/nature05998. [DOI] [PMC free article] [PubMed] [Google Scholar]
- 23.Xu G, Abad MC, Connolly PJ, Neeper MP, Struble GT, et al. 4-amino-6-arylamino-pyrimidine-5-carbaldehyde hydrazones as potent ErbB-2/EGFR dual kinase inhibitors. Bioorg Med Chem Lett. 2008;18:4615–4619. doi: 10.1016/j.bmcl.2008.07.020. [DOI] [PubMed] [Google Scholar]
- 24.Xu G, Searle LL, Hughes TV, Beck AK, Connolly PJ, et al. Discovery of novel 4-amino-6-arylaminopyrimidine-5-carbaldehyde oximes as dual inhibitors of EGFR and ErbB-2 protein tyrosine kinases. Bioorg Med Chem Lett. 2008;18:3495–3499. doi: 10.1016/j.bmcl.2008.05.024. [DOI] [PubMed] [Google Scholar]
- 25.Jura N, Endres NF, Engel K, Deindl S, Das R, et al. Mechanism for Activation of the EGF Receptor Catalytic Domain by the Juxtamembrane Segment. Cell. 2009;137:1293–1307. doi: 10.1016/j.cell.2009.04.025. [DOI] [PMC free article] [PubMed] [Google Scholar]
- 26.Fidanze SD, Erickson SA, Wang GT, Mantei R, Clark RF, et al. Imidazo[2,1-b]thiazoles: Multitargeted inhibitors of both the insulin-like growth factor receptor and members of the epidermal growth factor family of receptor tyrosine kinases. Bioorg Med Chem Lett. 2010;20:2452–2455. doi: 10.1016/j.bmcl.2010.03.015. [DOI] [PubMed] [Google Scholar]
- 27.Aertgeerts K, Skene R, Yano J, Sang B-C, Zou H, et al. Structural Analysis of the Mechanism of Inhibition and Allosteric Activation of the Kinase Domain of HER2 Protein. J Biol Chem. 2011;286:18756–18765. doi: 10.1074/jbc.M110.206193. [DOI] [PMC free article] [PubMed] [Google Scholar]
- 28.Sogabe S, Kawakita Y, Igaki S, Iwata H, Miki H, et al. Structure-Based Approach for the Discovery of Pyrrolo[3,2-d]pyrimidine-Based EGFR T790M/L858R Mutant Inhibitors. ACS Med Chem Lett. 2013;4:201–205. doi: 10.1021/ml300327z. [DOI] [PMC free article] [PubMed] [Google Scholar]
- 29.Kawakita Y, Seto M, Ohashi T, Tamura T, Yusa T, et al. Design and synthesis of novel pyrimido 4,5-b azepine derivatives as HER2/EGFR dual inhibitors. Biorg Med Chem. 2013;21:2250–2261. doi: 10.1016/j.bmc.2013.02.014. [DOI] [PubMed] [Google Scholar]
- 30.Peng Y-H, Shiao H-Y, Tu C-H, Liu P-M, Hsu JT-A, et al. Protein Kinase Inhibitor Design by Targeting the Asp-Phe-Gly (DFG) Motif: The Role of the DFG Motif in the Design of Epidermal Growth Factor Receptor Inhibitors. J Med Chem. 2013;56:3889–3903. doi: 10.1021/jm400072p. [DOI] [PubMed] [Google Scholar]
- 31.Ward RA, Anderton MJ, Ashton S, Bethel PA, Box M, et al. Structure- and Reactivity-Based Development of Covalent Inhibitors of the Activating and Gatekeeper Mutant Forms of the Epidermal Growth Factor Receptor (EGFR) J Med Chem. 2013;56:7025–7048. doi: 10.1021/jm400822z. [DOI] [PubMed] [Google Scholar]
- 32.Irwin JJ, Sterling T, Mysinger MM, Bolstad ES, Coleman RG. ZINC: A Free Tool to Discover Chemistry for Biology. J Chem Inf Model. 2012;52:1757–1768. doi: 10.1021/ci3001277. [DOI] [PMC free article] [PubMed] [Google Scholar]
- 33.New York, NY: Schrödinger, LLC; 2014. [Google Scholar]
- 34.R. The R Project for Statistical Computing. ( https://www.r-project.org/). [Google Scholar]
- 35.Duan Y, Wu C, Chowdhury S, Lee MC, Xiong GM, et al. A point-charge force field for molecular mechanics simulations of proteins based on condensed-phase quantum mechanical calculations. J Comput Chem. 2003;24:1999–2012. doi: 10.1002/jcc.10349. [DOI] [PubMed] [Google Scholar]
- 36.Wang JM, Wolf RM, Caldwell JW, Kollman PA, Case DA. Development and testing of a general amber force field. J Comput Chem. 2004;25:1157–1174. doi: 10.1002/jcc.20035. [DOI] [PubMed] [Google Scholar]
- 37.Jorgensen WL, Chandrasekhar J, Madura JD, Impey RW, Klein ML. Comparison of simple potential functions for simulating liquid water. J Chem Phys. 1983;79:926–935. [Google Scholar]
- 38.Salomon-Ferrer R, Götz AW, Poole D, Le Grand S, Walker RC. Routine Microsecond Molecular Dynamics Simulations with AMBER on GPUs. 2. Explicit Solvent Particle Mesh Ewald. J Chem Theory Comput. 2013;9:3878–3888. doi: 10.1021/ct400314y. [DOI] [PubMed] [Google Scholar]
- 39.Case DA, Cheatham TE, Darden T, Gohlke H, Luo R, et al. The Amber biomolecular simulation programs. J Comput Chem. 2005;26:1668–1688. doi: 10.1002/jcc.20290. [DOI] [PMC free article] [PubMed] [Google Scholar]
- 40.Ryckaert JP, Ciccotti G, Berendsen HJC. Numerical-integration of cartesian equations of motion of a system with constraints - molecular-dynamics of n-alkanes. J Comput Phys. 1977;23:327–341. [Google Scholar]
- 41.Essmann U, Perera L, Berkowitz ML, Darden T, Lee H, et al. A smooth particle mesh ewald method. J Chem Phys. 1995;103:8577–8593. [Google Scholar]
- 42.Miller BR, McGee TD, Swails JM, Homeyer N, Gohlke H, et al. MMPBSA.py: An Efficient Program for End-State Free Energy Calculations. J Chem Theory Comput. 2012;8:3314–3321. doi: 10.1021/ct300418h. [DOI] [PubMed] [Google Scholar]
Associated Data
This section collects any data citations, data availability statements, or supplementary materials included in this article.


