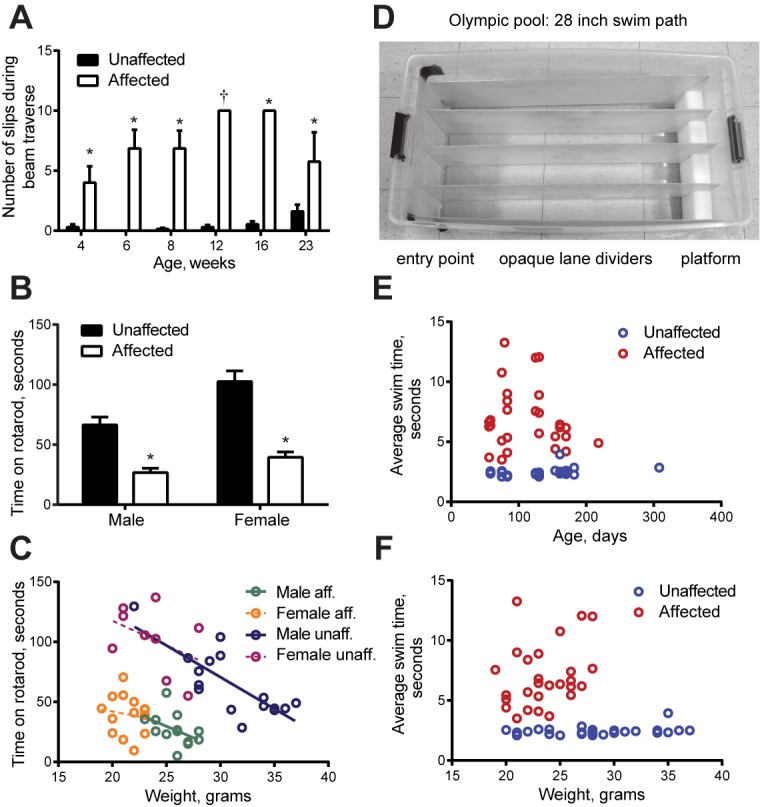
Figure 3. Quantitative measures of impairment.

The mice (all on the C57Bl/6N background) were designated affected and unaffected before discovery of the gene. Bar graphs show mean ± SEM and two-way ANOVA was applied. (A) Crossing an elevated beam to return to the home cage was tested with one cohort repeatedly at the ages shown (n = 14 WT, 10 males, 4 females, and n = 7 lamb1t, 4 males, 3 females). Symptoms normally appeared between 3 and 4 weeks of age. Young mutant mice (1–2 months old) tended to exhibit only slips, while mature mutant mice (3–6 months old) tended to have a mix of foot slips, hyperextension, and full control, and often could not stay on the beam. Traverse time and foot slip data from trials where a mouse fell were not included in the calculations, and the mouse was given another trial. (Numbers completing the task: at 4 weeks, WT 13, mutant 7; 6 and 8 weeks, WT 14, mutant 7; 12 weeks, WT 13, mutant 1; 16 weeks, WT 13, mutant 3; 23 weeks, WT 10, mutant 4.) There was no significant difference between WT and mutant in time to cross at any age (p ranged from 0.28 to 0.76). However, the data showed a significant difference in the number of foot slips during beam traverse. At 4 weeks, p = 0.0021; 6 weeks, p = 3.7 x 10⁻⁶; 8 weeks, p = 3.1 x 10⁻⁶; 12 weeks, n.a.; 16 weeks, p = 3.9x10⁻¹¹; 23 weeks, p = 0.034 for main genotype effect (*), and Bonferroni’s test confirmed significance. At 12 weeks, only one mutant mouse was able to complete the task, and the bar (†) was a single data point. (B) In the accelerating rotarod task, both male and female mutant mice showed substantially shorter latencies to falling off. After 2 days of training, two trials on the third day were averaged (WT, n = 17 male and 9 female mice; mutant, 13 males and 14 females; p = 3.4 x 10⁻⁵ for males and 6.5 x 10⁻⁷ for females, followed by Tukey’s test). In multiple comparisons, all differences were significant except male affected vs. female affected mice. Ages ranged from 60 to 180 days (averages WT 125 days ± 47.5, SD; mutant 114 ± 44.5), and there was no trend with age. (C) Weight gain was initially normal in lamb1t mice, but they plateaued at 3–4 months, likely due to the metabolic demands of elevated muscle activity. Weight as a confounding variable is not often considered in rotarod testing. Plotting the rotarod data against weight showed it to be a continuous independent variable in WT males (linear regression for WT males had a significant slope [R square = 0.6299, F = 24.99, p = 0.0002]; slopes in the other groups tested non-significant). However, the main effect of genotype dominated the results even though male lamb1t mice weighed less. (D) The Olympic pool (empty). Mice swam down a lane to a submerged platform. (E) Swimming speed results as a function of age, and (F) as a function of weight. Each symbol is the average of two trials for one mouse. There was little overlap between genotypes, and no significant deterioration with age or weight was found by linear regression. SD, standard deviation; SEM, standard error of the mean; WT, wild type.
