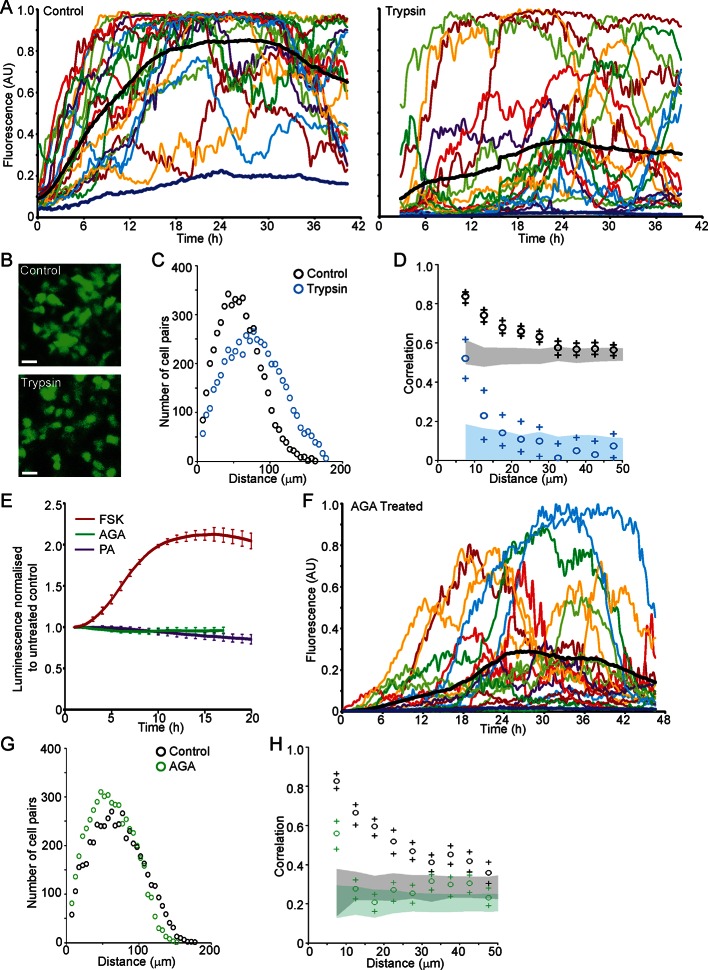
Figure 8. Cell communication influences the spatial organisation of prolactin transcription dynamics.
(A) Comparison of fluorescence profiles of hPRL-d2EGFP reporter gene activity from individual cells in control and trypsin-treated tissue. Cells in trypsin-treated tissue appeared less synchronised over time, but still showed an overall rise in activity as shown by the mean activity (black). The level of background fluorescence is shown in dark blue (mean from five areas). (B–D) Spatial correlation between fluorescence profiles of hPRL transcription activity is reduced in trypsin-treated tissue. (B) Images of cells within control and trypsin-treated tissue show that the distribution of cells and contacts between d2EGFP-expressing cells appeared altered following trypsin treatment. Bar represents 100 µm. (C) The intercellular distance between cells from control and trypsin-treated tissue was calculated as the median distance over the fluorescence imaging time-course (shown in A). (D) Correlation vs distance analyses showed a reduction in the difference between non-randomised and randomised data in trypsin-treated tissue compared to control, indicating a reduction in the spatial influence on transcription. (E–H) Inhibitors of gap junction signalling were used to assess whether juxtacrine signalling is influential in coordinating PRL transcription activity. (E) Real-time luminescence activity from populations of cells in primary cultures show that gap junction inhibitors (18α-glycyrrhetinic acid, AGA, and palmitoleic acid, PA) had little effect on overall PRL gene expression. Forskolin (FSK) was used as a positive control. (F) Fluorescence profiles of single cells in AGA treated tissue. Data are represented as described in (A). Transcription activity increased during the time-course (mean activity, black), similarly to control tissue (A). (G) The intercellular distance between cells from control and AGA-treated tissue was calculated as the median distance over the fluorescence imaging time-course (shown in A,F). (H) Correlation vs distance analyses showed a reduction in the difference between non-randomised and randomised fluorescence profiles in AGA treated tissue compared to control tissue indicating a reduction in the spatial coordination of transcription. Correlation vs distance plots are shown as described in Figure 3B.


