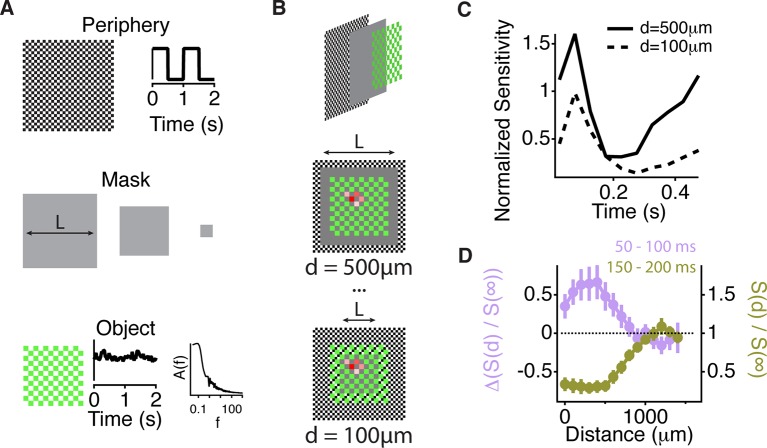
Figure 6. Similar spatial scale for peripheral excitation and inhibition.
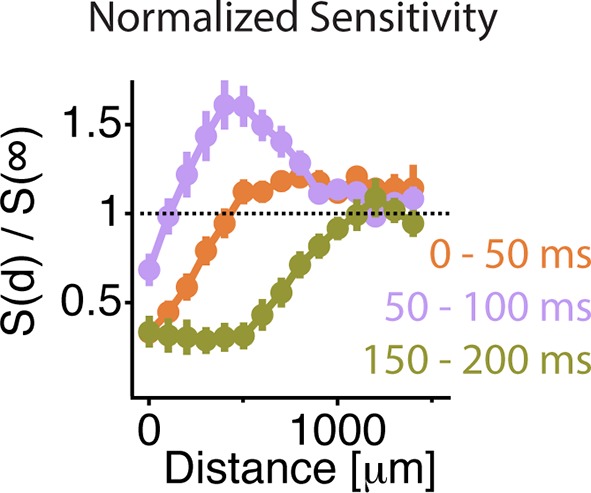
(A) Experimental design for measuring the spatial scale of peripheral excitation and inhibition (see Materials and methods). (Top) The periphery was a checkerboard pattern with squares of 50 μm covering all the screen that reversed in intensity at 1 Hz. (Middle) A gray mask with no temporal component and variable size, L, was drawn on top of the checkers. (Bottom) The object was a checkered pattern with a square size of 100 μm (shown in green for illustration). Object squares in the center flickered with a pink noise distribution, with an equivalent contrast of 10% , changing every 30 ms. (B) Top, schematic of how the different components of the stimulus were layered. Middle and Bottom, a sample cell’s spatial receptive field for the object stimulus is shown in red with the color representing sensitivity to that particular square of the object for two different sizes of the intermediate mask. With this design, the object does not change across the different conditions and any change in the sensitivity to the object is due to the distance of the peripheral checkers. (C) Average over cells (n = 66) of the normalized sensitivity to the object stimulus, which was computed as the average slope of the nonlinearity of a linear-nonlinear model normalized by the average slope of the nonlinearity when the background was at infinity, as a function of time bin t, relative to the background shift for two different mask sizes. (D) Average of the normalized sensitivity as in panel (C) as a function of distance between the cell and the mask during the gating window (50–100 ms after the shift) and an inhibitory window (150–200 ms after the shift). Each point in a line corresponds to the minimum distance between the cell’s linear receptive field and the background checkers for a particular background condition mask L. For the gating window, the baseline of sensitivity at 0–50 ms, which is too soon after the shift to be affected by it, was subtracted for each distance d. This subtraction was not done for the recovery window because at distances less than 500 µm, residual inhibition creates a saturating decrease in sensitivity, causing many cells to have zero slope at this time. See Figure 6—Figure supplement 1 for sensitivity before the subtraction of this baseline.
Figure 6—figure supplement 1. Similar spatial scale for peripheral excitation and inhibition.


