

Abstract
Objective
Dexamethasone is known to support mesenchymal stem cell (MSC) chondrogenesis, although the effects of dose and timing of exposure are not well understood. The objective of this study was to investigate these variables using a laboratory model of MSC chondrogenesis.
Design
Equine MSCs were encapsulated in agarose and cultured in chondrogenic medium with 1 or 100 nM dexamethasone, or without dexamethasone, for 15 days. Samples were analyzed for extracellular matrix (ECM) accumulation, prostaglandin E2 and alkaline phosphatase secretion, and gene expression of selected collagens and catabolic enzymes. Timing of exposure was evaluated by ECM accumulation after dexamethasone was withdrawn over the first 6 days, or withheld for up to 3 or 6 days of culture.
Results
ECM accumulation was not significantly different between 1 and 100 nM dexamethasone, but was suppressed ~40% in dexamethasone-free cultures. Prostaglandin E2 secretion, and expression of catabolic enzymes, including matrix metalloproteinase 13, and type X collagen was generally lowest in 100 nM dexamethasone and not significantly different between 1 nM and dexamethasone-free cultures. Dexamethasone could be withheld for at least 2 days without affecting ECM accumulation, while withdrawal studies suggested that dexamethasone supports ECM accumulation beyond day 6.
Conclusion
One nanomolar dexamethasone supported robust cartilage-like ECM accumulation despite not having an effect on markers of inflammation, although higher concentrations of dexamethasone may be necessary to suppress undesirable hypertrophic differentiation. While early exposure to dexamethasone was not critical, sustained exposure of at least a week appears to be necessary to maximize ECM accumulation.
Keywords: chondrogenesis, mesenchymal stem cell, dexamethasone, extracellular matrix
Introduction
The ability to undergo chondrogenesis is a hallmark of bone marrow mesenchymal stem cells (MSCs),1 which has generated significant enthusiasm that they may be capable of repairing articular cartilage defects. MSCs possess favorable properties for cartilage tissue engineering as they can be readily culture-expanded, and secrete robust quantities of cartilage-like extracellular matrix (ECM) after seeding into scaffolds and culture in the appropriate biochemical environment in vitro. Animal testing of MSC grafts has demonstrated promise for regenerating cartilage, although recent studies have shown that the cartilage repair can be improved if chondrogenic factors are delivered in MSC-seeded scaffolds.2-4 These data suggest that supplementing the joint environment with chondrogenic factors may be an important aspect of successful cartilage repair by MSCs.
For many years, the combination of selected growth factors and the glucocorticoid dexamethasone (Dex) has been used to induce robust MSC chondrogenesis in vitro. When translating these findings to animal studies, the delivery of growth factors has been prioritized, as chondrogenic growth factors are essential to stimulate MSC chondrogenesis in vitro.5 However, laboratory studies have shown that Dex can significantly enhance growth factor–induced chondrogenesis by supporting ECM accumulation,6-8 and suppressing catabolism.8 Furthermore, Dex has shown promise for supporting growth factor–mediated MSC chondrogenesis after subcutaneous implantation.9,10 These data suggest that in vivo delivery of Dex may significantly improve MSC cartilage repair.
Effective strategies for delivering chondrogenic factors to support MSC chondrogenesis in vivo should sustain at least a minimum concentration over a critical period of time. While in vitro studies have provided guidelines for dosing and temporal exposure of chondrogenic growth factors for MSCs,11-14 similar information has not been established for Dex. Therefore, the objective of this study was to investigate the effects of dose and temporal exposure of Dex on MSC chondrogenesis in vitro. We evaluated chondrogenesis of adult equine bone marrow MSCs encapsulated in agarose hydrogel, a model scaffold for studying the biology of bone marrow MSC chondrogenesis in which withholding Dex has been shown to have a negative effect on chondrogenesis.6,8 Chondrogenesis was evaluated using quantitative measures of ECM accumulation, histology, semiquantitative gene expression of selected collagens, and alkaline phosphatase. In addition, given that Dex is a potent anti-inflammatory agent, we evaluated prostaglandin E2 (PGE2) secretion and gene expression of selected catabolic enzymes associated with cartilage degradation as an indicator of whether the effects of Dex on MSC chondrogenesis were associated with modulation of inflammation.
Methods
Mesenchymal Stem Cells Isolation and Expansion
Mesenchymal stem cells were isolated from bone marrow aspirates from the iliac crest of 2- to 5-year-old horses that were euthanized for reasons unrelated to this study. Colony-forming cultures were established to isolate the MSCs from the bone marrow,15 after which the MSCs were seeded at 2 × 10³ cells/cm2 in tissue culture flasks in α-minimal essential medium, 10% fetal bovine serum, and 2 ng/mL fibroblast growth factor-basic (Peprotech, Rocky Hill, NJ) and cultured to 80% confluence over 4 days. The cells were expanded through a second passage prior to seeding in chondrogenic culture.
Agarose Encapsulation and Chondrogenic Culture
Culture-expanded MSCs were encapsulated in 2% (w/v) agarose gel at 12 × 106 cells/mL, as previously described.15 Baseline chondrogenic medium consisted of high-glucose Dulbecco modified Eagle medium supplement with 1% ITS+ Premix (BD Biosciences, Bedford, MA), 37.5 μg/mL ascorbate-2-phosphate (Wako Chemicals, Richmond, VA), 5 ng/mL recombinant human transforming growth factor-β1 (Peprotech, Rocky Hill, NJ).5 Cultures were maintained in 1 or 100 nM Dex (Sigma-Aldrich, Saint Louis, MO), or in Dex-free medium, for 15 or 21 days. Culture medium was changed every third day.
Quantification of Extracellular Matrix Accumulation and DNA
Following chondrogenic culture, MSCs-seeded agarose samples were weighed, and then digested in proteinase K (Sigma-Aldrich, Saint Louis, MO) in Tris–HCl solution at 60°C overnight. DNA was quantified following digestion using the Hoechst dye assay.16 Total accumulated sulfated glycosaminoglycan (GAG) and hydroxyproline were quantified by dimethylmethylene blue17 and dimethylamino benzaldehyde dye18 binding assays, respectively. ECM accumulation data were normalized to the sample wet weight or DNA.
Immunohistochemistry and Histology
Samples from 15 days culture were fixed in 10% formalin for 48 hours, paraffin-embedded, sectioned, and mounted on slides. Sections were deparaffinized and rehydrated prior to staining.
Type II Collagen Immunohistochemical Staining
Samples were incubated with proteinase K (Sigma-Aldrich, Saint Louis, MO) at 37°C for 15 minutes, and then mouse anti-collagen type II IgG primary antibody using undiluted supernatant (Hybridoma Bank, Iowa City, IA) followed by donkey anti-mouse IgG secondary antibody conjugated with peroxidase at a 1:500 dilution (Jackson Immunoresearch, West Grove, PA). Antibody detection was performed using VECTOR NovaRED (Vector laboratories, Burlingame, CA). Additional sections were incubated with normal mouse serum at equal concentration to that of the primary antibody as a negative control. Equine cartilage was analyzed in parallel as a control.
Toluidine Blue
Sections were stained with 0.04% toluidine blue solution (Electron Microscopy Sciences, Fort Washington, PA) to detect the accumulation of sulfated pro-teoglycans.
Prostaglandin E2 Levels
Medium from chondrogenic cultures was collected on days 1, 3, 6, 9, 12, 15, 18, and 21, stored at −20°C, and then analyzed for PGE2 concentration using a commercially available enzyme-linked immunosorbent assay kit (Enzo Life Sciences, Farmingdale, NY). PGE2 secretion was normalized to the sample wet weight or DNA.
Alkaline Phosphatase
Medium from chondrogenic cultures was evaluated for alkaline phosphatase activity. Media samples were incubated with SIGMAFAST p-nitrophenyl phosphate substrate solution (Sigma-Aldrich, Saint Louis, MO) at 37°C for 30 minutes, diluted with 3 N NaOH to stop the reaction, and then read spectrophotometrically at 405 nm. Standard curves were created using p-nitrophenol (p-NP, Sigma-Aldrich, Saint Louis, MO). Using this protocol, absorbance values for medium samples coincided with 20 to 100 µM of the p-NP standards. Alkaline phosphatase activity was normalized to sample wet weight or DNA.
RNA Extraction and Real-Time PCR
Mesenchymal stem cells–seeded agarose samples were collected on days 3, 6, 9, and 15 in TRIzol reagent (Life Technologies, Grand Island, NY) and stored in −80°C. Samples were removed from TRIzol, frozen in liquid nitrogen, and pulverized. TRIzol was first added to the pulverized samples, followed by chloroform at a ratio of 1:5 to the TRIzol. Samples were centrifuged at 12,000g at 4°C for 15 minutes, and RNA was extracted from the aqueous phase using the RNeasy Mini Kit (Qiagen, Valencia, CA) according to the manufacturer’s instructions with on-column genomic DNase (Qiagen, Valencia, CA). mRNA was reverse transcribed into cDNA using superscript III first-strand synthesis superMix for qRT-PCR (Life Technologies, Grand Island, NY), and evaluated for types I, II, and X collagen, A disintegrin and metalloproteinase with thrombospondin motifs 4 and 5 (ADAMTS4 and 5), and matrix metalloproteinase 1 and 13 (MMP1 and 13) expression using the ABI Prism 7000 Sequence Detection System (Applied Biosystems, Foster City, CA). Relative gene expression levels were determined by semiquantitative real-time polymerase chain reaction (PCR) using TaqMan-based probes and primers for all genes except type X collagen, which was analyzed using primers and Sybr Green (Table 1). Glyceraldehyde 3-phosphate dehydrogenase (GAPDH) was used as the housekeeping gene.
Table 1.
Primer and Probe Sequences.
| Gene | Primers | Probe |
|---|---|---|
| Col1 | F: ATTTCCGTGCCTGGCCCCATG R: GCCTTGGAAACCTTGGGGAC |
TCCTTCTGGTCCTCGTGGTCTCCCTGG |
| Col2 | F: AAACCATCAACGGTGGCTTCCA R: GCAATGCTGTTCTTGCAGTGGT |
AGATGACAACCTGGCTCCCAACACTGCCAA |
| Col10 | F: AGGCAACAGCATTACGACCCAAGA R: TGAAGCCTGATCCAGGTAGCCTTTG |
— |
| ADAMTS4 | F: TGTGATCGTGTCATTGGCTCC R: TGTTTGCTGCAGCTAGAACCATC |
AGTTTGACAAGTGCATGGTGTGCGGT |
| ADAMTS5 | F: AAGGTGACTGATGGGACCGAATGT R: TTTGAGCCAATGATGCCGTCACAG |
AGGCCATACAGTAATTCCGTCTGCGT |
| MMP1 | F: ACTGCCAAATGGACTTCAAGCTGC R: TCTTCACAGTGCTAGGAAAGCCG |
CAGGATGTGCTCTACGGATACCCCAAGGAC |
| MMP13 | F: TGATGAAACTTGGACAAGCAGTTCC R: CCTTGGAGTGGTCGAGACCTAAG |
AGGCTACAACTTGTTTCTTGTCGCTGCACAC |
Experimental Design
The effects of Dex concentration on MSC chondrogenesis was evaluated by culturing samples in chondrogenic medium containing a maximum of 100 nM Dex,5 which is the most commonly used concentration for supporting bone marrow MSC chondrogenesis. From 100 nM, we evaluated the effect of reducing the concentration of Dex by comparing to 1 nM Dex or Dex-free culture. Extracellular matrix accumulation was evaluated after 15 days of culture, while PGE2 secretion was quantified for up to 21 days of culture. The contribution of cyclooxygenase-2 (COX-2) to PGE2 secretion and chondrogenesis was evaluated using celecoxib (Sigma-Aldrich, Saint Louis, MO), a nonsteroidal anti-inflammatory drug that selectively inhibits COX-2.19 Experiments evaluating the effects of timing of administration of Dex were performed using 1 or 100 nM Dex. The effects of Dex withdrawal were evaluated by removing Dex from the culture medium after 1, 3, or 6 days of a 15-day culture period. For the Dex withholding study, 1 nM Dex was added to the culture medium after 1, 2, or 3 days, or 100 nM Dex was added to the culture medium after 3, 4, 5, or 6 days of a 15-day culture period.
Statistical Analysis
Data were analyzed for analysis of variance with mixed model using animal as a random effect. Pairwise comparisons were analyzed using least squares means with Tukey-Kramer adjustment. P < 0.05 was considered statistically significant difference. Statistical test were performed using SAS 9.3 software.
Results
Preliminary Studies
Two experiments were conducted with a small sample size and limited analysis to serve as a basis for designing the primary experiments in this study. First, we evaluated the effect of decreasing 100 nM Dex over several orders of magnitude. When normalized to wet weight, GAG accumulation in 100 nM Dex was not significantly different from 10, 1, or, 0.1 nM Dex (P = 0.09-1), although in 0.1 nM mean GAG accumulation was approximately 25% lower than 1 to 100 nM Dex (data not shown). In Dex-free culture, GAG accumulation was significantly lower than 100, 10, and 1 nM, but not 0.1 nM Dex (P = 0.09). DNA per wet weight was not significantly different among all Dex conditions (P = 0.32-1), and the statistical outcome of GAG accumulation normalized to DNA was not different than wet weight. Given that 1 nM Dex appeared to be the lowest concentration that supported chondrogenesis in the same manner as 100 nM, more comprehensive experiments were conducted for 0, 1, or 100 nM Dex. Next, GAG accumulation as a function of time was evaluated for 0, 1, and 100 nM Dex (data not shown). All cultures showed minimal GAG accumulation on day 3 (~0.1 µg GAG/mg wet weight). On day 7, GAG accumulation was approximately 20% of that on day 15. On days 7 and 15, GAG accumulation in Dex-free cultures was approximately 48% of those in 1 and 100 nM Dex, which were not significantly different (P = 1). Given that Dex does not appear to greatly affect the rate at which GAG accumulates with time in chondrogenic culture, subsequent experiments evaluated ECM accumulation on day 15 only.
Dexamethasone Titration
Comparisons among 0, 1, and 100 nM Dex were conducted using MSC from 8 horses, with ECM accumulation and histology analyzed after 15 days of culture.
ECM accumulation
When normalized to wet weight, GAG (P = 0.77) and hydroxyproline (P = 0.23) accumulations were not significantly different between 1 nM and 100 nM Dex (Fig. 1A). Compared with 1 and 100 nM Dex, GAG accumulation and hydroxyproline accumulation were approximately 36% and 31% lower in Dex-free cultures, respectively. DNA normalized to wet weight in Dex-free culture was approximately 16% lower than 1 or 100 nM Dex cultures (data not shown). ECM accumulation normalized to DNA (Fig. 1B) showed similar statistical results as when normalized to wet weight of samples. Next, the influence of Dex across individual donors was evaluated in a pairwise manner by normalizing GAG and hydroxyproline accumulation in Dex-free to 100 nM Dex cultures for 13 donor horses. GAG accumulation was relatively variable across donors as withholding Dex suppressed GAG accumulation by less than 20% for 4 horses, while for 7 horses GAG accumulation in Dex-free cultures was suppressed by at least 60% compared with 100 nM Dex (Fig. 2). Hydroxyproline accumulation in Dex-free cultures was less variable, ranging from 40% to 80% of that in 100 nM cultures (data not shown).
Figure 1.

Glycosaminoglycan (GAG) and hydroxyproline (Hypro) accumulation after 15 days of culture in chondrogenic medium containing 100, 1, or 0 nM dexamethasone (Dex). (A) GAG and hydroxyproline normalized to wet weight of samples. (B) GAG and hydroxyproline normalized to DNA. Data are mean ± standard error of the mean (SEM), n = 8 donor animals. The statistical analysis compared GAG or hydroxyproline accumulation among Dex concentrations, with different letters denote significant difference (P < 0.05) for each assay.
Figure 2.
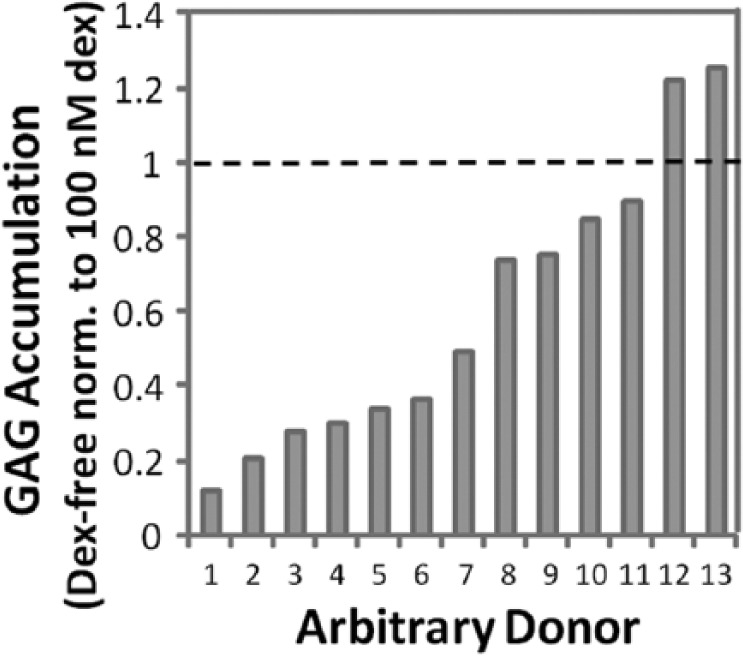
Glycosaminoglycan (GAG) accumulation normalized to wet weight from 13 horses after 15 days of culture without dexamethasone (Dex) or with 100 nM Dex. Data from cultures without Dex were normalized to 100 nM Dex for each individual horse.
Histology
Type II collagen (Fig. 3A) and toluidine blue staining (Fig. 3B) was present in all conditions from 15-day culture samples. Grossly, the distribution of both stains appeared similar between 1 and 100 nM Dex, with the most prominent staining in pericellular spaces. Staining in Dex-free cultures was largely localized to pericellular spaces. In Figure 3B, toluidine blue staining for Dex-free samples for which GAG accumulation was relatively high (1.29 μg/mg wet weight, Fig. 3B-i) or low (0.27 μg/mg wet weight, Fig. 3B-ii) are presented. Decreasing GAG accumulation in Dex-free cultures was associated with fewer cells that were surrounded by robust pericellular toluidine blue staining.
Figure 3.

Representative staining of mesenchymal stem cells (MSCs) encapsulated in agarose gel cultured in 100, 1, and 0 nM dexamethasone (Dex) after 15 days of culture. (A) Type II collagen immunohistochemistry and (B) toluidine blue staining. In B, representative sections for Dex-free cultures that accumulated a relative high (i) or low (ii) amount of glycosaminoglycan (GAG) are presented. Controls were performed on equine cartilage. Bar = 100 μm.
Gene Expression
Gene expression was evaluated for MSCs from 5 horses after 3, 6, 9, and 15 days of culture (Fig. 4A-G). In Figure 4A, expressions of each gene in 100 nM Dex culture were normalized to mean expression of day 3 and in Figure 4B-G, expressions in Dex-free and 1 nM Dex cultures were normalized to 100 nM Dex at each time point.
Figure 4.

Gene expression from days 3, 6, 9, and 15 of cultures. (A) Gene expression over time in chondrogenic culture containing 100 nM dexamethasone (Dex), (B) type II collagen, (C) type I collagen, (D) type X collagen, (E) MMP13, (F) ADAMTS4, (G) ADAMTS5. Expression was normalized to GAPDH, then (A) to the mean values of expression on day 3 of each gene and (B-G) to the mean values in 100 nM Dex for each time point. Data are mean ± standard error of the mean (SEM), n = 5 donor animals. (A) The statistical analysis comparing the expression of each gene over time is presented in the text. (B-G) The statistical analysis compared expression among Dex concentrations at each time point, with different letters denoting significant difference (P < 0.05).
Collagen
Type II and I Collagen
In 100 nM Dex (Fig. 4A), type II collagen expression increased with time in culture, with an overall 52-fold upregulation between days 3 and 15. Type I collagen expression in 100 nM Dex did not change with time in culture between days 3 and 9 (P = 0.58), but on day 15 decreased 2.5-fold relative to day 3. These temporal patterns are consistent with previous reports of collagen gene expression over time during MSC chondrogenesis.20 When considering relative expression among conditions at each time point, type II collagen expression (Fig. 4B) was not significantly different between 100 and 1 nM Dex, while expression in Dex-free cultures was significantly less than 1 or 100 nM Dex (7-fold) on day 3 only. Type I collagen expression (Fig. 4C) did not differ between 100 and 1 nM Dex cultures, while expression in Dex-free cultures was significantly higher than 100 nM Dex (5-fold) on day 15 only.
Type X Collagen
In 100 nM Dex (Fig. 4A), type X expression increased 13.9-fold between days 3 and 6 but was not significantly different for the rest of the time course. The temporal pattern of increasing type X collagen expression with time in culture was consistent with previous reports for human MSCs in pellet culture.20 When considering relative expression among conditions at each time point (Fig. 4D), Dex-free and 1 nM Dex cultures were not significantly different from 100 nM through 9 days of culture, although on day 6 type X collagen expression in 1 nM Dex was 16.6-fold higher than Dex-free cultures. On day 15, type X collagen expression in Dex-free and 1 nM Dex cultures was 9.9- and 24-fold, respectively, higher than 100 nM Dex.
Matrix Metalloproteinase
In 100 nM Dex (Fig. 4A), MMP13 expression did not change with time in culture (P = 0.07-0.95). At each time point, MMP13 was not significantly different between Dex-free and 1 nM Dex cultures (Fig. 4E). On days 3 and 6, MMP13 expression in Dex-free or 1 nM Dex cultures was 47- and 24-fold, respectively, higher than 100 nM Dex cultures. On day 15, MMP13 expression in Dex-free and 1 nM Dex cultures was approximately 15-fold higher than 100 nM Dex cultures. Across all conditions, MMP1 expression was consistently within the detection limit of the assay on day 3 only. On day 3, the only significant difference was a 56-fold increase in Dex-free culture relative to 100 nM Dex (data not shown).
A Disintegrin and Metalloproteinase with Thrombospondin Motifs
In 100 nM Dex (Fig. 4A), ADAMTS4 expression decrease with time in culture with an overall 4.5-fold down-regulation between days 3 and 15, while ADAMTS5 expression did not change with time in culture (P = 0.06). At each time point, ADAMTS4 and 5 expression was not significantly different between 1 and 100 nM Dex cultures (P = 0.28-0.96, Fig. 4F and G) except on day 3 for ADAMTS4 (2.5-fold). Aggrecanase expression in Dex-free culture was not significantly different from that in 100 nM except for ADAMTS4 on day 3 (3-fold higher), and ADAMTS5 on day 6 (3.8-fold higher).
Alkaline Phosphatase
Alkaline phosphatase activity was evaluated for MSCs from 5 horses. Culture media was analyzed on days 3, 6, 9, and 15, and in Figure 5 the results were normalized to the wet weight of the samples. In 100 nM Dex, alkaline phosphatase activity increase for 1.7-fold between day 3 and day 6, and did not change with time for the remainder of the culture period (P = 0.68-0.98, Fig. 5A). On days 3 and 6, alkaline phosphatase activity in Dex-free and 1 nM Dex was approximately 37% and 60% of those in 100 nM Dex, respectively (Fig. 5B). On day 9 (P = 0.35) and day 15 (P = 0.68), alkaline phosphatase activity in 1 nM Dex was not significantly different from 100 nM Dex culture, while Dex-free culture was approximately 38% of that in 100 nM Dex cultures. Alkaline phosphatase activity normalized to DNA showed similar statistical outcomes as when normalized to wet weight (data not shown).
Figure 5.

Alkaline phosphatase activity. (A) Alkaline phosphatase activity in chondrogenic culture containing 100 nM dexamethasone (Dex) after day 3, 6, 9, and 15 of culture. (B) Alkaline phosphatase activity in Dex-free or 1 nM Dex relative to 100 nM Dex. Data were normalized to mean values in 100 nM Dex at each time point. Data are mean ± standard error of the mean (SEM), n = 5 donor animals. The statistical analysis compared activity among Dex concentrations at each time point, with different letters denoting significant difference (P < 0.05).
Prostaglandin E2
Prostaglandin E2 secreted into the culture medium was quantified between 1 and 21 days of culture for MSCs from 6 horses. In Figure 6, the rate of PGE2 secretion was calculated by dividing the total amount of PGE2 in the medium by the time elapsed since the previous medium change, which was 3 days for all time points except for day 1. The rate of PGE2 secretion was normalized to the wet weight of the sample. In 100 nM Dex (Fig. 6A) the rate of PGE2 accumulation in the medium was initially low, then increased more than 200-fold by days 3 and 6 of culture. Between days 6 and 9, the rate of PGE2 secretion decreased approximately 30-fold, and did not significantly change for the remainder of the timecourse (P = 0.86-1). On day 1, PGE2 secretion was significantly different among all conditions (Fig. 6B), with the highest level in Dex-free culture, 122- and 3.5-fold higher than 100 nM and 1 nM Dex, respectively. At subsequent time points, PGE2 secretion was not significantly different between Dex-free and 1 nM Dex cultures (P = 0.07-0.85). Between days 3 and 21 of culture, PGE2 secretion in 100 nM Dex was 7- to 63-fold lower than Dex-free or 1 nM Dex cultures. PGE2 secretion normalized to DNA showed similar statistical outcomes as when normalized to wet weight (data not shown).
Figure 6.

Prostaglandin E2 (PGE2) secretion. (A) PGE2 secretion over time in chondrogenic culture containing 100 nM dexamethasone (Dex). (B) PGE2 secretion in Dex-free or 1 nM Dex relative to 100 nM Dex. Data were normalized to mean values in 100 nM Dex at each time point. Data are mean ± standard error of the mean (SEM), n = 6 donor animals. The statistical analysis compared PGE2 levels among Dex concentrations at each time point, with different letters denoting significant difference (P < 0.05). p-NP: p-nitrophenol.
Extracellular matrix accumulation normalized to sample wet weight on day 21 resembled that of Figure 1 as GAG (P = 0.09) and hydroxyproline (P = 0.71) accumulations were not significantly different between 1 and 100 nM (data not shown), while GAG and hydroxyproline accumulations in Dex-free culture were 82% and 60% lower than those in 1 nM and 100 nM Dex culture, respectively.
Celecoxib
Celecoxib was evaluated at a concentration of 10 μM, with a final dimethyl sulfoxide (DMSO) concentration of 0.025%, for MSCs from 3 horses. Control cultures were supplemented with 0.025% DMSO. All cultures were maintained in 1 nM Dex. When normalized to wet weight, GAG accumulation in celecoxib cultures (2.24 μg/mg wet weight) was not significantly different from controls (2.04 μg/mg wet weight, P = 0.36) (Fig. 7A). Hydroxyproline accumulation in celecoxib cultures (0.18 μg/mg wet weight) was not significantly different from controls (0.15 μg/mg wet weight, P = 0.6). In control cultures, the rate of PGE2 secretion on days 3 and 6 was 1448 and 463 pg/day/mg wet weight, respectively (Fig. 7B), which was at least 500-fold higher than that in celecoxib cultures (0.58 and 0.89 pg/day/mg wet weight, respectively). Data normalizing to DNA showed similar statistical outcomes as normalizing to wet weight (data not shown).
Figure 7.

Extracellular matrix (ECM) accumulation and prostaglandin E2 (PGE2) secretion in the presence of 10 µM celecoxib. (A) Glycosaminoglycan (GAG) and hydroxyproline (Hypro) accumulation after 15 days of culture. (B) PGE2 secretion on days 3 and 6 of chondrogenic culture. Data are mean ± standard error of the mean (SEM), n = 3 donor animals. The statistical analysis compared (A) GAG or hydroxyproline accumulations and (B) control to celecoxib treatment. Different letters denote significant difference, P < 0.05.
Timing of Dex Exposure
The effects of withdrawing Dex from chondrogenic culture over time, or temporarily withholding Dex from the start of chondrogenic culture, were tested using a Dex concentration of 1 or 100 nM over 15-day culture period. In both experiments, control cultures were maintained in the presence or absence of Dex for 15 days. ECM accumulation in control cultures were consistent with Figure 1 as GAG and hydroxyproline in 1 and 100 nM Dex was higher than in Dex-free cultures (Fig. 8A-C). In Figure 8, data were normalized to sample wet weight, which resulted in comparable statistical outcomes when normalized to DNA.
Figure 8.

Glycosaminoglycan (GAG) and hydroxyproline (Hypro) accumulation after 15 days of culture with withdrawing or withholding dexamethasone (Dex) during chondrogenic culture. (A) Extracellular matrix accumulation after withdrawing 1 nM Dex over the first 6 days of culture (n = 7 donor animals). (B) Extracellular matrix accumulation after withholding 1 nM Dex for up to the first 3 days of culture (n = 5 donor animals). (C) Extracellular matrix accumulation after withholding 100 nM Dex for the first 3 to 6 days of culture (n = 3 donor animals). Samples were analyzed after 15 day of culture. Data are mean ± standard error of the mean (SEM). The statistical analysis compared GAG or Hypro accumulation among the different conditions, with different letters denoting significant difference (P < 0.05) for each assay.
Dex Withdrawal
Dex was withdrawn after 1, 3, or 6 days of 15-day culture period. In 1 nM Dex culture, withdrawing Dex after 1 and 3 days resulted in approximately 70% and 51% in GAG and hydroxyproline accumulation relative to controls that received Dex for 15 days (Fig. 8A, n = 7). Withdrawing Dex after 6 days of exposure resulted in a significant decrease in hydroxyproline, but not GAG (P = 0.42), relative to controls that received Dex for 15 days. In 100 nM Dex culture (n = 3), withdrawing Dex after 1 and 3 days resulted in GAG accumulation that was approximately 78% of controls that received Dex for 15 days. Hydroxyproline accumulation was not significantly different beween conditions (P = 0.68), although high animal-to-animal variability was noted in these samples (data not shown).
Dex Withholding
In medium containing 1 nM Dex, withholding Dex for up to 3 days did not significantly suppress GAG accumulation relative to the Dex control culture (P = 0.19-1, Fig. 8B, n = 5). Withholding Dex for 3 days was necessary to significantly reduce the accumulation of hydroxyproline relative to Dex controls. Next, for 100 nM cultures Dex was withheld for 3, 4, 5, or 6 days. Withholding 100 nM Dex for 5 days was necessary to significant reduce the accumulation of GAG. (Fig. 8C, n = 3). Hydroxyproline accumulation was not significantly different among conditions (P = 0.17), although high animal-to-animal variability was noted in these samples.
Histology
For both experiments, staining for type II collagen and toluidine blue was present in all conditions, with ECM accumulating largely in pericellular spaces as in Figure 3A and B (data not shown).
Discussion
Withholding Dex from chondrogenic cultures of adult equine MSCs resulted in a decrease in ECM accumulation of ~40% compared with 100 nM Dex, which was consistent with previous studies involving chondrogenesis of bovine MSCs,6-8 human bone marrow MSCs in pellet culture,5 and human adipose-derived stromal cells cultured in alginate hydrogel.21 Furthermore, the modest increase in type I collagen expression in Dex-free samples on day 15 may suggest greater fibrocartilage-like differentiation in the absence of Dex with time in chondrogenic culture. The effects of withhold Dex was variable across donors in that MSCs from certain donors were minimally affected, while others accumulated only modest amounts of GAG in the absence of Dex. Donor-to-donor variability may be a concern for autologous human therapies as chondrogenesis has been shown to vary greatly among donors in vitro in chondrogenic medium containing 100 nM Dex.22 As a secondary factor, our data suggests that additional variability may be encountered if Dex is not included in the development of MSC-based cartilage repair therapies.
Suppression of ECM accumulation in Dex-free culture was reversed with 1 nM Dex. Furthermore, measures of cartilage-like phenotypic expression were not significantly different between 1 and 100 nM Dex as both cultures showed robust staining for type II collagen and toluidine blue, while gene expression of type I and II collagen were not significantly different. These data indicate that Dex concentrations may be reduced 100-fold from the conventional laboratory dose of 100 nM while still supporting robust MSC chondrogenesis, which is consistent with reports that Dex concentrations less than 100 nM stimulated robust chondrogenesis in multipotent rat calvaria cells,23 and sox-9 expression in chondrocytes.24
While Dex-free culture resulted in moderate suppression of ECM accumulation, collagen gene expression did not convincingly differentiate between Dex and Dex-free cultures as type II collagen expression in Dex-free culture was significantly different than 1 or 100 nM Dex on day 3 only. While these data may indicate that Dex enhances the rate of differentiation during early chondrogenesis, it is not known whether a lag in type II collagen expression during a period of low ECM synthesis20 is sufficient to account for the large discrepancies in ECM accumulation between Dex and Dex-free conditions after 15 days of culture. Furthermore, given that gene expression does not necessarily translate to protein synthesis, as documented for aggrecan during MSC chondrogenesis,15,25 it is possible that posttranslational regulation of ECM synthesis may account for the relative low accumulation of GAG and hydroxyproline in the absence of Dex.
A second possibility is that Dex acts to support ECM accumulation through potent anti-inflammatory properties that suppress catabolism in chondrogenic culture. This concept is supported by studies reporting increased aggrecanase activity when Dex was withheld in chondrogenic bovine MSC cultures,8 and MMP cleavage of aggrecan in human MSC cultures maintained in chondrogenic medium containing 100 nM Dex.7 When considering gene expression of catabolic enzymes, decreasing or withholding Dex resulted in modest (ADAMTS4) or moderate (MMP13, MMP1) upregulation of gene expression at early timepoints, and moderate upregulation of MMP13 on day 15, although minimal differences between 1 nM Dex and Dex-free cultures on day 3 does not strongly support the differences in ECM accumulation between these 2 groups. As a second measure of inflammation, we measured PGE2 secretion, which when induced from activation of COX-2 has been associated with degradation in osteoarthritic cartilage,26 and cartilage when cultured with pro-inflammatory cytokines in vitro.27,28 In our cultures, large increases in PGE2 secretion with early chondrogenesis followed by decreases to a steady-state rate were consistent with human MSCs in pellet culture.29 Furthermore, severe suppression of PGE2 synthesis by celecoxib during early chondrogenesis indicated stress- or inflammation-induced activation of COX-2. Among the Dex conditions tested in this study, COX-2 activation did not appear to significant affect chondrogenesis as increases in PGE2 secretion with reducing or eliminating Dex was not consistent with the effects of Dex on ECM accumulation. While additional assays are necessary to more thoroughly characterize the effects of Dex on inflammation and catabolism, these data suggest that modulation of pathways that influence ADAMTS or MMP gene expression, or COX-2 activation, did not play a critical role in the accumulation of ECM during MSC chondrogenesis.
An ongoing concern about the use of MSCs to resurface articular cartilage defects is the propensity of MSCs to acquire markers of hypertrophy during chondrogenesis. Hypertrophic markers have been identify over time in MSC chondrogenic culture in 100 nM Dex,30 while reducing the concentration of Dex in culture has been used to promote hypertrophy.31 In Dex-free culture in the current study, upregulation of MMP13 and type X collagen relative to 100 nM Dex may suggest advanced hypertrophic differentiation in the absence of Dex. One nanomolar Dex did not suppress these markers of hypertrophy, and in fact increased type X collagen expression over Dex-free cultures on day 6. Alkaline phosphatase activity did not suggest increased hypertrophy with reduction or elimination of Dex, although these data are consistent with human MSC pellet cultures in which alkaline phosphatase activity was modestly lower in Dex-free culture relative to 100 nM Dex.5 By day 15 of chondrogenic culture, moderate levels of alkaline phosphatase secretion may be expected,30,32 although secretion may increase significantly with additional time in culture.30,32,33 In addition, beyond 15 days of chondrogenic culture it has been shown that medium conditions that promote hypertrophy can further increase alkaline phosphatase secretion up to 3-fold.33 Therefore it is possible that additional time in culture, over which alkaline phosphatase secretion may increase with concomitant increases in type I and X gene expression,30 would better delineate the effect of Dex concentration on hypertrophic markers. While additional assays are necessary to more thoroughly characterize commitment to hypertrophy, the gene expression data suggest that high levels of Dex may be beneficial to reduce differentiation to this undesirable phenotype. It is possible that Dex influences hypertrophic differentiation through the regulation of COX-2 as suppression of hypertrophic markers has been associated with COX-2 inhibition during chondrogenesis in vitro.34 This possibility is supported in the current study as gene expression of MMP13 and type X collagen was consistent with PGE2 secretion in that the lowest values were found for 100 nM Dex cultures. While additional studies are necessary to more precisely define the potential relationship between COX-2 activation and hypertrophic differentiation, the persistent PGE2 secretion through 21 days of culture may suggest that multiweek suppression of inflammation leading to COX-2 activation may be effective in suppress hypertrophic differentiation.
Given that the temporal effects of Dex exposure on MSC chondrogenesis have not been reported, we performed experiments in which Dex was withheld or withdrawn to determine how the timing of exposure influence chondrogenesis. At a concentration of 1 nM, Dex could be withheld for up to two days without significantly affecting the accumulation of ECM, while withdrawal studies suggested that Dex plays an important role in ECM accumulation beyond day 6. A similar temporal pattern was noted for 100 nM Dex, although the high variability in hydroxyproline accumulation suggest that a larger samples size is necessary to better delineate the effect of withholding or withdrawing 100 nM Dex. Taken together, these data suggest that strategies for delivering Dex in vivo should prioritized sustained delivery, which is in contrast to chondrogenic growth factors that may be effective in stimulating chondrogenesis with a limited duration of initial exposure.11-14
When considering the design of delivery strategies for Dex to support MSC chondrogenesis in vivo, this study indicates that a lower therapeutic bound that is 100-fold less than the conventional in vitro dose may be sufficient to support robust neo-cartilage development. However, the important issue of whether high levels of Dex function to suppress hypertrophic differentiation in vivo must be determined. With regard to timing of Dex exposure, the need to sustain therapeutic concentrations of Dex for days may prove challenging without advanced techniques for controlled local delivery due to rapid clearing of Dex from the body, even when administered intra-articularly using doses that far exceed the concentrations tested in this study.35 A secondary consideration for intra-articular dosing of Dex may be that high concentrations that strongly suppress inflammation may have a negative impact as inflammation has been shown to play a supportive role in chondrogenesis.36,37 In this regard, additional studies are necessary to identify the specific inflammatory pathways that function to support chondrogenesis, and whether those key pathways are modulated by Dex. A limitation of this study is that the effects of Dex was evaluated in a single system consisting of equine bone marrow MSCs in agarose hydrogel, which does not necessarily reflect the response of different species, tissue sources, and scaffolds to Dex. It is likely that the current study does not grossly understate the need for Dex to support ECM accumulation as superior chondrogenesis with Dex concentrations in excess of 100 nM have not been reported. However, it is possible that certain combinations of cells and scaffolds may be less dependent on Dex as laboratory studies have demonstrated robust chondrogenesis in the absence of Dex for human bone marrow MSCs seeded in polyethylene glycol diacrylate14 or self-assembling peptide hydrogels,8 or bovine synovium-derived MSCs in pellet culture.7
Footnotes
Acknowledgments and Funding: The author(s) disclosed receipt of the following financial support for the research, authorship, and/or publication of this article: This work was supported by College Research Council (CRC) of Colorado State University.
Declaration of Conflicting Interests: The author(s) declared no potential conflicts of interest with respect to the research, authorship, and/or publication of this article.
Ethical Approval: This study used cells from bone marrow that had been previously obtained using a university-approved animal care and use protocol.
References
- 1. Dominici M, Le Blanc K, Mueller I, Slaper-Cortenbach I, Marini FC, Krause DS, et al. Minimal criteria for defining multipotent mesenchymal stromal cells. Cytotherapy. 2006;8(4):315-7. [DOI] [PubMed] [Google Scholar]
- 2. Diao H, Wang J, Shen C, Xia S, Guo T, Dong L, et al. Improved cartilage regeneration utilizing mesenchymal stem cells in TGF-β1 gene-activated scaffolds. Tissue Eng Part A. 2009;15(9):2687-98. [DOI] [PubMed] [Google Scholar]
- 3. Fan H, Hu Y, Qin L, Li X, Wu H, Lv R. Porous gelatin-chondroitin-hyaluronate tri-copolymer scaffold containing microspheres loaded with TGF-β1 induces differentiation of mesenchymal stem cells in vivo for enhancing cartilage repair. J Biomed Mater Res A. 2006;77(4):785-94. [DOI] [PubMed] [Google Scholar]
- 4. Park JS, Woo DG, Yang HN, Lim HJ, Park KM, Na K, et al. Chondrogenesis of human mesenchymal stem cells encapsulated in a hydrogel construct: neocartilage formation in animal models as both mice and rabbits. J Biomed Mater Res A. 2010;92(3):988-96. [DOI] [PubMed] [Google Scholar]
- 5. Johnstone B, Hering TM, Caplan AI, Goldberg VM, Yoo JU. In vitro chondrogenesis of bone marrow-derived mesenchymal progenitor cells. Exp Cell Res. 1998;238(1):265-72. [DOI] [PubMed] [Google Scholar]
- 6. Mouw JK, Connelly JT, Wilson CG, Michael KE, Levenston ME. Dynamic compression regulates the expression and synthesis of chondrocyte-specific matrix molecules in bone marrow stromal cells. Stem Cells. 2007;25(3):655-63. [DOI] [PubMed] [Google Scholar]
- 7. Shintani N, Hunziker EB. Differential effects of dexamethasone on the chondrogenesis of mesenchymal stromal cells: influence of microenvironment, tissue origin and growth factor. Eur Cells Mater. 2011;22:302-19. [DOI] [PubMed] [Google Scholar]
- 8. Florine EM, Miller RE, Porter RM, Evans CH, Kurz B, Grodzinsky AJ. Effects of dexamethasone on mesenchymal stromal cell chondrogenesis and aggrecanase activity: comparison of agarose and self-assembling peptide scaffolds. Cartilage. 2013;4(1):63-74. [DOI] [PMC free article] [PubMed] [Google Scholar]
- 9. Park JS, Na K, Woo DG, Yang HN, Park KH. Determination of dual delivery for stem cell differentiation using dexamethasone and TGF-β3 in/on polymeric microspheres. Biomaterials. 2009;30(27):4796-805. [DOI] [PubMed] [Google Scholar]
- 10. Na K, Kim S, Woo DG, Sun BK, Yang HN, Chung HM, et al. Combination material delivery of dexamethasone and growth factor in hydrogel blended with hyaluronic acid constructs for neocartilage formation. J Biomed Mater Res A. 2007;83(3):779-86. [DOI] [PubMed] [Google Scholar]
- 11. Mehlhorn AT, Schmal H, Kaiser S, Lepski G, Finkenzeller G, Stark GB, et al. Mesenchymal stem cells maintain TGF-β-mediated chondrogenic phenotype in alginate bead culture. Tissue Eng. 2006;12(6):1393-403. [DOI] [PubMed] [Google Scholar]
- 12. Kopesky PW, Vanderploeg EJ, Kisiday JD, Frisbie DD, Sandy JD, Grodzinsky AJ. Controlled delivery of transforming growth factor β1 by self-assembling peptide hydrogels induces chondrogenesis of bone marrow stromal cells and modulates Smad2/3 signaling. Tissue Eng Part A. 2011;17(1-2):83-92. [DOI] [PMC free article] [PubMed] [Google Scholar]
- 13. Bian L, Zhai DY, Tous E, Rai R, Mauck RL, Burdick JA. Enhanced MSC chondrogenesis following delivery of TGF-β3 from alginate microspheres within hyaluronic acid hydrogels in vitro and in vivo. Biomaterials. 2011;32(27):6425-34. [DOI] [PMC free article] [PubMed] [Google Scholar]
- 14. Buxton AN, Bahney CS, Yoo JU, Johnstone B. Temporal exposure to chondrogenic factors modulates human mesenchymal stem cell chondrogenesis in hydrogels. Tissue Eng Part A. 2011;17(3-4):371-80. [DOI] [PMC free article] [PubMed] [Google Scholar]
- 15. Kisiday JD, Kopesky PW, Evans CH, Grodzinsky AJ, McIlwraith CW, Frisbie DD. Evaluation of adult equine bone marrow- and adipose-derived progenitor cell chondrogenesis in hydrogel cultures. J Orthop Res. 2008;26(3):322-31. [DOI] [PubMed] [Google Scholar]
- 16. Kim YJ, Sah RL, Doong JY, Grodzinsky AJ. Fluorometric assay of DNA in cartilage explants using Hoechst 33258. Anal Biochem. 1988;174(1):168-76. [DOI] [PubMed] [Google Scholar]
- 17. Farndale RW, Buttle DJ, Barrett AJ. Improved quantitation and discrimination of sulphated glycosaminoglycans by use of dimethylmethylene blue. Biochim Biophys Acta. 1986;883(2):173-7. [DOI] [PubMed] [Google Scholar]
- 18. Stegemann H, Stalder K. Determination of hydroxyproline. Clin Chim Acta. 1967;18(2):267-73. [DOI] [PubMed] [Google Scholar]
- 19. Penning TD, Talley JJ, Bertenshaw SR, Carter JS, Collins PW, Docter S, et al. Synthesis and biological evaluation of the 1,5-diarylpyrazole class of cyclooxygenase-2 inhibitors: identification of 4-[5-(4-methylphenyl)-3-(trifluoromethyl)-1H-pyrazol-1-yl]benzenesulfonamide (SC-58635, celecoxib). J Med Chem. 1997;40(9):1347-65. [DOI] [PubMed] [Google Scholar]
- 20. Barry F, Boynton RE, Liu B, Murphy JM. Chondrogenic differentiation of mesenchymal stem cells from bone marrow: differentiation-dependent gene expression of matrix components. Exp Cell Res. 2001;268(2):189-200. [DOI] [PubMed] [Google Scholar]
- 21. Awad HA, Halvorsen YD, Gimble JM, Guilak F. Effects of transforming growth factor β1 and dexamethasone on the growth and chondrogenic differentiation of adipose-derived stromal cells. Tissue Eng. 2003;9(6):1301-12. [DOI] [PubMed] [Google Scholar]
- 22. Payne KA, Didiano DM, Chu CR. Donor sex and age influence the chondrogenic potential of human femoral bone marrow stem cells. Osteoarthritis Cartilage. 2010;18(5):705-13. [DOI] [PMC free article] [PubMed] [Google Scholar]
- 23. Grigoriadis AE, Aubin JE, Heersche JN. Effects of dexamethasone and vitamin D3 on cartilage differentiation in a clonal chondrogenic cell population. Endocrinology. 1989;125(4):2103-10. [DOI] [PubMed] [Google Scholar]
- 24. Sekiya I, Koopman P, Tsuji K, Mertin S, Harley V, Yamada Y, et al. Dexamethasone enhances SOX9 expression in chondrocytes. J Endocrinol. 2001;169(3):573-9. [DOI] [PubMed] [Google Scholar]
- 25. Mwale F, Stachura D, Roughley P, Antoniou J. Limitations of using aggrecan and type X collagen as markers of chondrogenesis in mesenchymal stem cell differentiation. J Orthop Res. 2006;24(8):1791-8. [DOI] [PubMed] [Google Scholar]
- 26. Mastbergen SC, Bijlsma JW, Lafeber FP. Selective COX-2 inhibition is favorable to human early and late-stage osteoarthritic cartilage: a human in vitro study. Osteoarthritis Cartilage. 2005;13(6):519-26. [DOI] [PubMed] [Google Scholar]
- 27. Hardy MM, Seibert K, Manning PT, Currie MG, Woerner BM, Edwards D, et al. Cyclooxygenase 2-dependent prostaglandin E2 modulates cartilage proteoglycan degradation in human osteoarthritis explants. Arthritis Rheum. 2002;46(7):1789-803. [DOI] [PubMed] [Google Scholar]
- 28. Attur M, Al-Mussawir HE, Patel J, Kitay A, Dave M, Palmer G, et al. Prostaglandin E2 exerts catabolic effects in osteoarthritis cartilage: evidence for signaling via the EP4 receptor. J Immunol. 2008;181(7):5082-8. [DOI] [PubMed] [Google Scholar]
- 29. Pountos I, Giannoudis PV, Jones E, English A, Churchman S, Field S, et al. NSAIDS inhibit in vitro MSC chondrogenesis but not osteogenesis: implications for mechanism of bone formation inhibition in man. J Cell Mol Med. 2011;15(3):525-34. [DOI] [PMC free article] [PubMed] [Google Scholar]
- 30. Pelttari K, Winter A, Steck E, Goetzke K, Hennig T, Ochs BG, et al. Premature induction of hypertrophy during in vitro chondrogenesis of human mesenchymal stem cells correlates with calcification and vascular invasion after ectopic transplantation in SCID mice. Arthritis Rheum. 2006;54(10):3254-66. [DOI] [PubMed] [Google Scholar]
- 31. Mueller MB, Tuan RS. Functional characterization of hypertrophy in chondrogenesis of human mesenchymal stem cells. Arthritis Rheum. 2008;58(5):1377-88. [DOI] [PMC free article] [PubMed] [Google Scholar]
- 32. Weiss S, Hennig T, Bock R, Steck E, Richter W. Impact of growth factors and PTHrP on early and late chondrogenic differentiation of human mesenchymal stem cells. J Cell Physiol. 2010;223(1):84-93. [DOI] [PubMed] [Google Scholar]
- 33. Mueller MB, Fischer M, Zellner J, Berner A, Dienstknecht T, Prantl L, et al. Hypertrophy in mesenchymal stem cell chondrogenesis: effect of TGF-β isoforms and chondrogenic conditioning. Cells Tissues Organs. 2010;192(3):158-66. [DOI] [PMC free article] [PubMed] [Google Scholar]
- 34. Welting TJ, Caron MM, Emans PJ, Janssen MP, Sanen K, Coolsen MM, et al. Inhibition of cyclooxygenase-2 impacts chondrocyte hypertrophic differentiation during endochondral ossification. Eur Cell Mater. 2011;22:420-37. [DOI] [PubMed] [Google Scholar]
- 35. Soma LR, Uboh CE, Liu Y, Li X, Robinson MA, Boston RC, et al. Pharmacokinetics of dexamethasone following intra-articular, intravenous, intramuscular, and oral administration in horses and its effects on endogenous hydrocortisone. J Vet Pharmacol Ther. 2013;36(2):181-91. [DOI] [PubMed] [Google Scholar]
- 36. Caron MM, Emans PJ, Surtel DA, Cremers A, Voncken JW, Welting TJ, et al. Activation of NF-κB/p65 facilitates early chondrogenic differentiation during endochondral ossification. PLoS One. 2012;7(3):e33467. [DOI] [PMC free article] [PubMed] [Google Scholar]
- 37. Mumme M, Scotti C, Papadimitropoulos A, Todorov A, Hoffman W, Bocelli-Tyndall C, et al. Interleukin-1β modulates endochondral ossification by human adult bone marrow stromal cells. Eur Cell Mater. 2012;24:224-36. [DOI] [PubMed] [Google Scholar]