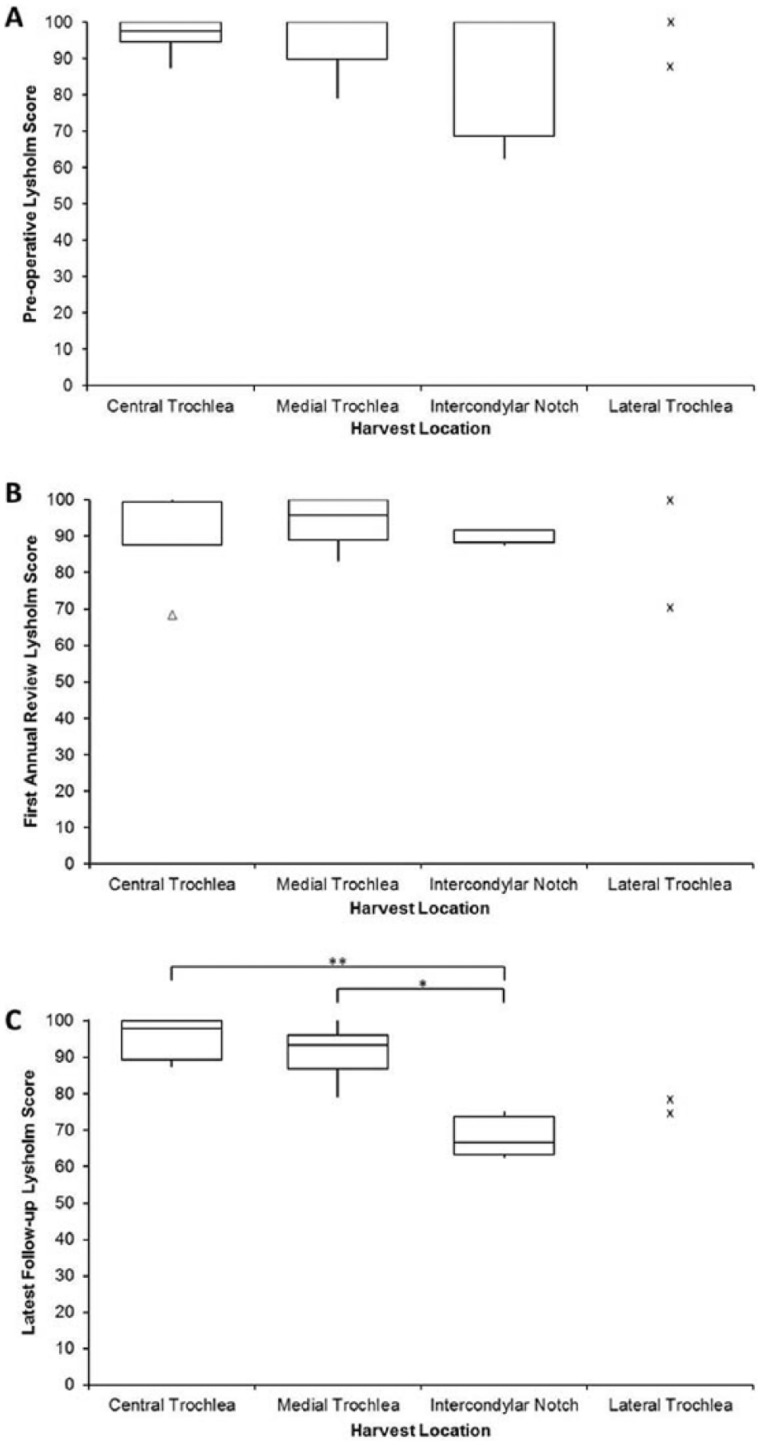
Figure 3.
Box and whisker plots comparing Lysholm scores for different donor sites preoperatively (A), at first annual review (B), and at latest follow-up (C). Lysholm scores were not significantly different from each other preoperatively or at first annual review, but at the latest follow-up, the Lysholm score of patients who had chondral harvest from the intercondylar notch, had significantly lower scores than patients with harvests taken from the central trochlea (**P = 0.01) and the medial trochlea (*P = 0.02). Actual Lysholm scores for the lateral condyle at the 3 time points are represented as small crosses. The box and the horizontal line represent the interquartile range (IQR) and the median, respectively. Outliers are represented as a small triangle.

