

Abstract
An important challenge in the simulation of biomolecular systems is a quantitative description of the protonation and deprotonation process of amino acid residues. Despite the seeming simplicity of adding or removing a positively charged hydrogen nucleus, simulating the actual protonation/deprotonation process is inherently difficult. It requires both the explicit treatment of the excess proton, including its charge defect delocalization and Grotthuss shuttling through inhomogeneous moieties (water and amino residues), and extensive sampling of coupled condensed phase motions. In a recent paper (J. Chem. Theory Comput. 2014, 10, 2729−2737), a multiscale approach was developed to map high-level quantum mechanics/molecular mechanics (QM/MM) data into a multiscale reactive molecular dynamics (MS-RMD) model in order to describe amino acid deprotonation in bulk water. In this article, we extend the fitting approach (called FitRMD) to create MS-RMD models for ionizable amino acids within proteins. The resulting models are shown to faithfully reproduce the free energy profiles of the reference QM/MM Hamiltonian for PT inside an example protein, the ClC-ec1 H+/Cl– antiporter. Moreover, we show that the resulting MS-RMD models are computationally efficient enough to then characterize more complex 2-dimensional free energy surfaces due to slow degrees of freedom such as water hydration of internal protein cavities that can be inherently coupled to the excess proton charge translocation. The FitRMD method is thus shown to be an effective way to map ab initio level accuracy into a much more computationally efficient reactive MD method in order to explicitly simulate and quantitatively describe amino acid protonation/deprotonation in proteins.
Introduction
The hydrated excess “proton” is in fact a unit of net positive charge1 due to a missing electron that can be passed between and among biomolecules2 in a seemingly simple dance of charge neutralization. However, the molecular nature of this dance is complicated, involving a dynamic charge delocalization between molecules and a constant restructuring of covalent and hydrogen bond topology. Understanding and being able to characterize the migration of excess protons is important given the many roles that proton transport (PT) plays throughout biology. Virtually all biomolecules are sensitive to pH, and many incorporate PT into their functional mechanisms, including transporters, proton pumps, proton channels, and enzymes. For example, the bacterial H+/Cl– antiporter ClC-ec1, a homologue of mammalian ClC antiporters, energetically couples the transmembrane transport of two Cl– ions and one proton.3,4 The mammalian ClCs have many physiological functions, including maintenance of the membrane potential, regulation of transepithelial Cl– transport, and control of pH in the cytoplasm and intracellular organelles.5−9 Cytochrome c oxidase (CcO), a proton pump in the respiratory chain of mitochondria and bacteria, reduces oxygen to water and utilizes the released free energy to pump protons across the membrane, contributing to the transmembrane electrochemical potential gradient that is necessary for ATP synthesis.10−13 The influenza A M2 proton channel protein14 transports the protons across the influenza virus membrane and triggers the dissociation of the viral matrix proteins, which is an essential step in the influenza virus replication cycle.15 This is a short list of the many systems in which PT plays a role in a functional mechanism. For such systems, the ionizable amino acids that influence the PT pathways often play an active role via transient protonation and deprotonation. For example in the ClC-ec1 antiporter, an intracellular-facing glutamic acid, E203, shuttles an excess proton to an extracellular-facing glutamic acid, E148, during transmembrane PT.16,17 In CcO, the highly conserved glutamic acid E286 is the key for both transmembrane proton pumping and PT for the chemical reaction.18,19 In the influenza A M2 channel, a highly conserved tetrad of histidine residues (H37) is responsible for the pH-dependent channel activation and proton selectivity.20
Computational approaches can play an important role in the investigation of PT mechanisms in proteins, adding molecular level insight as well as increased temporal and spatial resolution to experimental data. However, it is very challenging to explicitly model the PT process, even in simple bulk water solution, because it involves charge defect delocalization, Grotthuss shuttling (proton hopping), and solvent reorganization. Moreover, the migration of an excess proton in proteins and other confined spaces can be nontrivially coupled with changes in the hydration along the PT pathway.21−23 As will be discussed later, water molecules move in/out of internal protein cavities in response to the excess positive charge as it moves between water molecules and ionizable amino acids. Therefore, to more completely describe PT in biological systems, a computational method should (1) explicitly treat charge defect delocalization and Grotthuss shuttling of the excess proton(s) between water molecules and ionizable amino acids undergoing protonation/deprotonation; (2) allow exchange of water molecules between different protein internal cavities as well as between those cavities and bulk solution; and (3) be computationally efficient enough to achieve sufficient sampling of the charge translocation and protein and solvent configuration space for large-scale biomolecular systems, including protein, solvent, ions, and (where needed) the membrane. Quantum mechanical approaches, such as ab initio molecular dynamics (AIMD) or quantum mechanics molecular mechanics (QM/MM) MD methods, can in principle explicitly treat the reactive nature of amino acid protonation/deprotonation and the Grotthuss hopping phenomenon. However, their computational expense limits the application of the former to small systems much smaller than proteins and restricts the free energy sampling of the latter when applied to large biomolecular systems. A lack of sufficient free energy sampling generally leads to results with large systematic errors that depend on the initial state of the system. In addition, QM/MM methods without adaptive partitioning24,25 prohibit the exchange of MM and QM atoms across the QM/MM boundary, which is unphysical. Although adaptive QM/MM partitioning methods enable the exchange of MM and QM atoms across the boundary, they can suffer from both inaccuracy of forces on atoms near the boundary and a lack of sufficient energy conservation.26 The QM/MM boundary may be especially problematic when the hydration along the PT pathway changes in response to the migration of the excess proton charge defect since this necessitates the exchange of water molecules between protein cavities and bulk solution, which often occurs beyond the nanosecond time scale.
An alternative approach that explicitly accounts for the reactive nature of the hydrated excess proton is the multiscale reactive molecular dynamics (MS-RMD) method.2,27,28 This approach describes the migration of an excess proton including explicit Grotthuss shuttling and charge defect delocalization by evolving the system on a reactive potential energy surface defined as a dynamical linear combination of diabatic basis states, as in the earlier multistate empirical valence bond (MS-EVB) method.2,29,30 As will be shown in detail later, the newer MS-RMD approach differs from the older MS-EVB approach primarily because the underlying reactive force field of MS-RMD is largely derived from AIMD or QM/MM data via force-matching and other means, rendering it far less empirical than the original MS-EVB approach. MS-RMD is also “multiscale” in the sense that quantum information on the electronic states is variationally bridged upward in scale to describe the forces felt by the system nuclei in the RMD model. As shown later as well, MS-RMD is several orders of magnitude more computationally efficient than MD from QM/MM, while still describing the charge delocalization and reactive nature of the PT. The MS-RMD method is also not complicated by the QM/MM boundary issues because the molecules that participate in the proton charge defect charge delocalization are dynamically redefined at each time step in such a way that the forces on the atoms are more continuous. Thus, as water molecules or residues move away from the excess proton, the forces acting on the atoms gradually transition to those described by the classical force field. These advantages make the MS-RMD method (and MS-EVB before it) a powerful tool for investigating PT in a variety of biological systems.
However, the primary challenge of the MS-RMD method is that it needs to be properly parametrized in order to faithfully simulate PT. The parametrization of MS-RMD models is the focus of this work. In ref (31), an approach for parametrizing MS-RMD models for ionizable amino acids in bulk water was developed. In this fitting approach, forces from QM/MM calculations are bridged via an iterative variational framework into the reactive MS-RMD model. In particular, the MS-RMD model parameters are obtained by sampling configurations with a guess MS-RMD model and then fitting the model parameters to best reproduce forces from QM/MM calculations that are as accurate as possible. Our fitting procedure was partially motivated by the work of Wang and co-workers, in which force fields for liquid water were developed with an adaptive force matching method.32,33 It also bears similarity to the work of Zhou and Pu on reactive path force matching.34 Because of the use of configurations from condensed phase MS-RMD trajectories, the resulting model takes into account the condensed phase environment, which is not captured in gas phase fitting. For a given MS-RMD potential energy functional form and with restrictions on the ranges of parameter values, this fitting approach was shown to work well for investigating glutamic acid (Glu) and aspartic acid (Asp) deprotonation in bulk water.31 However, one cannot simply use these models to study the deprotonation of amino acids such as Asp and Glu within proteins. The electrostatic and hydration environment affecting ionizable amino acid protonation/deprotonation inside biomolecules can be very different from that in bulk solution. For example, deprotonated Asp and Glu residues often form salt bridges with positively charged residues in proteins, and the surrounding hydration structure is rarely bulk-like. As a consequence, the pKa values of amino acids inside proteins are often largely shifted from those measured in bulk solution. These differences require reparameterization of the MS-RMD models to fit the protein environment.
In this work, we demonstrated the use of FitRMD parametrization to generate MS-RMD models for ionizable amino acid in proteins. The paper is organized as follows. We first outline a framework for fitting MS-RMD models for amino acid residues in biomolecular systems. We then give the computational details for following this framework in two example systems: the ClC-ec1 antiporter and CcO. The ability of the generated MS-RMD models to faithfully reproduce the free energy profiles (potentials of mean force, PMFs) of the reference QM/MM Hamiltonian is demonstrated for PT inside the ClC-ec1 channel in two different states. The importance of sampling and related QM/MM limitations are also demonstrated in ClC-ec1. Finally, the advantages of developing efficient MS-RMD models are demonstrated with the calculation of 2-dimensional free energy profiles (2D-PMFs) of PT coupled to hydration changes in the central hydrophobic region of CcO.
Methods
Multiscale Reactive Molecular Dynamics (MS-RMD)
The MS-RMD (and MS-EVB) method describes electronic delocalization of the excess proton as a linear combination of distinct states with different chemical bonding topologies. In the central region of the ClC-ec1 antiporter (see Figure 1 for the images of the whole protein structure and its central region), Figure 2 shows examples of a set of states in certain configurations, where the excess proton is delocalized into a glutamate residue and surrounding water molecules. The Hamiltonian is defined as
| 1 |
where r are the system nuclear coordinates, hii is the potential energy for state i described by a classical force field, and hij is the coupling between states |i⟩ and |j⟩. The diagonalization of the Hamiltonian matrix on the fly gives the energy and eigenvector of the ground state for every configuration of nuclei r:
| 2 |
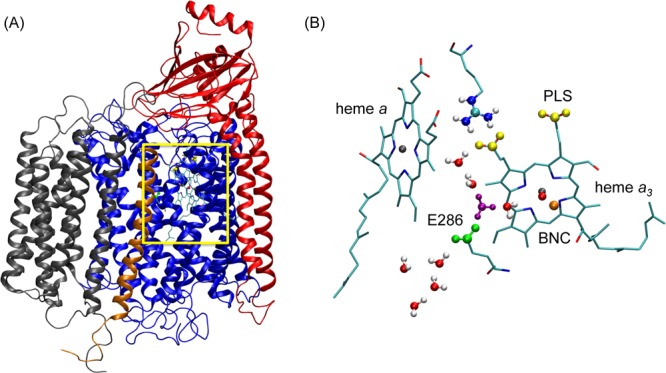
Figure 1.
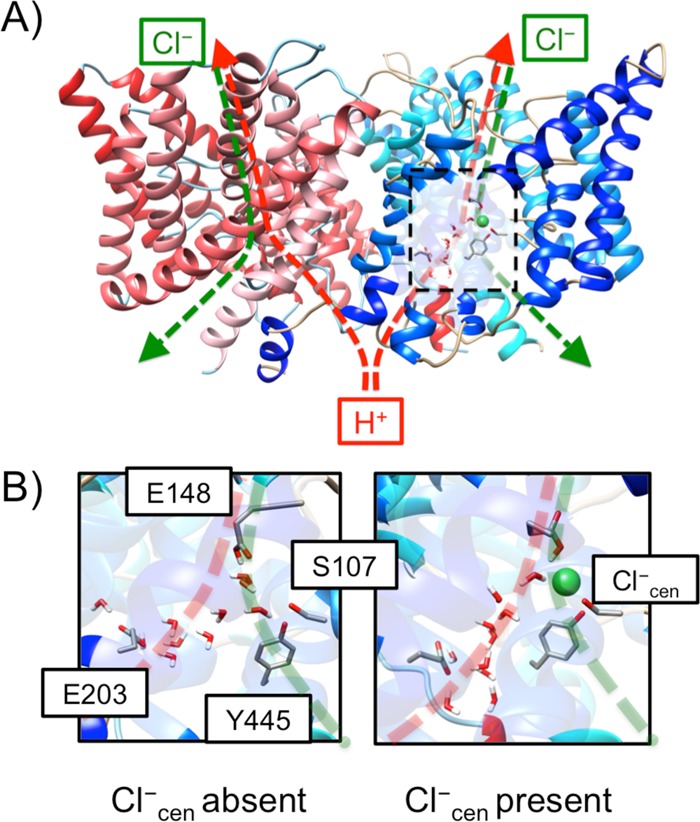
(A) Overview of the structure of the ClC-ec1 antiporter and transport pathways for Cl– (green dashed) and H+ (red dashed). The central region is highlighted in the black box. (B) Representative configurations of the central region with (left) Cl–cen absent and (right) present for the “P” state in the PMFs in Figure 3. The protein and water molecules (in sticks) and Cl–cen (in a sphere) are included in the QM region in the QM/MM calculation of the reference force.
Figure 2.
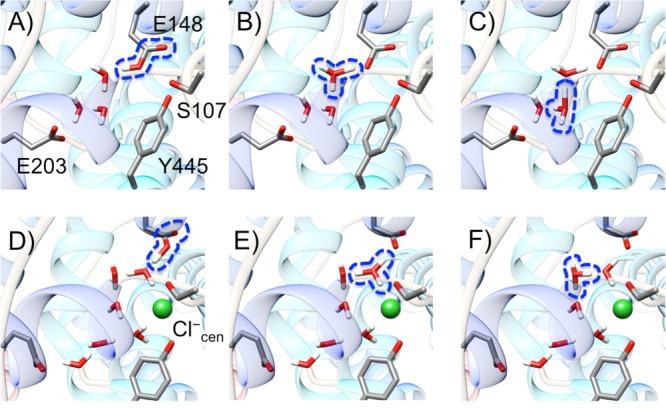
Representative configurations of a set of MS-RMD states with different bonding topologies for the same atomic coordinates in the ClC-ec1 antiporter. The configurations represent the three mostly populated diabatic states (with the highest values of ci2(r)), captured at the windows for ζR = 0.8, when Cl–cen is either absent (A–C) or present (D–F). The excess proton is attached to E148 (A and D), the first water from E148 (B and E), or the second water (C and F). The protonated species in each diabatic state is shown inside the blue dashed line.
The forces are evaluated by the Hellmann–Feynman theorem and are used to propagate the system in an MD simulation. It is important to note that the method explicitly treats the excess proton charge defect delocalization, Grotthuss shuttling, and the polarization effect associated with the excess proton complex. The resulting MD trajectory is continuous and deterministic to within numerical error.
The diagonal elements hii of the MS-RMD Hamiltonian are given by the potential energy function of each basis state i. Note that there is a single excess proton in the system and that either glutamate or water is protonated at each state. The hii corresponding to the state with protonated glutamate (GLUH) is described as
| 3 |
where the first three terms are the inter- and the intramolecular potentials of protonated glutamate and all other surrounding molecules, such as waters, other protein residues, lipids, and ions in the system. They are computed with the CHARMM22 force field,35 with the exception of the O–H bond in the carboxyl (−COOH) group of glutamate. To properly represent its dissociation as a proton transfers from the carboxyl oxygen to the water oxygen, the harmonic bond stretch potential is replaced with a standard Morse potential, UMorse(r):
| 4 |
where r is the O–H bond length, and D, α, and r0 are parameters, which are taken from our previous work.31 Since the classical force fields between two protonated forms of glutamate and water do not share a common energy origin, Vii is introduced to compensate the constant energy shift between the two states.
In order to correct overestimated electrostatic interaction at a short distance36 between opposite charges on hydronium and deprotonated glutamate, two repulsive terms, VOOkrep and VHjOk, are introduced in hii corresponding to the state with deprotonated glutamate:
| 5 |
| 6 |
where ROOϵ is the distance between the hydronium oxygen, O, and the carboxyl oxygen of glutamate, Oϵ (OE1 and OE2 in the PDB), and RHjOϵ is the distance between each of the three hydronium hydrogen atoms, Hj, and the carboxyl oxygen of glutamate. The functional forms for the repulsive terms are the same as those used in the MS-EVB3.1 model.31B, b, b′, C, and c are fitted parameters, and dOO0 and dOH are fixed with the same value used in MS-EVB3.1, which are 2.4 and 1.0 Å, respectively.
The off-diagonal element hij for the coupling between protonated glutamate and water is given by
| 7 |
where rOH is the distance between the donor oxygen of the carboxyl group of glutamate and the acceptor hydrogen of the adjacent hydronium molecule. c1, c2, and c3 are fitted parameters. hij for the coupling between hydronium and water is the same as the one used in the MS-EVB3.1 model.
The MS-RMD (and MS-EVB) formalism also provides a convenient and physically intuitive description of the excess proton center of the excess charge (CEC), defined as2
| 8 |
where the NEVB is the total number of EVB states, ci2(r) is the population of state i contributing to the MS-RMD ground state, and ri is the geometric center-of-charge for state i. This CEC definition allows the use of a continuous reaction coordinate (further discussed below) for the PMF calculation of PT in biological systems.2 The protonated moiety in the state with the largest coefficient, c1 (eq 8), possesses the majority of the excess positive charge, when in bulk water this state is the most hydronium-like species29,30,37,38 (or the so-called “pivot” hydronium, a technical term used below).
FitRMD Parametrization Scheme
One possible fitting procedure of an MS-RMD potential energy function to QM/MM data was first described in ref (31). In such an approach, configurations along the PT reaction coordinate are sampled by MS-RMD umbrella sampling simulations with the initial guess MS-RMD model parameter set. In the present article, the initial guess amino acid models were taken from the previous work done in bulk water,31 except that the constant energy shift between protonated/deprotonated states in the model (Vii) was determined by the difference in the Coulomb energy of the RMD (EVB) complex between the most favorable hydronium state and the protonated state. The range of the PT reaction coordinate was set to sample configurations for both protonated/deprotonated states (further defined below). Next, for each configuration a QM/MM calculation was performed to collect the reference forces on each atom in the MS-RMD reactive complex. Then, the MS-RMD model parameter set was optimized by minimizing the variational residual:
| 9 |
where NC and NA are the number of configurations and the number atoms in each configuration, respectively. The weight of each atom w(rij) is set to unity here, but it should be noted that other choices are possible. The atomic force Fij is the one obtained from the current MS-RMD model parameter set, and FijQM/MM is the reference force from the QM/MM calculations. The whole set of the model parameters were then divided into two groups: (1) the diagonal terms Vii and (2) the off-diagonal and repulsive terms. The model optimization was done individually for each group. First, the off-diagonal and repulsive terms were fit with the value of Vii fixed, and then Vii was refit with new values of the off-diagonal and repulsive terms held fixed.
Developing MS-RMD Models Using FitRMD for ClC-ec1
MS-RMD simulations of the PT process in the bacterial ClC homologue, ClC-ec1, are extensively described in ref (39). The FitRMD method was used to parametrize the MS-RMD models from QM/MM data for the two glutamate residues in the central region, namely, the E148 (Gluex) and the E203 (Gluin), which have been identified as intermediate sites for proton binding along the transport pathway (see Figure 1). Depending on the presence of Cl– at the central site (Cl–cen), two different systems were setup. For each system setup, two sets of umbrella sampling simulations were performed (deprotonating either E148 or E203) to sample configurations for the generation of the QM/MM force data. In order to obtain the initial configurations for the umbrella sampling, 50 ns of unconstrained classical MD was run both with Cl–cen present and absent. In this time, water penetrated the central region from the intracellular side of the membrane, forming a continuous hydrogen bonded network between the carboxyl oxygens of E148 and E203. A harmonic potential with a force constant of 20 kcal·mol–1·Å–2 was applied to a collective variable (CV), defined as |rCEC – rX|, where “X” is the carboxyl center of mass for either E148 or E203. The centers of the windows ranged from 2.0 to 4.0 Å and were separated by 0.25 Å. At CV = 2.0 Å, all configurations have the amino acid fully protonated, while at CV = 4.0 Å all were deprotonated with protonated state contributing less than 0.01% (ci2(r) ≤ 10–4).
The configurations were selected with a 2 ps interval from each window for ∼500 configurations for each protonation site. For each configuration, a single point QM/MM calculation was performed to evaluate the forces acting on the QM atoms. As shown in Figure 1B, the QM region included Cl–cen, if present, the water molecules in the central region, and the side chain of the pore-lining residues, including E113, E148, E202, E203, Y445, and S107. The waters in the central region within the third solvation shell from E148 and E203 were also included in the QM region. The QM box size was set to be 20–30 Å in each dimension to ensure that it was 6–8 Å larger than the size of the QM atoms in each dimension. The Gaussian Expansion of the Electrostatic Potential (GEEP) scheme was used to treat the QM/MM electrostatic coupling with periodic boundary conditions (PBCs),40,41 and the spurious QM/QM periodic image interactions were decoupled as described in ref (42). The Cα–Cβ chemical bonds that crossed the QM/MM boundary were capped with hydrogen atoms, the forces on which were calculated following the IMOMM scheme43 with a scaling factor of 1.50. The QM atoms were treated with density functional theory (DFT) using the BLYP functional44,45 with empirical dispersion corrections,46 under the Gaussian and plane wave (GPW) scheme.47 Goedecker–Teter–Hutter (GTH) pseudopotentials48 were used, and the Kohn–Sham orbitals were expanded in the Gaussian TZV2P basis set.
After the QM/MM forces were obtained, the MS-RMD model parameters were optimized by minimizing the residual given in eq 9 using a genetic algorithm.49 All atoms in the reactive complex, as defined by the MS-RMD state-selection algorithm,30 were included in the fitting (i.e., the glutamic acid side chains and solvent atoms in the central region). The Vii and the off-diagonal terms were iteratively optimized for 3–6 rounds, depending on the system, until they changed less than 1%. The models for E203 and E148 were developed independently because they are separated by 10–14 Å, depending on the presence of Cl–cen, and therefore never participate in coupled delocalization of the excess charge. The MS-RMD simulations were performed with the RAPTOR software28 interfaced with the LAMMPS MD package (http://lammps.sandia.gov),50 and the umbrella potentials were controlled by the PLUMED package.51 All single point QM/MM calculations are performed by the CP2K package.52 The FitRMD calculation was performed by an in-house code.31 Parameters for E148 and E203 for ClC-ec1 with Cl–cen either absent or present are given in Table 1.
Table 1. MS-RMD Model Parameters of E148 and E203 in ClC-ec1.
| ClC-ec1 |
||||
|---|---|---|---|---|
| Cl–cen absent |
Cl–cen present |
|||
| E148 | E203 | E148 | E203 | |
| B | 0.063153 | 0.118175 | 0.012536 | 0.003282 |
| b | 1.571751 | 0.558680 | 0.232384 | 0.424087 |
| b′ | 1.320947 | 1.311301 | 1.469007 | 0.480047 |
| dOO0 | 2.4 | 2.4 | 2.4 | 2.4 |
| C | 0.363648 | 0.076533 | 0.014044 | 0.026472 |
| c | 1.117167 | 1.063753 | 1.152912 | 1.309021 |
| dOH0 | 1.0 | 1.0 | 1.0 | 1.0 |
| rsl | 3.5 | 3.5 | 3.5 | 3.5 |
| rsh | 4.0 | 4.0 | 4.0 | 4.0 |
| Vii | –147.095673 | –144.522565 | –151.11473 | –147.01392 |
| c1 | –36.090543 | –40.406344 | –30.414842 | –35.686750 |
| c2 | 1.879933 | 3.826462 | 3.331769 | 1.291340 |
| c3 | 1.193253 | 1.439519 | 1.422240 | 1.598104 |
| D | 143.003 | 143.003 | 143.003 | 143.003 |
| α | 1.8 | 1.8 | 1.8 | 1.8 |
| r0 | 0.975 | 0.975 | 0.975 | 0.975 |
1D-PMF Calculations of PT from E203 to E148 in ClC-ec1
In order to directly compare MS-RMD and QM/MM free energy profiles, umbrella sampling was performed with a CV defined as ζR, which is a function of the excess proton CEC (rCEC) and the center of mass of the carboxyl groups of the E203 (r203) and the E148 (r148) residues:
| 10 |
The excess proton CEC coordinate, however, was defined as53
| 11 |
where the rXj is the position of the jth heavy atom in the QM region, which is either the water oxygen atoms or the carboxyl oxygen atoms in the E203 or the E148, and the rHi is the position of the ith hydrogen atom bound to those heavy atoms. (It should be noted that this CEC definition was used for both the QM/MM and MS-RMD simulations, as opposed to eq 8 for the latter, in order to have a common definition of the CV in the two PMFs for comparison.) The weighting factor, wXj, was set to be two for all the water oxygen atoms and zero for carboxyl oxygen atoms in the E203 and E148, which reflect the hydrogen coordination number in the deprotonated state of the heavy atom. The term dXjHi denotes the distance between Xj and Hi atoms, and the fsw(dXjHi) = 1/(1 + exp[(dXjHi – rsw)/dsw]) is the switching function describing the coordination number of Hi to Xj, with the parameters chosen as dsw = 0.04 Å, rsw = 1.25 Å.54
The CV ζR varies from 0 to 1 as the excess proton CEC moves from E203 to E148. The centers of the harmonic umbrella potentials were separated by 0.1–0.2 Å between adjacent windows. The umbrella sampling force constant for ζR was chosen to be in the range of 3000–7000 kcal·mol–1, depending on the sampling overlap between umbrella windows. Given that the denominator of ζR, |rCEC – r203| + |rCEC – r148|, is ∼15 Å, the effective force constant acting on |rCEC – r203| was 15–30 kcal·mol–1·Å–2. Because the central region is accessible by the water molecules from the intracellular bulk, the CEC can locate outside the central region at the windows near E203 when a restraint is only placed on ζR. To avoid sampling irrelevant positions (leading to the intracellular bulk phase), an additional restraint defining the upper limit for |rCEC – r148| was applied such that the CEC was always situated between E148 and E203. The upper limit was chosen to be 2σ above the average of |rCEC – r148| in each window.
The details of the preparation of the initial configuration and the classical MD equilibration for the ClC-ec1 antiporter are described in ref (39). The initial configurations used for the FitRMD umbrella sampling were used to initiate the MS-RMD umbrella sampling simulations. Near the middle of the reaction path, when E203 and E148 were both deprotonated, a water molecule close to the center of each umbrella window was replaced with a hydronium cation. All windows were first equilibrated for 100 ps, followed by production runs of ∼2 ns. The integration time step was 1 fs. The CV ζR was collected every 10 time steps (10 fs), and the PMF was constructed by the weighted histogram analysis method (WHAM).55 Statistical error bars in the PMFs were estimated using the block averaging method by dividing each trajectory into four consecutive blocks.
1D-PMF Calculation with QM/MM
The initial configurations used in the MS-RMD simulations were also used for the QM/MM umbrella sampling simulations. The simulation details for the QM/MM MD were kept consistent with the single point force calculations used in FitRMD. The window spacing and force constants for the umbrella windows were similar to those used in the MS-RMD simulations. All windows were equilibrated with QM/MM MD for another ∼5 ps, followed by production runs of ∼20 ps. (It should be noted that in our experience if a FitRMD model differs significantly from the underlying QM/MM forces due to a bad fit, then subsequent QM/MM MD configurations taken starting with the MS-RMD initial conditions will diverge quickly from the MS-RMD ones.) The integration time step was 0.5 fs, and the CV ζR was collected every time step. The PMF was again constructed by WHAM. All QM/MM MD simulations were performed by the CP2K package.52
Upon finding that the PMFs (see Figure 3) calculated with QM/MM and MS-RMD MD disagreed for the Cl–cen absent system in the CV range 0.18 < ζR < 0.26, a second set of QM/MM simulations was run in order to investigate the origin of the PMF discrepancy. The second set of QM/MM umbrella sampling simulations were initiated from the last MD snapshots of the MS-RMD umbrella sampling simulations, which had an increased hydration level compared to that of the original QM/MM simulations. All windows in the CV range 0.18 < ζR < 0.26 were then sampled for 5 ps. All other simulation details were unchanged from the original QM/MM umbrella sampling.
Figure 3.
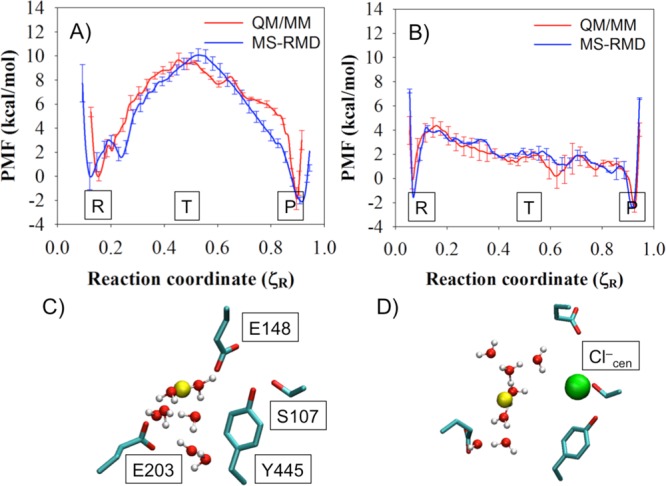
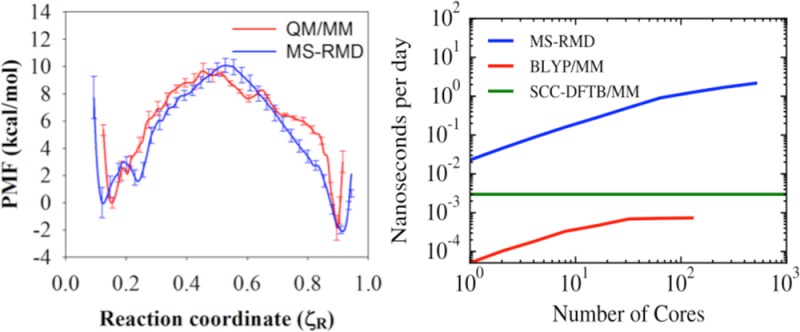
PMFs of PT through the central region of the ClC-ec1 antiporter with (A) Cl–cen absent and (B) present, as calculated with MS-RMD (blue) and QM/MM (red). Labels “R”, “T”, and “P” indicate the reactant state, the center of the CV range, and the product state, respectively. The CV ζR varies from 0 to 1 as the excess proton CEC moves from E203 to E148. The average side chain positions of four important residues are shown for state “T” in the MS-RMD systems with (C) Cl–cen absent or (D) present. The solvent positions and proton center of the excess charge (CEC, yellow sphere) are taken from the last snapshot.
Comparative Structural Analysis in ClC-ec1
Structural elements of the ClC-ec1 protein are shown in Figures 1–6. To obtain these structures, the production run simulation conformations were averaged in each umbrella window following three steps. First, configurations were aligned based on α carbon atoms at least 15 Å away from the central region. Second, the positions of the side chains of the four residues in the central region (S107, E148, E203, and Y445) and Cl–cen, if present, were averaged, and full moieties representative of these averages were depicted. Third, the positions of the water molecules and the excess proton were taken from the last MD frame.
Figure 6.
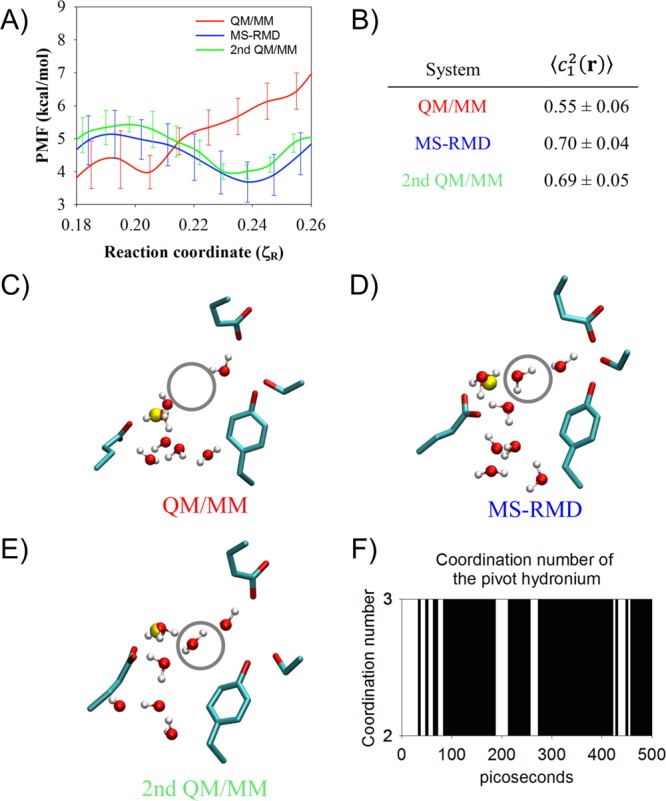
Panel A: The PMF from Figure 3A for ζR = 0.18–0.26. The second QM/MM PMF (green) was initiated from the final MS-RMD configuration in each window. (B) The average and the standard error of c12(r), reflecting the delocalization of the hydrated excess proton (see text), from the original QM/MM, the MS-RMD, and the second QM/MM umbrella sampling at the window ζR = 0.24. Panels C–E: The averaged structure of the four residues and the water structure in the last snapshot from the (C) the QM/MM, (D) the MS-RMD, and (E) the second QM/MM umbrella sampling at the window ζR = 0.24. The region circled by a gray line represents the position of the second water. (See further description in the main text.) Panel F: The coordination number of the pivot hydronium to oxygen atoms of surrounding water molecules or the carboxyl group of E203 in the MS-RMD simulation, initiated from the configuration at low hydration level, which mimics the configuration of the QM/MM in C.
Hydration Dynamics in the Central Region of ClC-ec1
To calculate the time scale for the transition from a low to high hydration state in the central region of ClC-ec1, the low hydration state first needed to be created in the MS-RMD structure. To do this, a high hydration configuration was taken from the last MS-RMD snapshot at umbrella window ζR = 0.24 (Figure 6D). An additional harmonic potential was applied to the water density CV (Nw) in the predefined box (see refs (23) and (39) and for definition). The force constant of the harmonic potential was set to be 10 kcal·mol–1, and the center of the potential was at Nw = 0. The center of the box was chosen to be the midpoint between the center of mass of each carboxyl group of E148 and E203, and the box size was set to be 2 × 2 × 2 Å3, which covered the position of the second water. The second water present in the initial configuration was expelled from the central region by the harmonic potential centered at Nw = 0. The MS-RMD simulation was run for 200 ps, until the system was equilibrated in the absence of the second water.
Ten independent trajectories were initiated from the last MD frame of the simulation above, after the velocities of all atoms were randomized and the harmonic potential centered at Nw = 0 was released. The coordination number of the pivot hydronium was defined as the number of oxygen atoms (from water or the E203 carboxyl group) within 3 Å from the pivot hydronium oxygen. The time for the second water entering the central region was estimated by averaging the 10 simulations time to when there was a productive (not transient) transition of the coordination number from 2 to 3.
Developing MS-RMD Models Using FitRMD for CcO
The FitRMD method was also used to parametrize the MS-RMD models from QM/MM data for three protonatable sites in the hydrophobic cavity of CcO, including the E286, PRDa3, and PRAa3 (Figure 7). Umbrella sampling simulations were first carried out along the PT pathway identified by the MS-RMD metadynamics (MTD) simulation.56,57 Then for each protonatable site, ∼100 configurations were selected from the trajectories from windows within 4 Å of the transition state of proton dissociation (defined as the windows with ∼50% of the configurations having the largest amplitude on the amino acid and the other 50% on the first water molecule) for each protonatable site. Single point QM/MM calculations were then performed for each configuration using the B3LYP level density functional theory.58 The MM models were the CHARMM22 and CHARMM3659 force fields for the protein and lipids, respectively. The QM region included the side chain of each protonatable amino acid, the hydrated excess proton, and water molecules within 3 solvation shells of the carboxyl group (Figure 7B). In all calculations, the QM box size was chosen to be 6–8 Å larger than the actual size of the QM atoms in each dimension. The GEEP scheme was used to treat the QM/MM electrostatic coupling with periodic boundary conditions (PBCs), and the spurious QM/QM periodic image interactions were decoupled as described in ref (42). The Cα–Cβ chemical bonds that cross the QM/MM boundary were capped with hydrogen atoms, the forces on which were calculated following the IMOMM scheme with a scaling factor of 1.50. The forces generated by the QM/MM calculations were used to parametrize the MS-RMD parameters for the protonatable sites using FitRMD approach. The MS-RMD simulations were performed with the RAPTOR software interfaced with the LAMMPS MD package, as described earlier. The QM/MM calculation was performed with the CP2K package, and FitRMD was carried out with in-house software, again as described earlier. Parameters for E286, PRDa3 and PRAa3 are given in Table 2.
Figure 7.
(A) Cytochrome c oxidase from Rhodobacter sphaeroides. The subunits I, II, III, and IV are colored in blue, red, gray, and orange, respectively. The yellow rectangular box highlights the E286 residue and the heme-copper groups that are essential for proton pumping and reaction. (B) Enlargement of the region where E286, heme a, heme a3, and BNC are located. E286 is shown in green, the propionate groups of the PLS in yellow, the hydrated excess proton in purple, the iron atom of the heme groups in gray, and the copper atom in the BNC in orange. The heme groups are shown as sticks. In the QM/MM calculation, the QM atoms include the E286 side chain, the hydronium, and the 3 solvation shells of water molecules around the E286 residue (shown in VDW representation).
Table 2. MS-RMD Model Parameters of E286, PRDa3, and PRAa3 in CcO.
| E286 | PRDa3 | PRAa3 | |
|---|---|---|---|
| B | 0.037588 | 0.995945 | 0.994509 |
| b | 0.208388 | 1.999090 | 1.993038 |
| b′ | 0.533589 | 0.000009 | 0.006308 |
| dOO0 | 2.4 | 2.4 | 2.4 |
| C | 4.925621 | 0.988369 | 0.322227 |
| c | 1.975947 | 1.990330 | 1.981954 |
| dOH0 | 1.0 | 1.0 | 1.0 |
| rsl | 3.5 | 3.5 | 3.5 |
| rsh | 4.0 | 4.0 | 4.0 |
| Vii | –135.809617 | –149.99445 | –146.174 |
| c1 | –21.659933 | –31.931186 | –38.677822 |
| c2 | 2.785857 | 2.689357 | 1.903222 |
| c3 | 1.299987 | 1.147862 | 1.245548 |
| D | 143.003 | 143.003 | 143.003 |
| α | 1.8 | 1.8 | 1.8 |
| r0 | 0.975 | 0.975 | 0.975 |
The QM/MM calculations for CcO were performed at the B3LYP DFT level and as such were much more expensive than the BLYP level DFT QM/MM calculations carried out for ClC-ec1. As a result, fewer configurations were used for CcO than for ClC-ec1 in the FitRMD, and for the same reason, no explicit PMF was calculated with the B3LYP level QM/MM for CcO (see below). In addition, the CcO system is too complex to converge any reasonable accurate QM/MM PMF, and this fact serves to highlight the strength of the MS-RMD approach.
2D-PMF for PT in the CcO Hydrophobic Cavity with MS-RMD
Full details of the CcO simulations and PMF calculations are presented in ref (60). Some of the relevant details are given here, including the fact that the MS-RMD umbrella sampling simulations in the hydrophobic cavity (HC) were carried out by restraining the excess proton CEC position (eq 8) along the PT pathway defined from the MTD simulations and the water density in a predefined box that encompasses the HC (see ref (23) for the definition). The force constant for the harmonic umbrella sampling restraint potential was 10 kcal/mol/Å2 on the proton migration CV and 20 kcal/mol on the water density. The window spacing was ∼0.5 Å for the CEC and ∼0.5 for the water density. For each umbrella window, the MS-RMD simulation length was ∼500 ps. The integration time step was 1 fs. The CV ζR was collected every 10 time steps (10 fs). The 2D PMF was constructed by the WHAM.
Comparing the Computational Efficiency of Different Methods
The computational speed for the MS-RMD, self-consistent density functional tight binding (SCC-DFTB)-based QM/MM,61,62 and BLYP-based QM/MM methods were compared for the MD simulation of the CcO system. (The QM/MM with B3LYP is much too slow for viable QM/MM MD in these systems.) For MS-RMD, the setup was the same as described in the above section. For the BLYP QM/MM method, the QM/MM setup was the same as described in the above section for FitRMD, except that the QM atoms were treated by the BLYP functional with empirical dispersion corrections. More details on the BLYP-based QM/MM MD simulation setup are presented in ref (60). For the SCC-DFTB-based QM/MM setup, the QM atoms were the same as those in the BLYP-based QM/MM setup. The point charge based Ewald summation was used to treat QM/MM electrostatic coupling under PBCs.63 More details on the SCC-DFTB-based QM/MM setup are described in ref (64). The MS-RMD simulation and BLYP-based QM/MM simulations were performed as described previously. The SCC-DFTB-based QM/MM simulation was performed with the CHARMM package.65
Results and Discussion
Comparing QM/MM and MS-RMD Free Energy Profiles in the ClC-ec1 Antiporter
An important measure of success of the FitRMD method is its ability to reproduce results of the reference Hamiltonian for properties other than those that were fit (atomistic forces), and there is arguably no property more important than the PT free energy profile (PMF). Unlike our previous work demonstrating the FitRMD method for amino acid deprotonation in bulk water,31 calculating a PMF with QM/MM is possible in a protein environment because the water molecules are more confined. (In the bulk environment, the QM/MM boundary issues introduce such large errors that a direct comparison between MS-RMD and QM/MM PMFs is highly problematic at best.) However, for many protein cavities the waters involved in PT between two residues are largely surrounded by protein, and they all fit into the QM region, making exchange across the QM/MM boundary less of a complication. Although many protein systems will still require extensive sampling (beyond the limits of QM/MM) as well as exhibit water exchange across the QM/MM boundary on longer time scales, the level of confinement in the ClC-ec1 antiporter system enables a direct comparison of the QM/MM and MS-RMD PMFs.
PT through the central region of ClC antiporters is one of the essential intermediate steps in Cl–/H+ exchange. The migration of an excess proton from the internal E203 to the external E148 through water molecules in the central region is coupled with migration of approximately 2 Cl– ions in the opposite direction (Figure 1). Therefore, the PMFs for PT in the central region of the ClC-ec1 antiporter were calculated both in the presence and absence of Cl– at the central binding site, Cl–cen.
The MS-RMD and QM/MM PMFs (Figures 3A and B) show excellent agreement for most parts of the reaction coordinate and for both states of the system (with and without Cl–cen), although there are some differences (discussed below). The free energy barrier of the PT process is significantly decreased when Cl–cen is present, mainly due to the electrostatic interaction between the excess proton and the Cl–cen ion. These results demonstrate that the FitRMD approach is capable of generating MS-RMD models that reproduce the free energy profile of the reference QM/MM Hamiltonian, using only forces on the atomic nuclei from a relatively small set of configurations as input for the fitting. Moreover, the FitRMD approach is robust enough to quantitatively capture the effect of the Cl–cen ion on the free energy surface of the reference QM/MM Hamiltonian. This suggests that the FitRMD approach is also capable of describing the shift in proton affinity in different protein environments, which has significant value for simulating PT in different protein systems with the MS-RMD method.
The hydration structure surrounding the reactive protein residues was also compared. The radial distribution functions (RDFs) from the carboxyl carbon of either E148 or E203 to the water and hydronium oxygens were calculated with the excess proton CEC restrained in the reactant, transition, and product states of the PMF (the positions are labeled as “R”, “T”, and “P” in Figure 3A and B). The RDFs (Figures 4 and 5 with and without Cl–cen, respectively) demonstrate that the solvation structure around E203 and E148 is quite similar between the QM/MM and MS-RMD methods. This result provides additional evidence that the model generated by the FitRMD approach faithfully reproduces the underlying free energy landscape of the reference QM/MM Hamiltonian, even though only QM/MM forces on the atom nuclei were used as input for the fitting. The discrepancies in the RDFs shown in Figures 4 and 5 are likely due to the different water behavior of QM versus MM water as well as short QM/MM sampling where the water dynamics are slow in the confined space of the central region, which will be discussed below. We note, however, that this level of agreement may not be expected for more bulk-like water environments since the QM and MM water will have such different structural properties.
Figure 4.
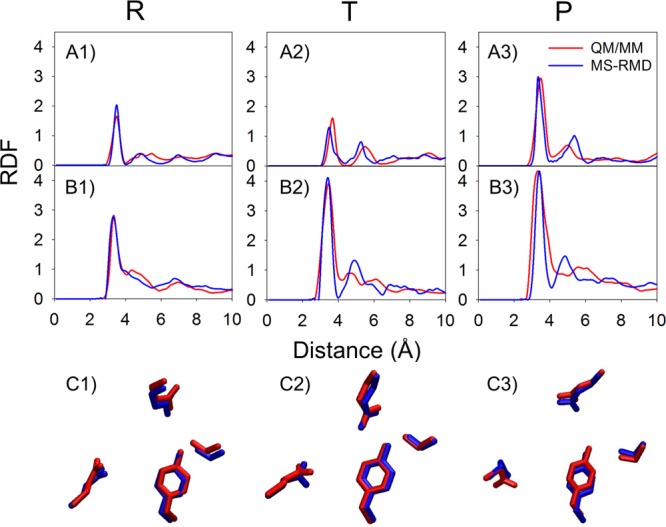
In the system with Cl–cen absent, RDFs from E148 carboxyl carbon (CD in the PDB) to water oxygens are shown in A1 to A3, for the “R”, “T”, and “P” states (Figure 3), respectively. The RDFs from the E203 carboxyl carbon to water oxygens are shown in B1 to B3 in the same order. The averaged positions of the four side chains are shown in C1 to C3 in the same order, with the QM/MM structures in red and the MS-RMD structures in blue.
Figure 5.
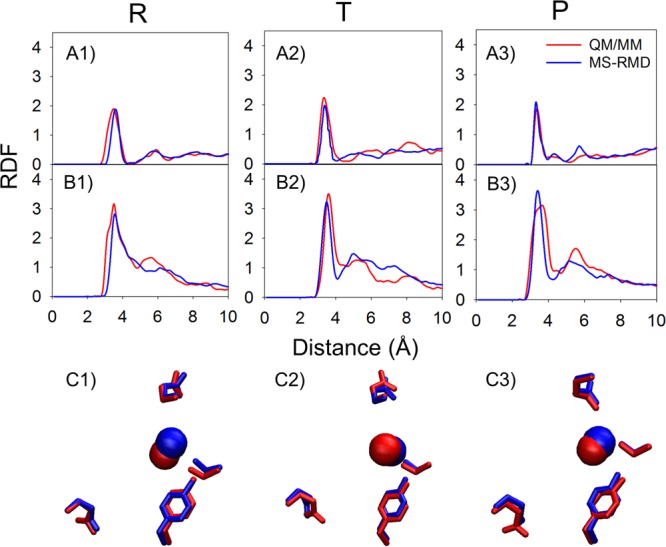
In the CLC system as in Figure 4 but with Cl–cen present. All notation is consistent with Figure 4.
Limitations of the QM/MM Free Energy Profiles
Although the PMFs in Figure 3A and B show that the MS-RMD and QM/MM PMFs generally agree well, some discrepancies appear. Focusing on the most significant, Figure 6A highlights the region 0.18 < ζR < 0.26 from Figure 3A, where the MS-RMD PMF (blue) dips to a modest metastable minimum, but the QM/MM PMF (red) shows an uphill rise with only a slight dip at ζR ≅ 0.21. This discrepancy between the two PMFs is caused by the change of the local environment for the excess proton. The structures of the central region captured from the ζR = 0.24 umbrella windows, where the two PMFs disagree most, are shown in Figure 6C (QM/MM) and D (MS-RMD). The MS-RMD structure shows one additional water (gray circle) compared to the QM/MM structure. The center of excess charge (yellow sphere) is close to the first water coordinated to E203 in this window for both the QM/MM and MS-RMD configurations, meaning that the first water is the most hydronium-like species (the “pivot” hydronium, which has the largest MS-RMD state coefficient, c1, in eq 8). To better understand the difference in solvation structures and charge delocalization, we calculated the average value of c12 for all configurations in the ζR = 0.24 umbrella windows from the QM/MM and MS-RMD simulations (Figure 6B). It should be kept in mind that the c1 value for an Eigen cation (H9O4+) is ∼0.65, which indicates that the pivot hydronium holds ∼65% of the positive charge (hydronium-like) defect, while that for a Zundel cation (H5O2+) is ∼0.5 since in that case, excess charge is more equally shared between two water molecules. The MS-RMD simulations yield larger ⟨c12(r)⟩ values (0.7) because the pivot hydronium is coordinated to two waters in the central region, in addition to the carboxyl group, leading to a stable Eigen-like (CO-H7O3+) complex. However, one of these waters is missing in the QM/MM simulations (Figure 6C, gray circle), shifting ⟨c1(r)⟩ to a lower value (0.55) and the delocalization to more of a Zundel-like complex between the carboxyl group and first water molecule (CO-H3O+). The MS-RMD Eigen-like complex forms a contact ion pair (CIP) with the carboxyl group of deprotonated E203 and the stabilizing electrostatic attraction between oppositely charged ions causes a small energy well (∼1 kcal/mol) in the MS-RMD PMF. However, in the QM/MM configurations, no hydrogen bond acceptor is found near one of the hydrogen atoms of the pivot hydronium, causing the PMF to continue its uphill climb.
To see if the PMF discrepancy was caused by sampling different conformational phase space, another set of QM/MM umbrella sampling simulations was run for 5 ps (as described earlier), initiated from the last snapshots from the MS-RMD umbrella sampling simulations in the CV range 0.18 < ζR < 0.26. The resulting QM/MM PMF (green in Figure 6A) shows much better agreement with the MS-RMD PMF. Figure 6B and E show that for this second QM/MM simulation the value of ⟨c12(r)⟩ is close to the MS-RMD value, and that the missing second water is present. Thus, the PMF discrepancy is indeed caused by sampling different conformational phase space with that sampled by MS-RMD having one additional water molecule to stabilize the excess proton.
To estimate the time scale required for the additional water molecule (missing in the original QM/MM simulations) to enter the central region, an MS-RMD configuration was prepared (see Methods) at ζR = 0.24 in which this water was removed (mimicking the QM/MM solvation structure shown in Figure 6C). The system was equilibrated in this low solvation state, and then 10 independent MS-RMD simulations were run for 500 ps. Figure 6F shows the coordination number of the pivot hydronium to the oxygen atoms of the surrounding water molecules or the carboxyl group of E203 in one of the trajectories. The coordination number at t = 0 ps is 2, when the pivot hydronium is coordinated to one water oxygen and E203’s carboxyl oxygen. Although there are some transient transitions to a coordination of 3 around t ≃ 30–70 ps, due to an additional water oxygen, the second water is not stable for another 100 ps. The second water then enters the central region from the intracellular bulk. The coordination number remains 3 for most of the last 400 ps of the trajectory (∼89% of the time). This trajectory is representative of the other nine trajectories, in which the second water did not enter the central region until t = 60–185 ps (⟨t⟩ = 99 ps), after which the coordination number remained 3 for 88 ± 5% of the rest of the trajectories. These results suggest that the entrance of the second water is energetically favored in this umbrella window but that the time scale of this event exceeds the sampling time possible in the QM/MM simulations.
Although the discrepancy that motivated this detailed investigation was small, it highlights another important limitation of QM/MM MD PMFs. In addition to the errors and artificial dynamics introduced by QM/MM boundary issues, limited sampling, especially of slow degrees of freedom such as changing hydration, can hide insidious PMF errors. This reinforces the importance of being able to map accurate ab initio forces onto an efficient method that is capable of extensive sampling. Free energy profiles in complicated condensed phase environments are generally a balance of enthalpic and entropic contributions, requiring both accurate potential energy representations and extensive sampling. This is further explored below.
MS-RMD Can Capture Coupling between Hydration and PT in CcO
CcO offers another example of PT through an interior protein region being coupled to hydration changes. During the reaction cycle of aa3-type CcO, as found in mitochondria, protons from the intracellular side of the membrane are transported through the so-called D-channel to the glutamic acid E286 in the middle of the membrane. The protons are then transported through water molecules in a hydrophobic cavity (the HC) either to the pump loading site (PLS) to be further released to the periplasmic side of the membrane or to the binuclear center (BNC) to react with oxygen and form water. A particularly interesting aspect of the proton pumping mechanism in CcO is the role of water molecules in the HC during PT from amino acid E286 to the PLS or BNC (Figure 7B). The number of water molecules in the HC and their role in PT has been the focus of much debate.21,22,66−70 To further complicate this issue, the water molecules can move in and out of the HC in CcO in response to the migration of the excess proton, and the two processes can be intrinsically coupled to each other. Capturing this type of cooperativity often requires computationally demanding enhanced sampling of multiple degrees of freedom. Here, we show that the computationally efficient MS-RMD method parametrized by the FitRMD approach allowed us to address this challenge.
We calculated 2D PMFs for the PT from E286 to the PLS in different redox states during the A → F transition of CcO. The collective variables used to define these 2D PMFs are (1) the progress of the excess proton CEC through the HC (horizontal axis) and (2) the degree of hydration of the HC (vertical axis) (Figure 8; see Methods for more discussion). The 2D PMF shown in Figure 8 clearly reveals the cooperativity between the PT and dynamic hydration in the HC. The minimum free energy pathway (black line) along the 2D PMF (Figure 8) verifies that as the excess proton migrates from E286 to the PRDa3, the hydration level of HC gradually increases. The nonhorizontal feature of the minimum free energy pathway indicates that the HC hydration is intrinsically coupled to the proton charge defect translocation in this activated process.
Figure 8.
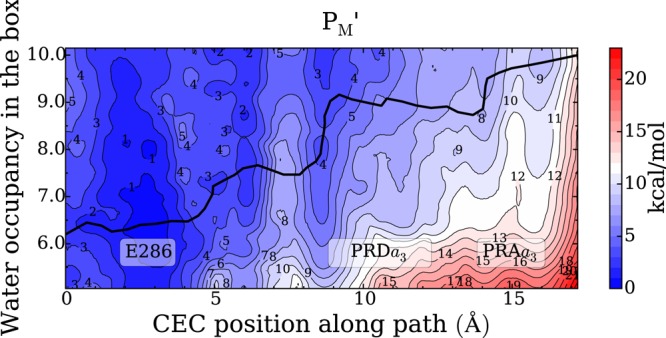
Two-dimensional free energy profiles (2D-PMFs) for PT from the E286 to the PLS in the PM′ state, as a function of the CEC coordinate through the hydrophobic cavity (HC) as the horizontal axis and the water hydration in the HC as the vertical axis. The minimum free energy pathways (black lines) are diagonal in nature, indicating that the two processes are coupled. The statistical errors of the 2D-PMFs are ∼0–3 kcal/mol.
It is also important to emphasize how the computational efficiency of the MS-RMD method makes it feasible to calculate such 2D PMFs. Figure 9 shows a relative speed and scaling over the processor plot of the MS-RMD, SCC-DFTB-based QM/MM, and BLYP-based QM/MM MD methods for CcO. It is seen that MS-RMD is at least 3 orders of magnitude faster than the BLYP-based QM/MM simulation and 2 orders of magnitude faster than the SCC-DFTB-based QM/MM simulation. MS-RMD also scales better over processors than the other two methods (the SCC-DFTB CHARMM code is not scalable at all.)
Figure 9.
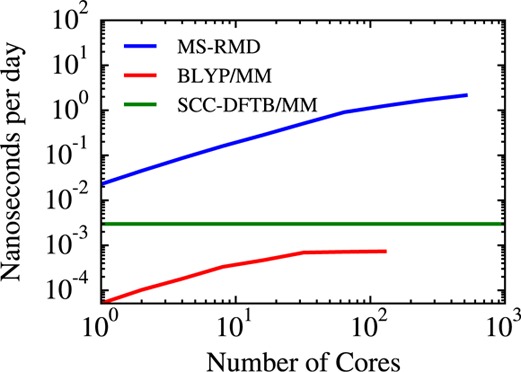
Scaling plot for the MS-RMD, SCC-DFTB-based QM/MM, and BLYP-based QM/MM simulations of CcO. The blue curve is for MS-RMD, the green is for SCC-DFTB, and the red curve is for BLYP-based QM/MM. The MS-RMD method is at least 3 orders of magnitude faster than the BLYP-based QM/MM method and 2 orders of magnitude faster than SCC-DFTB-based QM/MM, while showing more favorable scaling properties over processors (the SCC-DFTB CHARMM code is not scalable).
Conclusions
Describing reactive processes in biomolecular systems remains a challenging domain for molecular simulations. The ab initio methods that are capable of describing chemical reactions generally do not scale to the size of most biomolecules or to the time scales needed to converge multidimensional free energy profiles of rare events in condensed phase environments. Thus, bridging a quantum description of the reactive processes with more computationally efficient approaches (e.g., classical dynamics and enhanced sampling methods) that are capable of extensive phase space sampling is of great utility and fundamental importance. The work presented herein contributes a multiscale framework aimed at accomplishing this multiscale bridging, specifically for the purpose of simulating the protonation/deprotonation of ionizable moieties such as amino acids in biomolecules. The core of our framework is the MS-RMD method, which describes reactive processes in classical MD and explicitly treats the charge defect delocalization and Grotthuss shuttling of the hydrated excess proton in the PT process. However, MS-RMD must be carefully parametrized in order to simulate PT faithfully, and the approach is not yet a “black box”. Considerable effort has gone into the parametrization of the MS-RMD model for PT in water27,29,30,37,38 and amino acids.31,71,72 Herein, we have extended to proteins the parametrization scheme from QM/MM data to MS-RMD models (FitRMD) and demonstrated its use on protonatable amino acids in biomolecular systems.
As presented here, the FitRMD approach variationally maps quantum data (DFT-level QM/MM forces in this case) onto the MS-RMD nonlinear reactive force field. We have demonstrated how FitRMD can be used to parametrize MS-RMD models for amino acids in proteins with two example systems, ClC-ec1 and CcO. In ClC-ec1, the MS-RMD models were shown to faithfully reproduce the PT PMFs of the reference QM/MM MD, both in the presence and absence of a Cl– ion in the central region. Thus, the FitRMD parametrization was robust enough to capture quite different free energy profiles due to the presence or absence of a single ion. Moreover, the local structure of the protein and confined water was shown to be quite similar between the MS-RMD and QM/MM simulations. In CcO, the developed MS-RMD models were shown to be efficient enough to capture the coupling between PT and hydration changes in the HC region. Two-dimensional free energy surfaces in which both PT and hydration levels were explicitly sampled are required for this analysis. Given that individual umbrella windows often required over 500 ps to converge, these calculations would not be possible with a QM/MM MD approach. Moreover, QM/MM boundary issues, such as the lack of exchange of water molecules, can lead to large systematic errors in such PT PMFs. Even for the ClC-ec1 system where exchange of water across the QM/MM boundary is minimal due to protein confinement, lack of water exchange was argued to introduce errors in the calculated QM/MM free energy profile.
It is worth noting that in this article the original parametrization method of Nelson et al.31 was extended and shown to work in much more complex molecular situations. For example, in ClC-ec1 the MS-RMD models produce a PMF that is consistent with the QM/MM Hamiltonian even though the CV used for the configuration sampling (absolute distance) is different from the CV used for the PMF calculation (ratio of distances) (see Methods for a full description). Moreover, different models for the same Glu residues were parametrized in different states, with and without the central Cl– ion, resulting in quite different PMFs that were independently consistent with the QM/MM PMFs. It should also be emphasized that although a low-level QM method (BLYP-D) was used here in the QM/MM calculations, our goal was to demonstrate that a reference ab initio Hamiltonian (and free energy surface) can be reproduced. Thus, an MS-RMD model obtained from FitRMD using a higher level reference ab initio method can be expected to also faithfully reproduce the free energy surface from the latter, if only the latter could be calculated, which it currently cannot be. In principle, therefore, our multiscale FitRMD with MS-RMD framework can be used in the future to estimate high-level (e.g., MP2) free energy profiles for reactive processes, although the accuracy of the surrounding environment will remain dependent on the chosen classical force field.
It also seems clear that the MS-RMD model parameters will depend on the given system under study and hence not likely to be “transferable” to some other system. However, this is precisely the point of the MS-RMD approach (and also the QM/MM approach which it is fitting). It is very unlikely that it is generally possible to have transferable potential parameters for reactive processes. However, we note that the MS-RMD fitting methodology is itself transferable to different systems and that its use is practical because the total computational cost for both the model fit and the MD sampling with MS-RMD will be still much cheaper than directly performing QM/MM MD simulations on the same system.
Our future efforts will focus on improving the FitRMD protocol to make it more robust to the choice of the trial MS-RMD model, as free as possible from the coevolution of parameters, and insensitive to discrepancies between the QM and MM descriptions of nonreactive atoms in the system. We anticipate that reactive processes in many biomolecular and other systems can eventually be studied with the MS-RMD approach.
Acknowledgments
We are grateful to Dr. Yuxing Peng for giving helpful advice on the FitRMD code.
Author Contributions
† S.L. and R.L. contributed equally to this work.
This research was supported by the National Institutes of Health (grant R01-GM053148). The Computational resources in this work were provided in part by a grant of computer time by the Extreme Science and Engineering Discovery Environment (XSEDE), which is supported by National Science Foundation grant number ACI-1053575, in part by the U.S. Department of Defense (DOD) High Performance Computing Modernization Program at the Engineer Research and Development Center (ERDC) and Navy DOD Supercomputing Resource Centers, in part by the University of Chicago Research Computing Center (RCC), in part by the Computation Institute, and the Biological Sciences Division of the University of Chicago, under NIH grant 1S10OD018495-01.
The authors declare no competing financial interest.
References
- Knight C.; Voth G. A. The Curious Case of the Hydrated Proton. Acc. Chem. Res. 2012, 45, 101–109. 10.1021/ar200140h. [DOI] [PubMed] [Google Scholar]
- Swanson J. M. J.; Maupin C. M.; Chen H. N.; Petersen M. K.; Xu J. C.; Wu Y. J.; Voth G. A. Proton solvation and transport in aqueous and biomolecular systems: Insights from computer simulations. J. Phys. Chem. B 2007, 111, 4300–4314. 10.1021/jp070104x. [DOI] [PMC free article] [PubMed] [Google Scholar]
- Engh A. M.; Maduke M. Cysteine Accessibility in ClC-0 Supports Conservation of the ClC Intracellular Vestibule. J. Gen. Physiol. 2005, 125, 601–617. 10.1085/jgp.200509258. [DOI] [PMC free article] [PubMed] [Google Scholar]
- Zhang X.-D.; Li Y.; Yu W.-P.; Chen T.-Y. Roles of K149, G352, and H401 in the Channel Functions of ClC-0: Testing the Predictions from Theoretical Calculations. J. Gen. Physiol. 2006, 127, 435–447. 10.1085/jgp.200509460. [DOI] [PMC free article] [PubMed] [Google Scholar]
- Chen T. Y. Structure and function of ClC channels. Annu. Rev. Physiol. 2005, 67, 809–839. 10.1146/annurev.physiol.67.032003.153012. [DOI] [PubMed] [Google Scholar]
- Estevez R.; Jentsch T. J. CLC chloride channels: correlating structure with function. Curr. Opin. Struct. Biol. 2002, 12, 531–539. 10.1016/S0959-440X(02)00358-5. [DOI] [PubMed] [Google Scholar]
- Jentsch T. J. CLC chloride channels and transporters: from genes to protein structure, pathology and physiology. Crit. Rev. Biochem. Mol. Biol. 2008, 43, 3–36. 10.1080/10409230701829110. [DOI] [PubMed] [Google Scholar]
- Accardi A.; Miller C. Secondary active transport mediated by a prokaryotic homologue of ClC Cl– channels. Nature 2004, 427, 803–807. 10.1038/nature02314. [DOI] [PubMed] [Google Scholar]
- Miller C.; Nguitragool W. A provisional transport mechanism for a chloride channel-type Cl–/H+ exchanger. Philos. Trans. R. Soc., B 2009, 364, 175–180. 10.1098/rstb.2008.0138. [DOI] [PMC free article] [PubMed] [Google Scholar]
- Wikstrom M. K. F. Proton Pump Coupled to Cytochrome-C Oxidase in Mitochondria. Nature 1977, 266, 271–273. 10.1038/266271a0. [DOI] [PubMed] [Google Scholar]
- FergusonMiller S.; Babcock G. T. Heme/copper terminal oxidases. Chem. Rev. 1996, 96, 2889–2907. 10.1021/cr950051s. [DOI] [PubMed] [Google Scholar]
- Kaila V. R.; Verkhovsky M. I.; Wikstrom M. Proton-Coupled Electron Transfer in Cytochrome Oxidase. Chem. Rev. 2010, 110, 7062–7081. 10.1021/cr1002003. [DOI] [PubMed] [Google Scholar]
- Wikström M.; Sharma V.; Kaila V. R. I.; Hosler J. P.; Hummer G. New Perspectives on Proton Pumping in Cellular Respiration. Chem. Rev. 2015, 115, 2196. 10.1021/cr500448t. [DOI] [PubMed] [Google Scholar]
- Pringle C. R. Virus Taxonomy. Arch. Virol. 1999, 144, 421–429. 10.1007/s007050050515. [DOI] [PMC free article] [PubMed] [Google Scholar]
- Wang C.; Holsinger L. J.; Lamb R. A.; Pinto L. H. The M2 Protein of Influenza-a Virus Forms an Ion-Channel in Mammalian-Cells. Biophys. J. 1994, 66, A350. [Google Scholar]
- Wang D.; Voth G. A. Proton Transport Pathway in the CIC Cl–/H+ Antiporter. Biophys. J. 2009, 97, 121–131. 10.1016/j.bpj.2009.04.038. [DOI] [PMC free article] [PubMed] [Google Scholar]
- Zhang Y.; Voth G. A. The Coupled Proton Transport in the ClC-ec1 Cl–/H+ Antiporter. Biophys. J. 2011, 101, L47–L49. 10.1016/j.bpj.2011.10.021. [DOI] [PMC free article] [PubMed] [Google Scholar]
- Yamashita T.; Voth G. A. Properties of Hydrated Excess Protons near Phospholipid Bilayers. J. Phys. Chem. B 2010, 114, 592–603. 10.1021/jp908768c. [DOI] [PubMed] [Google Scholar]
- Lee H. J.; Svahn E.; Swanson J. M. J.; Lepp H.; Voth G. A.; Brzezinski P.; Gennis R. B. Intricate Role of Water in Proton Transport through Cytochrome c Oxidase. J. Am. Chem. Soc. 2010, 132, 16225–16239. 10.1021/ja107244g. [DOI] [PMC free article] [PubMed] [Google Scholar]
- Liang R.; Li H.; Swanson J. M. J.; Voth G. A. Multiscale simulation reveals a multifaceted mechanism of proton permeation through the influenza A M2 proton channel. Proc. Natl. Acad. Sci. U. S. A. 2014, 111, 9396–9401. 10.1073/pnas.1401997111. [DOI] [PMC free article] [PubMed] [Google Scholar]
- Yamashita T.; Voth G. A. Insights into the mechanism of proton transport in cytochrome c oxidase. J. Am. Chem. Soc. 2012, 134, 1147–1152. 10.1021/ja209176e. [DOI] [PMC free article] [PubMed] [Google Scholar]
- Goyal P.; Lu J.; Yang S.; Gunner M. R.; Cui Q. Changing hydration level in an internal cavity modulates the proton affinity of a key glutamate in cytochrome c oxidase. Proc. Natl. Acad. Sci. U. S. A. 2013, 110, 18886–18891. 10.1073/pnas.1313908110. [DOI] [PMC free article] [PubMed] [Google Scholar]
- Peng Y.; Swanson J. M. J.; Kang S.-g.; Zhou R.; Voth G. A. Hydrated Excess Protons Can Create Their Own Water Wires. J. Phys. Chem. B 2015, 119, 9212–9218. 10.1021/jp5095118. [DOI] [PMC free article] [PubMed] [Google Scholar]
- Bulo R. E.; Ensing B.; Sikkema J.; Visscher L. Toward a Practical Method for Adaptive QM/MM Simulations. J. Chem. Theory Comput. 2009, 5, 2212–2221. 10.1021/ct900148e. [DOI] [PubMed] [Google Scholar]
- Park K.; Gotz A. W.; Walker R. C.; Paesani F. Application of Adaptive QM/MM Methods to Molecular Dynamics Simulations of Aqueous Systems. J. Chem. Theory Comput. 2012, 8, 2868–2877. 10.1021/ct300331f. [DOI] [PubMed] [Google Scholar]
- Mones L.; Jones A.; Gotz A. W.; Laino T.; Walker R. C.; Leimkuhler B.; Csanyi G.; Bernstein N. The Adaptive Buffered Force QM/MM Method in the CP2K and AMBER Software Packages. J. Comput. Chem. 2015, 36, 633–648. 10.1002/jcc.23839. [DOI] [PMC free article] [PubMed] [Google Scholar]
- Knight C.; Lindberg G. E.; Voth G. A. Multiscale reactive molecular dynamics. J. Chem. Phys. 2012, 137, 22A525. 10.1063/1.4743958. [DOI] [PMC free article] [PubMed] [Google Scholar]
- Yamashita T.; Peng Y.; Knight C.; Voth G. A. Computationally Efficient Multiconfigurational Reactive Molecular Dynamics. J. Chem. Theory Comput. 2012, 8, 4863–4875. 10.1021/ct3006437. [DOI] [PMC free article] [PubMed] [Google Scholar]
- Schmitt U. W.; Voth G. A. The computer simulation of proton transport in water. J. Chem. Phys. 1999, 111, 9361–9381. 10.1063/1.480032. [DOI] [Google Scholar]
- Wu Y. J.; Chen H. N.; Wang F.; Paesani F.; Voth G. A. An improved multistate empirical valence bond model for aqueous proton solvation and transport. J. Phys. Chem. B 2008, 112, 467–482. 10.1021/jp076658h. [DOI] [PubMed] [Google Scholar]
- Nelson J. G.; Peng Y.; Silverstein D. W.; Swanson J. M. J. Multiscale Reactive Molecular Dynamics for Absolute pK(a) Predictions and Amino Acid Deprotonation. J. Chem. Theory Comput. 2014, 10, 2729–2737. 10.1021/ct500250f. [DOI] [PMC free article] [PubMed] [Google Scholar]
- Akin-Ojo O.; Song Y.; Wang F. Developing ab initio quality force fields from condensed phase quantum-mechanics/molecular-mechanics calculations through the adaptive force matching method. J. Chem. Phys. 2008, 129, 064108. 10.1063/1.2965882. [DOI] [PubMed] [Google Scholar]
- Wang F.; Akin-Ojo O.; Pinnick E.; Song Y. Approaching post-Hartree–Fock quality potential energy surfaces with simple pair-wise expressions: parameterising point-charge-based force fields for liquid water using the adaptive force matching method. Mol. Simul. 2011, 37, 591–605. 10.1080/08927022.2011.565759. [DOI] [Google Scholar]
- Zhou Y.; Pu J. Reaction Path Force Matching: A New Strategy of Fitting Specific Reaction Parameters for Semiempirical Methods in Combined QM/MM Simulations. J. Chem. Theory Comput. 2014, 10, 3038–3054. 10.1021/ct4009624. [DOI] [PubMed] [Google Scholar]
- MacKerell A. D.; Bashford D.; Bellott M.; Dunbrack R. L.; Evanseck J. D.; Field M. J.; Fischer S.; Gao J.; Guo H.; Ha S.; Joseph-McCarthy D.; Kuchnir L.; Kuczera K.; Lau F. T. K.; Mattos C.; Michnick S.; Ngo T.; Nguyen D. T.; Prodhom B.; Reiher W. E.; Roux B.; Schlenkrich M.; Smith J. C.; Stote R.; Straub J.; Watanabe M.; Wiórkiewicz-Kuczera J.; Yin D.; Karplus M. All-Atom Empirical Potential for Molecular Modeling and Dynamics Studies of Proteins. J. Phys. Chem. B 1998, 102, 3586–3616. 10.1021/jp973084f. [DOI] [PubMed] [Google Scholar]
- Akin-Ojo O.; Wang F. Improving the Point-Charge Description of Hydrogen Bonds by Adaptive Force Matching. J. Phys. Chem. B 2009, 113, 1237–1240. 10.1021/jp809324x. [DOI] [PubMed] [Google Scholar]
- Day T. J. F.; Soudackov A. V.; Čuma M.; Schmitt U. W.; Voth G. A. A second generation multistate empirical valence bond model for proton transport in aqueous systems. J. Chem. Phys. 2002, 117, 5839–5849. 10.1063/1.1497157. [DOI] [Google Scholar]
- Biswas R.; Tse Y.-L. S.; Tokmakoff A.; Voth G. A. Role of Pre-Solvation and Anharmonicity in Aqueous Phase Hydrated Proton Solvation and Transport. J. Phys. Chem. B 2015, 10.1021/acs.jpcb.5b09466. [DOI] [PubMed] [Google Scholar]
- Lee S.; Swanson J. M. J.; Voth G. A.. Multiscale simulations reveal the proton transport mechanism in the ClC-ec1 antiporter. Biophys. J. 2015, submitted for publication [DOI] [PMC free article] [PubMed]
- Laino T.; Mohamed F.; Laio A.; Parrinello M. An efficient linear-scaling electrostatic coupling for treating periodic boundary conditions in QM/MM simulations. J. Chem. Theory Comput. 2006, 2, 1370–1378. 10.1021/ct6001169. [DOI] [PubMed] [Google Scholar]
- Laino T.; Mohamed F.; Laio A.; Parrinello M. An efficient real space multigrid OM/MM electrostatic coupling. J. Chem. Theory Comput. 2005, 1, 1176–1184. 10.1021/ct050123f. [DOI] [PubMed] [Google Scholar]
- Blochl P. E. Electrostatic Decoupling of Periodic Images of Plane-Wave-Expanded Densities and Derived Atomic Point Charges. J. Chem. Phys. 1995, 103, 7422–7428. 10.1063/1.470314. [DOI] [Google Scholar]
- Maseras F.; Morokuma K. Imomm - a New Integrated Ab-Initio Plus Molecular Mechanics Geometry Optimization Scheme of Equilibrium Structures and Transition-States. J. Comput. Chem. 1995, 16, 1170–1179. 10.1002/jcc.540160911. [DOI] [Google Scholar]
- Becke A. D. Density-Functional Exchange-Energy Approximation with Correct Asymptotic-Behavior. Phys. Rev. A: At., Mol., Opt. Phys. 1988, 38, 3098–3100. 10.1103/PhysRevA.38.3098. [DOI] [PubMed] [Google Scholar]
- Lee C. T.; Yang W. T.; Parr R. G. Development of the Colle-Salvetti Correlation-Energy Formula into a Functional of the Electron-Density. Phys. Rev. B: Condens. Matter Mater. Phys. 1988, 37, 785–789. 10.1103/PhysRevB.37.785. [DOI] [PubMed] [Google Scholar]
- Grimme S.; Antony J.; Ehrlich S.; Krieg H. A consistent and accurate ab initio parametrization of density functional dispersion correction (DFT-D) for the 94 elements H-Pu. J. Chem. Phys. 2010, 132, 154104. 10.1063/1.3382344. [DOI] [PubMed] [Google Scholar]
- Lippert G.; Hutter J.; Parrinello M. A hybrid Gaussian and plane wave density functional scheme. Mol. Phys. 1997, 92, 477–487. 10.1080/00268979709482119. [DOI] [Google Scholar]
- Hartwigsen C.; Goedecker S.; Hutter J. Relativistic separable dual-space Gaussian pseudopotentials from H to Rn. Phys. Rev. B: Condens. Matter Mater. Phys. 1998, 58, 3641–3662. 10.1103/PhysRevB.58.3641. [DOI] [PubMed] [Google Scholar]
- Muhlenbein H.; Schlierkamp-Voosen D. Predictive Models for the Breeder Genetic Algorithm I. Continuous Parameter Optimization. Evol. Comput. 1993, 1, 25–49. 10.1162/evco.1993.1.1.25. [DOI] [Google Scholar]
- Plimpton S. Fast Parallel Algorithms for Short-Range Molecular Dynamics. J. Comput. Phys. 1995, 117, 1–19. 10.1006/jcph.1995.1039. [DOI] [Google Scholar]
- Tribello G. A.; Bonomi M.; Branduardi D.; Camilloni C.; Bussi G. PLUMED 2: New feathers for an old bird. Comput. Phys. Commun. 2014, 185, 604–613. 10.1016/j.cpc.2013.09.018. [DOI] [Google Scholar]
- VandeVondele J.; Krack M.; Mohamed F.; Parrinello M.; Chassaing T.; Hutter J. QUICKSTEP: Fast and accurate density functional calculations using a mixed Gaussian and plane waves approach. Comput. Phys. Commun. 2005, 167, 103–128. 10.1016/j.cpc.2004.12.014. [DOI] [Google Scholar]
- Konig P. H.; Ghosh N.; Hoffmann M.; Elstner M.; Tajkhorshid E.; Frauenheim T.; Cui Q. Toward theoretical analyis of long-range proton transfer kinetics in biomolecular pumps. J. Phys. Chem. A 2006, 110, 548–563. 10.1021/jp052328q. [DOI] [PMC free article] [PubMed] [Google Scholar]
- Riccardi D.; Konig P.; Prat-Resina X.; Yu H. B.; Elstner M.; Frauenheim T.; Cui Q. ″Proton holes″ in long-range proton transfer reactions in solution and enzymes: A theoretical analysis. J. Am. Chem. Soc. 2006, 128, 16302–16311. 10.1021/ja065451j. [DOI] [PMC free article] [PubMed] [Google Scholar]
- Kumar S.; Rosenberg J. M.; Bouzida D.; Swendsen R. H.; Kollman P. A. THE weighted histogram analysis method for free-energy calculations on biomolecules. I. The method. J. Comput. Chem. 1992, 13, 1011–1021. 10.1002/jcc.540130812. [DOI] [Google Scholar]
- Laio A.; Parrinello M. Escaping free-energy minima. Proc. Natl. Acad. Sci. U. S. A. 2002, 99, 12562–12566. 10.1073/pnas.202427399. [DOI] [PMC free article] [PubMed] [Google Scholar]
- Zhang Y.; Voth G. A. Combined Metadynamics and Umbrella Sampling Method for the Calculation of Ion Permeation Free Energy Profiles. J. Chem. Theory Comput. 2011, 7, 2277–2283. 10.1021/ct200100e. [DOI] [PMC free article] [PubMed] [Google Scholar]
- Becke A. D. Density-Functional Thermochemistry 0.3. The Role of Exact Exchange. J. Chem. Phys. 1993, 98, 5648–5652. 10.1063/1.464913. [DOI] [Google Scholar]
- Klauda J. B.; Venable R. M.; Freites J. A.; O’Connor J. W.; Tobias D. J.; Mondragon-Ramirez C.; Vorobyov I.; MacKerell A. D.; Pastor R. W. Update of the CHARMM All-Atom Additive Force Field for Lipids: Validation on Six Lipid Types. J. Phys. Chem. B 2010, 114, 7830–7843. 10.1021/jp101759q. [DOI] [PMC free article] [PubMed] [Google Scholar]
- Liang R.; Swanson J. M. J.; Peng Y.; Nelson J. G.; Wikström M.; Voth G. A.. Multiscale simulations reveal the proton pumping mechanism in cytochrome c oxidase. Proc. Natl. Acad. Sci. U. S. A. 2015, submitted for publication [DOI] [PMC free article] [PubMed]
- Elstner M.; Porezag D.; Jungnickel G.; Elsner J.; Haugk M.; Frauenheim T.; Suhai S.; Seifert G. Self-consistent-charge density-functional tight-binding method for simulations of complex materials properties. Phys. Rev. B: Condens. Matter Mater. Phys. 1998, 58, 7260–7268. 10.1103/PhysRevB.58.7260. [DOI] [Google Scholar]
- Cui Q.; Elstner M.; Kaxiras E.; Frauenheim T.; Karplus M. A QM/MM implementation of the self-consistent charge density functional tight binding (SCC-DFTB) method. J. Phys. Chem. B 2001, 105, 569–585. 10.1021/jp0029109. [DOI] [Google Scholar]
- Riccardi D.; Schaefer P.; Cui Q. pK(a) calculations in solution and proteins with QM/MM free energy perturbation simulations: A quantitative test of QM/MM protocols. J. Phys. Chem. B 2005, 109, 17715–17733. 10.1021/jp0517192. [DOI] [PubMed] [Google Scholar]
- Liang R.; Swanson J. M. J.; Voth G. A. Benchmark Study of the SCC-DFTB Approach for a Biomolecular Proton Channel. J. Chem. Theory Comput. 2014, 10, 451–462. 10.1021/ct400832r. [DOI] [PMC free article] [PubMed] [Google Scholar]
- Brooks B. R.; Brooks C. L.; Mackerell A. D.; Nilsson L.; Petrella R. J.; Roux B.; Won Y.; Archontis G.; Bartels C.; Boresch S.; Caflisch A.; Caves L.; Cui Q.; Dinner A. R.; Feig M.; Fischer S.; Gao J.; Hodoscek M.; Im W.; Kuczera K.; Lazaridis T.; Ma J.; Ovchinnikov V.; Paci E.; Pastor R. W.; Post C. B.; Pu J. Z.; Schaefer M.; Tidor B.; Venable R. M.; Woodcock H. L.; Wu X.; Yang W.; York D. M.; Karplus M. CHARMM: The Biomolecular Simulation Program. J. Comput. Chem. 2009, 30, 1545–1614. 10.1002/jcc.21287. [DOI] [PMC free article] [PubMed] [Google Scholar]
- Riistama S.; Hummer G.; Puustinen A.; Dyer R. B.; Woodruff W. H.; Wikstrom M. Bound water in the proton translocation mechanism of the haem-copper oxidases. FEBS Lett. 1997, 414, 275–280. 10.1016/S0014-5793(97)01003-X. [DOI] [PubMed] [Google Scholar]
- Wikstrom M.; Verkhovsky M. I.; Hummer G. Water-gated mechanism of proton translocation by cytochrome c oxidase. Biochim. Biophys. Acta, Bioenerg. 2003, 1604, 61–65. 10.1016/S0005-2728(03)00041-0. [DOI] [PubMed] [Google Scholar]
- Tuukkanen A.; Kaila V. R. I.; Laakkonen L.; Hummer G.; Wikstrom M. Dynamics of the glutamic acid 242 side chain in cytochrome c oxidase. Biochim. Biophys. Acta, Bioenerg. 2007, 1767, 1102–1106. 10.1016/j.bbabio.2007.06.010. [DOI] [PubMed] [Google Scholar]
- Sharma V.; Enkavi G.; Vattulainen I.; Róg T.; Wikström M. Proton-coupled electron transfer and the role of water molecules in proton pumping by cytochrome c oxidase. Proc. Natl. Acad. Sci. U. S. A. 2015, 112, 2040–2045. 10.1073/pnas.1409543112. [DOI] [PMC free article] [PubMed] [Google Scholar]
- Ghosh N.; Prat-Resina X.; Gunner M. R.; Cui Q. Microscopic pKa Analysis of Glu286 in Cytochrome c Oxidase (Rhodobacter sphaeroides): Toward a Calibrated Molecular Model. Biochemistry 2009, 48, 2468–2485. 10.1021/bi8021284. [DOI] [PubMed] [Google Scholar]
- Maupin C. M.; Wong K. F.; Soudackov A. V.; Kim S.; Voth G. A. A Multistate Empirical Valence Bond Description of Protonatable Amino Acids. J. Phys. Chem. A 2006, 110, 631–639. 10.1021/jp053596r. [DOI] [PubMed] [Google Scholar]
- Maupin C. M.; McKenna R.; Silverman D. N.; Voth G. A. Elucidation of the Proton Transport Mechanism in Human Carbonic Anhydrase II. J. Am. Chem. Soc. 2009, 131, 7598–7608. 10.1021/ja8091938. [DOI] [PMC free article] [PubMed] [Google Scholar]