Abstract
Structural analysis and visualization of protein-protein interactions is a challenging task since it is difficult to appreciate easily the extent of all contacts made by the residues forming the interfaces. In the case of viruses, structural analysis becomes even more demanding because several interfaces coexist and, in most cases, these are formed by hundreds of contacting residues that belong to multiple interacting coat proteins. CapsidMaps is an interactive analysis and visualization tool that is designed to benefit the structural virology community. Developed as an improved extension of the φ-ψ Explorer, here we describe the details of its design and implementation. We present results of analysis of a spherical virus to showcase the features and utility of the new tool. CapsidMaps also facilitates the comparison of quaternary interactions between two spherical virus particles by computing a similarity (S)-score. The tool can also be used to identify residues that are solvent exposed and in the process of locating antigenic epitope regions as well as residues forming the inside surface of the capsid that interact with the nucleic acid genome. CapsidMaps is part of the VIPERdb Science Gateway, and is freely available as a web-based and cross-browser compliant application at http://viperdb.scripps.edu.
Keywords: viral capsids, quaternary interactions, web interface, heat maps, similarity score
INTRODUCTION
Viruses are macromolecular machines made up of nucleo-protein components. Multiple copies of one or a few kinds of coat proteins (CPs) must assemble into symmetric closed shells (capsids), encapsulating their own genome in order to form a functional viral particle. In this respect, viral capsids provide an excellent resource for studying protein-protein interaction mechanisms in homo-oligomers that form symmetric closed shells as well as protein-nucleic acid interactions. In the case of virus capsids that self-assemble, this occurs rapidly and spontaneously with a high degree of fidelity. It is reasonable to assume that the self-assembly process require “molecular recognition signals” that are encoded into sequence and structure of the coat proteins in order to form the final virus particle. These molecular recognition signals are important for the initial nucleation and subsequent assembly. Identification of these signals could be the key to understand viral assembly, and possibly, macromolecular assembly in general. Nature and extent of these interactions between the coat protein subunits determine the size and the robustness of the capsid. Furthermore, analysis of protein-protein interactions at the CP subunit interfaces may provide insights into different assembly mechanisms involved in spontaneous self-assembly vs. those that might require auxiliary proteins.
Here, we refer to an “interaction pattern” as the specific spatial arrangement of CP subunit interface residues for a particular spherical capsid. Interface residues are defined by a distance based criteria, calculated for all residues in all subunits in an assembled capsid. Once identified, each residue forming the interaction pattern can be further characterized by the number of close contacts it makes with neighboring subunits, its buried surface area, or its sequence identity among members of the same virus family. In addition, the triangulation number (T) is a parameter used to describe how the CPs arrange among themselves in spherical viruses that display icosahedral symmetry. It usually refers to the number of unique/distinct structural environments, or often the number of coat protein subunits present in one of the icosahedral asymmetric units (IAUs, each one being 1/60th of an icosahedron), as described by Caspar and Klug1. A number of icosahedral capsids have been structurally characterized at high resolution, displaying a diversity of geometric architectures having T numbers equal to 1, 3, 4, 7, 13 and above (see Figure 1 for an example of the first three).
Figure 1.
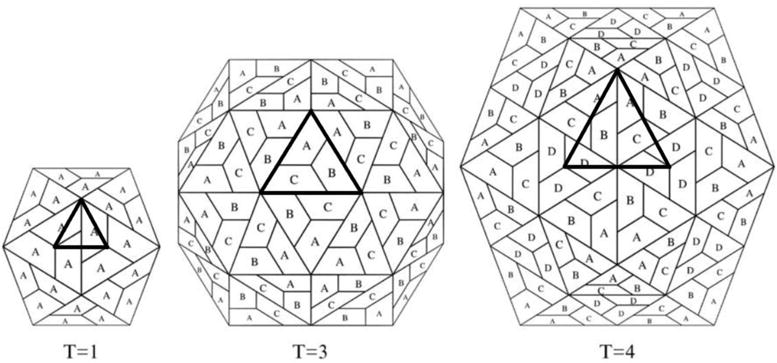
Schematic representation of T=1, T=3, and T=4 icosahedral lattices. Each trapezoid corresponds to an independent subunit. In the case of T=1 capsids, all the subunits occupy an equivalent environment, namely A, whereas in T>1 capsids, subunits occupy three, four or more distinct environments (in this case A, B, C, or D). The central icosahedral asymmetric unit is highlighted in each case. Adapted from Reddy et al.15.
The simplest spherical viruses that display icosahedral symmetry are built by 60 copies of the same coat protein coming from a single gene product and occupy identical environments. More complex and larger capsids are composed of 60×T CPs (e.g., 120, 180, 240, 420, etc.), although 120 subunit capsids (e.g., inner capsids of reoviruses) do not conform to canonical Caspar and Klug formulation of quasi-equivalence1. In the cases where T>1, the CPs that occupy an IAU are arranged in quasi-equivalent environments. Interestingly, even within a category of capsids having the same T number (e.g., T=3), there could be significant variations in subunit associations when forming the respective capsids2.
To date, there are 271 unique three dimensional capsid structures known at atomic resolution, from 38 virus families and 73 genera. This dataset is curated and deposited at VIPERdb, a Science Gateway specialized in structural virology3. VIPERdb is supported by a relational database with a web interface, specifically designed for the analysis and visualization of icosahedral virus capsid structures. VIPERdb has become the global reference in the field as a comprehensive resource for the virology community, with an emphasis on the description and comparison of derived data from structural and computational analyses of virus capsids.
A novel methodology to map the location of residues involved in subunit–subunit interactions has been previously described4. These normalized diagrams proved to be useful as roadmaps for the visualization of the density, distribution and characteristics of the residues at the sub-unit interfaces. A preliminary implementation of this methodology was reported in the framework of VIPERdb, namely, the φ-ψ Explorer3. Although basic functionality was achieved, several efficiency improvements and analysis additions have been implemented since. Evolution of web technologies in recent years has allowed the development of CapsidMaps, an improved and updated extension to the φ-ψ Explorer visualization and analysis capabilities. Here we describe the design and implementation specific details of CapsidMaps, and present results of the analysis of a spherical virus to showcase the power of the new tool.
MATERIALS AND METHODS
The φ-ψ space representation
Azimuthal polar orthographic diagrams, or APODs, are simplified two dimensional representations of a three dimensional macromolecular virus structure4. APODs are made by projecting the capsid protein residues onto a unit sphere and then mapping to a plane using a mathematical transformation. Given the spherical nature of icosahedral virus capsids, the three dimensional Cartesian coordinates R(x, y, z) of the center of mass of each residue can also be represented in Spherical coordinates R(r, φ, ψ) using the set of equations
| (1) |
| (2) |
| (3) |
where r is the magnitude of the vector pointing to the center of mass of a protein residue, φ is the azimuthal angle between the X axis and the projection of into the XY plane (analogous to a longitude), and ψ is the polar angle between the Z axis and (analogous to a latitude). Each vector is first scaled into a unit vector, leaving all points lying on the surface of a unit sphere. A two dimensional map can be created by making an azimuthal polar orthographic projection onto a tangential plane to the sphere. This map represents the view of the sphere seen from the top of one of the poles, with the φ angle starting at 0° at the positive X axis growing counterclockwise up to 360° after a full turn, and the ψ angle starting at 0° at the center of the map growing in concentric circles up to 90° at the sphere’s equator (Figure 2).
Figure 2.
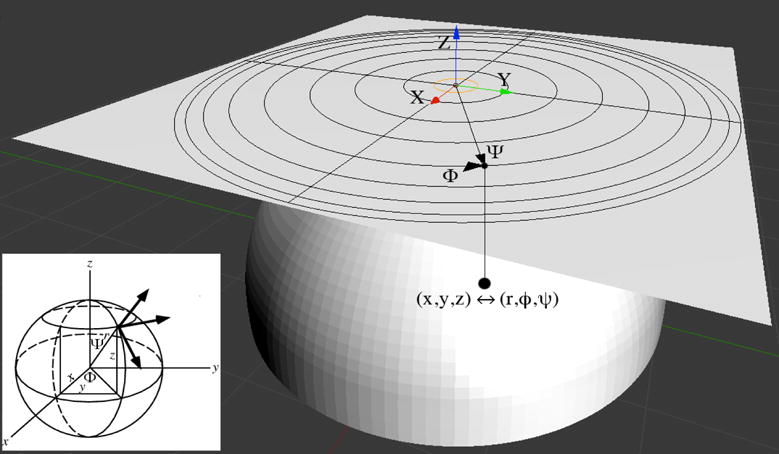
Coordinate system transformation and polar azimuthal orthographic projection of the center of mass of a protein residue. Every coat protein residue is represented as a point in space (black dots). Cartesian coordinates (x, y, z) are transformed into an spherical system (r, φ, ψ), setting, leaving all residues lying on the surface of a unit sphere. An orthogonal projection (parallel to the Z axis) onto a tangential plane through the north pole is then applied, ending up with a two dimensional φ-ψ polar map representation of the relative position of all coat protein residues.
This method provides a unique advantage by mapping residue locations onto the same central IAU representation, irrespective of the capsid size or T-number, since all asymmetric units are equivalent to each other, allowing the comparison between different viruses. However, the comparison of two viruses within a particular family and with the same T number gives most meaningful results. Furthermore, this methodology allows to selectively map residues located only at specific protein regions, i. e., at the inter-subunit interfaces, the core of the proteins, the protein-nucleic acid interface or the solvent exposed residues. This provides a way to compare interactions of two or more spherical capsids, as well as to quantitatively estimate and visually assess the extent of quaternary similarities. This method also highlights the density and distribution of protein-protein interactions with respect to the icosahedral symmetry axes in spherical space. Employing this methodology, answers to specific questions like “what residues in the Black Beetle Virus are conserved among all members of the Nodavirus family and have contacts near the 5-fold symmetry axis?”, or “what is the most abundant charged amino acid type on the outside surface among all the members of the Leviviridae family?”, can be easily found.
Similarity score
Quantifying the similarity between the quaternary structure present in an IAU of two different spherical capsids is useful when trying to compare and contrast protein-protein interfaces. The S-score is a metric of similarity between the subunit interfaces of two viruses taking into account the subunit quaternary contacts4. It is defined as twice the ratio of common locations of interactions normalized by the total number of points of interactions in both the capsids that are being compared. The value of the S-score for a pair of viruses with identical subunit interfaces will be 1, decreasing up to 0 as the comparison diverges. In this way, the S-score is a valuable metric to quantitatively assess the similarity in quaternary interactions and subunit environments between two capsids. The S-score accurately identifies quaternary structure similarity, in comparison to other metrics which fail to discern details in the subunit interfaces (RMSD or TM-score). An analysis of spherical viral capsids in terms of the APODs and S-scores shows that the intra family or genus pair comparisons have S-scores values in the range of 1.0 to 0.6. On the other hand, inter family capsid pairs, which exhibit similar subunit folds and same capsid architecture (T-number) show S-scores values in the range of 0.6 to 0.3. Furthermore, capsid pairs with different T numbers will produce S-scores values below 0.34.
CapsidMaps: Polar φ-ψ maps implementation
Interactive tools developed for web browsers in recent years can be used to create interactive maps, instead of using static images. Mapping of residues of spherical viruses onto polar φ-ψ maps is analogous to mapping cities onto a two dimensional longitude-latitude world map. This naturally led to exploit existing application programming interfaces (APIs) used to interact with geographic data through a web browser, and use it to display polar φ-ψ maps of the locations of residues of the icosahedral virus capsid proteins. The Google Maps API allows developers to embed maps into web pages in several ways, for either simple use or extensive customization. With a few modifications to the libraries, Google Maps were adapted to the structural virology needs, taking advantage of its capabilities to develop the CapsidMaps tool, in this way offering an interactive way of displaying residue locations in φ-ψ space, as previously described3.
In its present optimized form, the CapsidMaps application is composed of different layers. An schematic of its architecture can be found in Figure 3. The VIPER relational data base is located at the foundation, with a server-side VIPERdb API layer functioning as a bridge for the client-side scripts to access data, which in turn uses the Google Maps API library to interactively build and display the maps. A description of the improved implementation follows.
Figure 3.
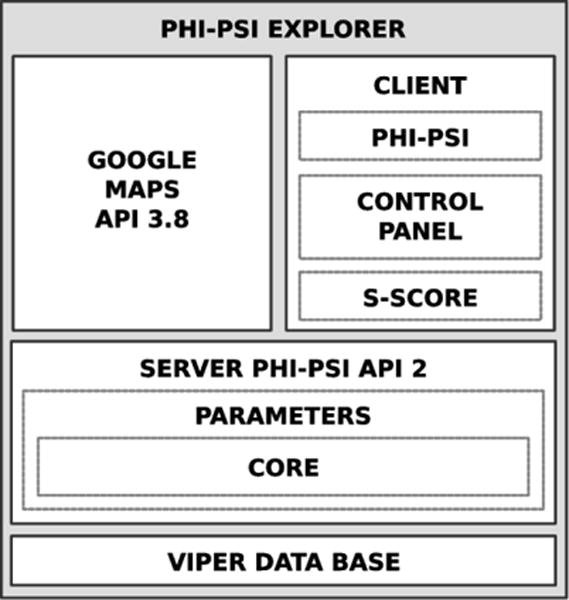
The CapsidMaps tool integrates several layers. The VIPER data base is at the foundation of the platform. The client layer communicates with the server layer to extract specific information from the data base. The client then displays the data dynamically using the Google Maps libraries.
Server-side API
Extensive or complex processing that requires execution of several SQL statements has been implemented into stored procedures, therefore optimizing data extraction and avoiding overhead and network traffic. With the use of the object oriented programing paradigm (OOP), all searches are made by a searchObj() class instance. In this model, specific queries are stored in the data base, so there is no need to send big requests. Instead, the interface makes calls to the right procedure. There are other class instances in charge of the communication between the core API and the data base, data manipulation, XML formatting and transferring of data. The use of OOP also gives the advantage of having a scalable and easily maintainable code.
Client-side component
This is the interface the browser downloads so the user can interact with the platform. It is responsible for all communications between the client and the server, interpretation of the XML formatted replies, manipulation of the φ-ψ maps through a control panel and the automatized calculation of the S-score.
Google Maps API
A brief summary of the library’s features related to the development of CapsidMaps is discussed here. Please refer to the Google Maps JavaScript API Developer’s Guide (https://developers.google.com/maps/documentation/javascript/tutorial) for more details. An upgrade to the Google Maps JavaScript API v3 was done with respect to the previous φ-ψ Explorer application. This represents several major improvements in terms of functionality, efficiency and usability. The new release supports the display and management of three custom map types: i) standard tile sets consisting of images which collectively constitute full maps, ii) image tile overlays that display on top of existing base map types, and iii) non-image map types which allows to manipulate the display of map information at its most fundamental level. CapsidMaps implements the later. The custom map relies on creating a class that implements a MapType interface. This interface specifies certain properties and methods that allow the API to initiate requests to the custom map type when it determines that it needs to display data within the current view port and zoom level. The client has to handle these requests to decide which data to load. Classes inheriting the MapType interface require several methods to be implemented and their properties defined and populated by the developer.
In order for the CapsidMaps application to display a capsid residue in the map (the screen), φ and ψ values have to be translated into a “world” coordinate system. This translation is accomplished using a map projection. Google Maps uses the Mercator projection to create maps from geographic data and convert events on the map into geographic coordinates. Hence, a custom projection method was written for CapsidMaps based on the google.maps.Projection interface, in order to display capsid structural data in a map. A Projection implementation must provide a bi-directional mapping mechanism, i. e., it has to have a definition on how to translate from capsid coordinates (φ-ψ) to the Projection’s world coordinate system, and vice versa. Google Maps assumes that projections are rectilinear. Each Projection provides two methods which translate between these two coordinate systems, allowing to convert between capsid and world coordinates:
The Projection.fromLatLngToPoint() method converts a φ-ψ pair into a world coordinate. This method is used to position overlays on the map (and to position the map itself).
The Projection.fromPointToLatLng() method converts a world coordinate into φ-ψ values. This method is used to convert events such as clicks that happen on the map into capsid coordinates.
In order to calculate pixel coordinates in a convenient way, the Google API assumes that a map at zoom level 0 is a single tile of the base tile size. Thus, world coordinates are defined relative to pixel coordinates, using the projection to convert φ and ψ values to pixel positions on this base tile. In this way, a world coordinate is independent of the current zoom level. World coordinates in Google Maps are measured from the projection’s origin (upper left corner) and increase in the X direction towards the right, and increase in the Y direction downwards. In other words, for zoom level 0 the pixel coordinates are equal to the world coordinates. The Maps API constructs a viewport given the zoom level center of the map and the size of the containing Document Object Model (DOM) element, usually defined with an HTML <div> tag, and translates this bounding box into pixel coordinates. At the end, the usable world coordinate space in the viewport has an area of ({0–256}, {0–256}) pixels.
Google Maps API V3 implements many new features and code optimizations in comparison to previous versions. Now it implements the Model-View-Controller architecture. The number of markers the application can handle has increased significantly through the use of the markerCluster class object, having the additional benefit to create density heat-maps (discussed later). Also, the Google API design is simpler, allowing the programmer to write less Javascript code for the client-side layer, decreasing network traffic.
RESULTS AND DISCUSSION
CapsidMaps features
The Black Beetle Virus (PDBID=2bbv, T=3) is chosen as an example to showcase the CapsidMaps application and its new functionalities. Once a particular virus is selected on VIPERdb, the polar CapsidMap can be accessed from the Info-Page, under the corresponding tab on the left menu. When the browser opens the Info-Page, all the data needed for the generation of a polar φ-ψ map is retrieved from the VIPERdb server through an application programming interface function call and delivered to the client in XML structured format, asynchronously updated using the AJAX technique. The CapsidMap is then populated with one marker for each protein residue returned, displaying them on a polar grid, with the origin at the center of the viewport. Following the φ-ψ Explorer definition, the φ angle grows counterclockwise from the right (0°–360°) and the ψ angle (0°–90°) grows radially outward (Figure 2). In addition to the position coordinates (r,φ,ψ), the structural information associated with each residue namely, amino acid type, sequence id, parent subunit, secondary structure, number of neighbor interactions, family sequence identity and solvent accessible surface area. The user interface is composed by the interactive polar φ-ψ map on the main display area, with a control panel on the right. Because of the features available in the Google maps API, the map itself transparently integrates all the interactive features that a regular Google map has, including zooming in or out, and dragging the display with the mouse in any direction. The control panel is composed of several sections, each one providing a specific set of options. On the View section the user can quickly switch from the current view to either the default view (zero level zoom) or the Q3F (quasi 3-fold) view, which is a zoomed in view of the central IAU down the quasi 3-fold axis of the reference asymmetric unit of the capsid. The Show and Hide section offers the option to independently display (on by default) or hide any of the individual elements on the map: coat protein subunits, the icosahedral asymmetric unit (represented by a triangular frame), or the heat-map. In addition, the user can select which specific group of residues to display for further analysis: interface, core, outside surface or inside surface. By default, all amino acid types are displayed, however, the user can select cand show one particular type from the drop-down select box in this section (Res. Type). In addition, the user can download relevant data of the currently displayed residues of interest on the CapsidMaps interface at any point during this selection process, through a function call on the Residue Info section. A separate page will open, showing a compiled list of residues with its corresponding information. This functionality is helpful when a deeper analysis of a capsid is needed, or a detailed comparison between two or more capsids is desired.
Interface, core and surface protein residues
All residues in the coat protein are grouped into four categories based on their three dimensional spatial location: interface, core, exterior surface or interior surface (Figure 4).
Figure 4.
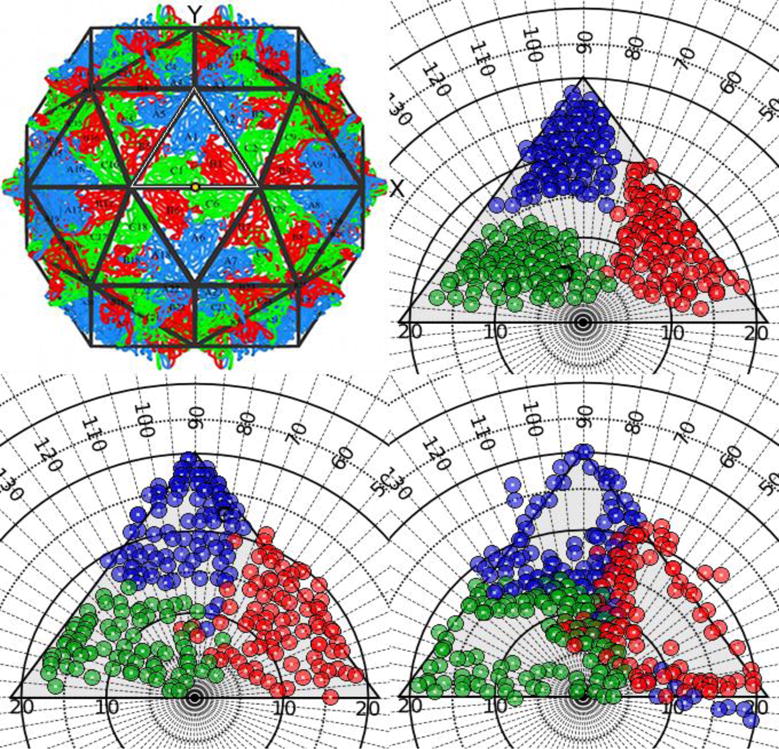
Black Beetle Virus spherical capsid (PDBID=2bbv, T=3). (Top left) Full capsid structure formed by 180 independent coat protein subunits, color coded according to their specific environment using a standard scheme; A in blue, B in red and C in green. The central icosahedral asymmetric unit (CIAU) is highlighted by a white triangle, showing where the North Pole would be in the unit sphere by a yellow dot. In this representation the positive X axis points right, and the positive Y axis points up. (Top right and Clockwise) Polar φ-ψ maps of the CIAU (represented by a triangular black frame), showing different regions of the coat proteins: Core, Interface and Solvent exposed. Symbols are colored according to the subunit they belong to.
The interface residues are displayed by default, the trail of interface residues form a distinctive interaction pattern that is unique to a specific virus or family of viruses. Any of the other three groups (core, exterior or interior surfaces) can be independently loaded into the CapsidMap by clicking on the corresponding control. Also by default, the markers are colored according to the parent subunit the residues belong to, using a standard color scheme. The IAU is depicted by a triangular frame, where the upper vertex represents the 5-fold axis and the other two vertices correspond to 3-fold axes of symmetry with a 2-fold axis located in between. The advantage of displaying structural data in this way is to facilitate the comparison of the capsid maps of different capsids. The core residues cluster together with high density, while the interface residues that are responsible for holding the capsid together surround the boundary of individual CPs. The localizations of the interface residues along the periphery of the subunits show the differences between the distinct quasi-equivalent environments. Furthermore, by visually inspecting the solvent exposed residues on the capsid one can search and identify the locations of antigenic epitopes and their relative proximity to other surface exposed regions.
Heat-maps
As mentioned previously, Google Maps API v3 has the ability to create heat-maps, according to the local marker density (Figure 5).
Figure 5.
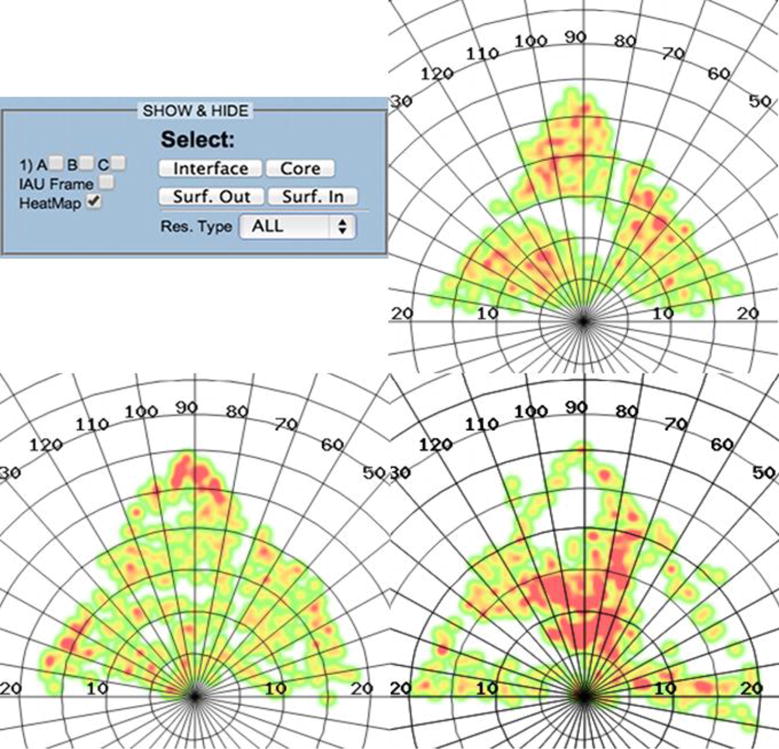
Black Beetle Virus heat-maps, color coded according to the local residue density; areas of higher density are colored red and areas of lower density appear green. (Top left) Control panel with options selected to hide all subunits and the CIAU, leaving the heat-map layer on. (Top right and Clockwise) φ-ψ heat-maps showing different regions of the coat proteins: Core, Interface and Solvent exposed.
This is a helpful representation for the analysis of viral capsids quaternary structure, since it gives information on where the highly populated interaction regions are located in the protein-protein interfaces (interaction patterns). For example, it is easy to visually identify important residue clusters which could be involved in the generation of nascent oligomers (dimers, trimers, etc.) that will eventually give rise to the whole macromolecular structure. Depiction of the heat-maps in the reference IAU frame could provide a novel and powerful way to study the self-assembly mechanism of viral particles in the future.
Sequence identity, degree of residue interaction, and buried surface area
The section Color by in the control panel offers the option to change the color-coding of the markers (Figure 6).
Figure 6.
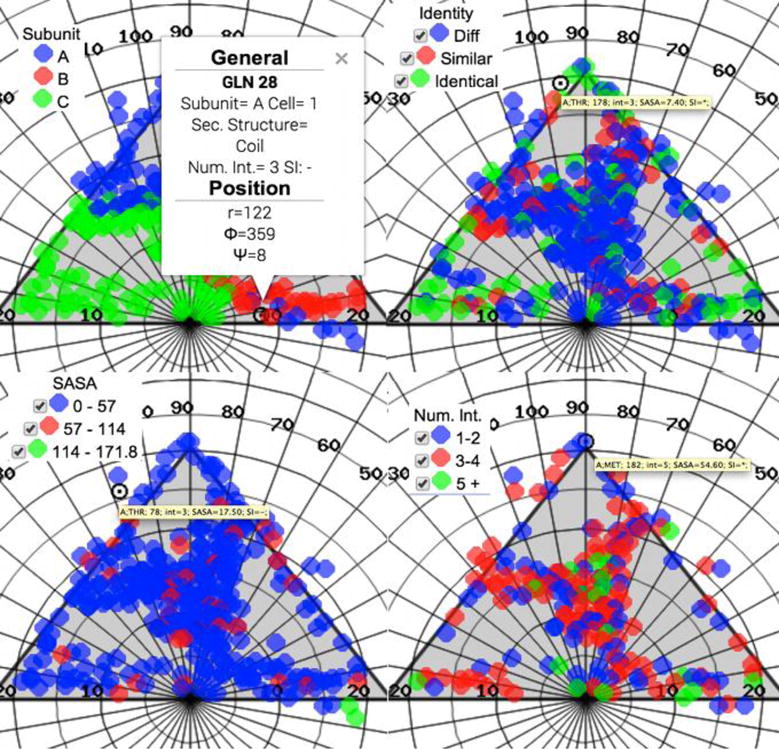
Black Beetle Virus Interface residues, color coded according to four different criteria: (Top left and Clockwise) Capsid environment type, Family sequence conservation, Number of interaction contacts per residue, and Solvent accessible surface area. When clicking on a particular marker, a balloon shows general information about the corresponding residue, and hovering over it shows a synthesis of the data.
The color-code currently being used is displayed at the far left, under the info-box. The default is to color the markers depending on the parent subunit the residues belong to and the local quaternary environment they are in. However, there are three other options to color-code the markers depending on the sequence identity, solvent accessible surface area (SASA) or buried surface area (BSA), or number of neighboring interactions each residue makes (when the interface residues are displayed). Sequence identity, i.e., the a.a. sequence conservation among members of the corresponding virus family, has been previously calculated through an intra-family multiple sequence alignment (IFMSA). The IFMSA calculation is based on the three dimensional structure multiple alignment between all structurally characterized members of a particular family. The results have been added to the VIPER database, from where they can be retrieved via an API procedure call. All the IFMSAs were computed with the package T-Coffee5, using a consensus of several pairwise structure alignment profiles built with SAP6, MUSTANG7 and TM-align8. The precomputed IFMSAs can also be downloaded from the VIPERdb server in clustalw format through a link in the Biodata tab. The power of this type of representation can be appreciated in the case of the Black Beetle Virus, where it can be seen that there is a high degree of sequence conservation near the axes of symmetry, implying a common assembly mechanism shared by all members of the Nodavirus family. The number of interactions of each interface residue makes with the neighboring subunits is calculated when the virus entry is deposited in VIPERdb, storing the results in the data base for later retrieval through a procedure call. The data set can be visualized by clicking on the corresponding button on the control panel. This information is useful to identify the location of residues that contribute the most in the network formed at the quaternary interfaces. In the case of the Black Beetle Virus, the distribution of these residues is not uniform along the borders of the coat proteins, but are rather concentrated in specific regions. Having a large number of interactions might imply that these residues could be responsible for the stability of the viral particle, pinpointing a putative target for capsid disruption.
Other quantities calculated when a new entry is deposited in VIPERdb are the related SASA and BSA. The later is used to estimate subunit association energies by multiplying its value by some solvation parameters9. This is done for each residue in the IAU, regardless of its classification inside the coat protein, and considering all neighboring subunits in the whole capsid. These values, first described by Lee and Richards10, and Rashin11, measure the degree of exposure to the solvent, or genome, a specific residue has (in Å2). The classic view of the meaning of such values is that the amount a residue is buried inside a protein, or a protein-protein interface, is important (the former being related to the stability of the protein fold and the latter to the formation of oligomers), since it has been shown that their values correlate to the folding or binding free energy12–14. This can clearly be observed in the case of the Black Beetle Virus, where the majority of the interface residues have SASA values close to zero, and equivalently large BSA values, implying an energetically stable capsid. Finally, and as discussed earlier, the CapsidMaps inherit all dynamic features that Google maps have. Clicking on an individual marker will pop up an Info-Window with relevant structural information about the corresponding coat protein residue: amino acid type, residue sequence number, type of secondary structure it belongs to, number of interactions made (if the residue belongs to an interface), residue BSA or SASA value (if the residue belongs to the core/interface or the exposed surface, respectively) and the residue exact position in spherical coordinates.
Quantitative comparisons: S-score
In order to measure the degree of similitude between the interaction patterns of two viruses (or the same virus in two different conditions if the structural data is available), the calculation of the S-score was implemented. The estimation of the S-score requires the manipulation of big matrices4, and even though its value is just the mathematical dot product between two of them, it can be a cumbersome computation. The CapsidMaps application facilitates this, by providing an interface to select a second virus entry on VIPERdb through the S-score section of the control panel. After the S-score has been calculated, its value is shown. Additionally, the residues of the second virus are displayed on the map, superimposed on top of the residues of the first virus. In order to make a clear distinction between the two data sets, markers of the second virus are colored gray. This provides a good way to quantitatively assess the quaternary similarity between two capsids (regardless of family or T number), but also to visually identify regions in space where differences might occur (Figure 7).
Figure 7.
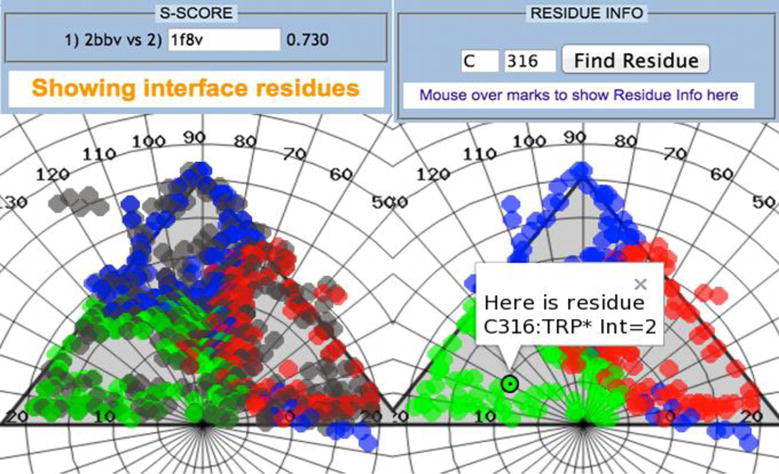
Black Beetle Virus interface residues, color coded according to the local subunit environment. (Left) The application has the ability to calculate the S-score between two capsids. Once a second virus is selected by its PDBID, the metrics value is displayed in the control panel. Additionally, residues of the second virus are also displayed on the map (gray color), allowing for the visual assessment of where main quaternary differences might be. (Right) Another added feature is the ability to search for a specific residue by specifying a subunit and a sequence id.
Searching for specific residues
Clicking or hovering over a marker will display information related to the corresponding residue in two ways: as a small balloon on the map or on an info-box on the Residue Info section of the control panel. Searching for a specific residue, however, can be difficult when the map is populated with a high number of markers. Therefore, the Residue Info section offers the option to quickly find a residue by entering the name of the parent subunit and the residue sequence id. When the user clicks on the corresponding button, an Info-Window (balloon) will pop up on the map, showing the location of such residue (Figure 7).
CONCLUSIONS
Here we show the use of the CapsidMaps application to visualize spherical virus structure derived data, proving to be a powerful way to analyze these macromolecular protein assemblies. This hybrid web application is a good example of how the unconventional use and integration of unrelated tools and datasets can break old paradigms, opening the door to further improve the way research is done. The case study used clearly demonstrates that the application is able to provide a novel approach that facilitates the study of complex systems. To the best of our knowledge, CapsidMaps is the first application of its kind in the field of structural virology. In conclusion, CapsidMaps is a sophisticated visualization and analysis tool which will potentially enhance our understanding of complex structural data sets, making it easier to discover patterns and relationships and to form hypotheses in the realm of structural virology.
Acknowledgments
This work was supported by the Consejo Nacional de Ciencia y Tecnología de México [grant number 132376 to M.C- T.] and the USA National Institutes of Health through the Center for Multi-Scale Modeling for Structural Biology [grant number RR012255 to C. L. B. III and V. R.]
Footnotes
Publisher's Disclaimer: This is a PDF file of an unedited manuscript that has been accepted for publication. As a service to our customers we are providing this early version of the manuscript. The manuscript will undergo copyediting, typesetting, and review of the resulting proof before it is published in its final citable form. Please note that during the production process errors may be discovered which could affect the content, and all legal disclaimers that apply to the journal pertain.
References
- 1.Caspar Dt, Klug A. Physical principles in the construction of regular viruses. 1st. Vol. 27. Press, Cold Spring Harbor Laboratory; 1962. [DOI] [PubMed] [Google Scholar]
- 2.Damodaran K, Reddy VS, Johnson JE, Brooks CL., III A general method to quantify quasi-equivalence in icosahedral viruses. Mol Biol. 2002;324:723–737. doi: 10.1016/s0022-2836(02)01138-5. [DOI] [PubMed] [Google Scholar]
- 3.Carrillo-Tripp M, Shepherd CM, Borelli IA, Venkataraman S, Natarajan P, Johnson JE, Brooks CL, Reddy VS. VIPERdb2: an enhanced and web API enabled relational database for structural virology. Nucleic Acids Res. 2009;37:D436–D442. doi: 10.1093/nar/gkn840. Database issue. [DOI] [PMC free article] [PubMed] [Google Scholar]
- 4.Carrillo-Tripp M, Brooks CL, Reddy VS. A novel method to map and compare protein-protein interactions in spherical viral capsids. Proteins. 2008;73(3):644–655. doi: 10.1002/prot.22088. [DOI] [PMC free article] [PubMed] [Google Scholar]
- 5.Notredame C, Higgins DG, Heringa J. T-Coffee: A novel method for fast and accurate multiple sequence alignment. Journal of molecular biology. 2000;302(1):205–217. doi: 10.1006/jmbi.2000.4042. [DOI] [PubMed] [Google Scholar]
- 6.Taylor WR, Flores TP, Orengo CA. Multiple protein structure alignment. Protein Science: A Publication of the Protein Society. 1994;3(10):1858–1870. doi: 10.1002/pro.5560031025. [DOI] [PMC free article] [PubMed] [Google Scholar]
- 7.Konagurthu AS, Whisstock JC, Stuckey PJ, Lesk AM. MUSTANG: a multiple structural alignment algorithm. Proteins: Structure, Function, and Bioinformatics. 2006;64(3):559–574. doi: 10.1002/prot.20921. [DOI] [PubMed] [Google Scholar]
- 8.Zhang Y, Skolnick J. TM-align: a protein structure alignment algorithm based on the TM-score. Nucleic acids research. 2005;33(7):2302–2309. doi: 10.1093/nar/gki524. [DOI] [PMC free article] [PubMed] [Google Scholar]
- 9.Horton N, Lewis M. Calculation of free energy of association for protein complexes. Protein Sci. 1992;1(1):169–181. doi: 10.1002/pro.5560010117. [DOI] [PMC free article] [PubMed] [Google Scholar]
- 10.Lee B, Richards FM. The interpretation of protein structures: estimation of static accessibility. Journal of molecular biology. 1971;55(3):379–383. doi: 10.1016/0022-2836(71)90324-x. [DOI] [PubMed] [Google Scholar]
- 11.Rashin AA. Buried surface area, conformational entropy, and protein stability. Biopolymers. 1984;23(8):1605–1620. doi: 10.1002/bip.360230813. [DOI] [PubMed] [Google Scholar]
- 12.Miller S, Lesk AM, Janin J, Chothia C. The accessible surface area and stability of oligomeric proteins. Nature. 1987;328(6133):834–836. doi: 10.1038/328834a0. [DOI] [PubMed] [Google Scholar]
- 13.Janin J, Miller S, Chothia C. Surface, subunit interfaces and interior of oligomeric proteins. J Mol Biol. 1988;204(1):155–164. doi: 10.1016/0022-2836(88)90606-7. [DOI] [PubMed] [Google Scholar]
- 14.Noskov SY, Lim C. Free Energy Decomposition of Protein-Protein Interactions. Biophysical Journal. 2001;81(2):737–750. doi: 10.1016/S0006-3495(01)75738-4. [DOI] [PMC free article] [PubMed] [Google Scholar]
- 15.Reddy VS, Johnson JE. Structure-derived insights into virus assembly. Advances in virus research. 2005;64(1):45–68. doi: 10.1016/S0065-3527(05)64003-1. [DOI] [PubMed] [Google Scholar]


