Abstract
If we are to fully understand the reasons that cells and tissues move and acquire their distinctive geometries during processes such as embryogenesis and wound healing, we will need detailed maps of the forces involved. One of the best current prospects for obtaining this information is force-from-images techniques such as CellFIT, the Cellular Force Inference Toolkit, whose various steps are discussed here. Like other current quasi-static approaches, this one assumes that cell shapes are produced by interactions between interfacial tensions and intracellular pressures. CellFIT, however, allows cells to have curvilinear boundaries, which can significantly improve inference accuracy and reduce noise sensitivity. The quality of a CellFIT analysis depends on how accurately the junction angles and edge curvatures are measured, and a software tool we describe facilitates determination and evaluation of this information. Special attention is required when edges are crenulated or significantly different in shape from a circular arc. Because the tension and pressure equations are overdetermined, a select number of edges can be removed from the analysis, and these might include edges that are poorly defined in the source image, too short to provide accurate angles or curvatures, or non-circular. The approach works well for aggregates with as many as 1000 cells, and introduced errors have significant effects on only a few adjacent cells. An understanding of these considerations will help CellFIT users to get the most out of this promising new technique.
Keywords: Force inference techniques, Force from shape methods, CellFIT, Cell mechanics, Cell shape, Morphogenetic forces, Interfacial tensions, Intracellular pressures
Introduction
One of the central current questions in biology is, “Why do cells move as they do, and how do they acquire their distinctive and often exacting forms?” It is now clear that cell-level mechanical forces are a key part of the answer to both parts of this important question (Chen, Brodland 2008, Brodland 2002, Brodland, Veldhuis et al. 2014, Chiou, Hufnagel et al. 2012, Ishihara, Sugimura 2012, Ishihara, Sugimura et al. 2013). Furthermore, as computational models have taught us, subtle changes in driving forces can alter the final forms produced, often with serious clinical implications (Davidson, Koehl et al. 1995, Hayashi, Carthew 2004, Brodland, Chen et al. 2010, Kafer, Hayashi et al. 2007). Thus it is clear that if we are to understand how the crucial cell and tissue movements associated with processes such as organogenesis, wound healing, cancer metastasis and tissue engineering occur, we will need to obtain detailed and accurate maps of the forces at work.
Although a broad range of experimental techniques – such as micropipette aspiration (Maitre, Berthoumieux et al. 2012), optical tweezers (Capitanio, Pavone 2013), magnetic cytometry (Kasza, Vader et al. 2011), laser ablations (Hutson, Veldhuis et al. 2009), atomic force microscopy (Thomas, Burnham et al. 2013), inserted oil droplets (Campas, Mammoto et al. 2014) and FRET (Borghi, Sorokina et al. 2012) – are available for measuring forces in cells, these techniques provide force information for single locations and times, only. One might consider constructing maps from single-point data from multiple experiments, but variations from one animal to another, even within a single clutch, can be 30% or more (Wiebe, Brodland 2005), making such data collation ideas impractical. One of the few current techniques to offer force maps is traction microscopy, but it is applicable only to planar cell cultures.
A new family of force inference techniques, however, offers the prospect of constructing detailed force maps from images (Brodland, Conte et al. 2010, Ishihara, Sugimura et al. 2013, Ishihara, Sugimura 2012, Chiou, Hufnagel et al. 2012, Brodland, Veldhuis et al. 2014). Indeed, when Video Force Microscopy (VFM), one of the first such techniques, was applied to ventral furrow formation in Drosophila, it provided information about the relative forces acting along each cell membrane and did so with sub-minute temporal resolution (Brodland, Conte et al. 2010). It showed that apical constrictions near the embryo midline were key drivers, as expected, but that these forces were smooth with respect to time and position, in contrast to most conceptual and computational models of the time. It also demonstrated the action of significant basal contractions in the dorsal and lateral ectoderm and tensions along the membranes normal to the epithelium in a region near the ventral midline. This knowledge was important for understanding how the observed motions were driven and why a variety of mutations caused the furrow to be abnormal or even non-existent.
The basic idea behind these force-from-shape techniques is that the observed motions or shapes are the consequence of a set of driving forces – generally tensions along cell boundaries and intracellular pressures. VFM included viscous forces, and other kinds of forces could also be incorporated into these methods (Brodland, Veldhuis et al. 2014). In a standard computational model, a starting geometry and set of driving forces are specified and the model uses a finite element model or some other numerical engine to predict the motions that will result. In VFM, these equations are inverted, the geometry is specified and the modified computational engine estimates the driving forces. The inversion process is not straight-forward and many of these methods exhibit issues related to equation sufficiency, solution uniqueness and noise sensitivity, especially when applied to in-plane motions of epithelia.
We recently showed that these issues can be resolved by assuming the cell edges to be curved rather than straight (Brodland, Veldhuis et al. 2014), and we considered a limited number of options for estimating the contact angles at the junctions where cell membranes meet and for approximating membrane curvatures. We called this new approach, including the solution evaluation methods associated with it CellFIT, the Cellular Force Inference Toolkit.
Here, we discuss the steps in CellFIT and examine practical issues related to its implementation, such as determination of edge angles and curvatures, and we introduce a software tool that is useful in these processes. We also consider how to evaluate CellFIT solutions using mathematical tools such as condition numbers, equation residuals and covariance matrices.
The Basic Steps in CellFIT
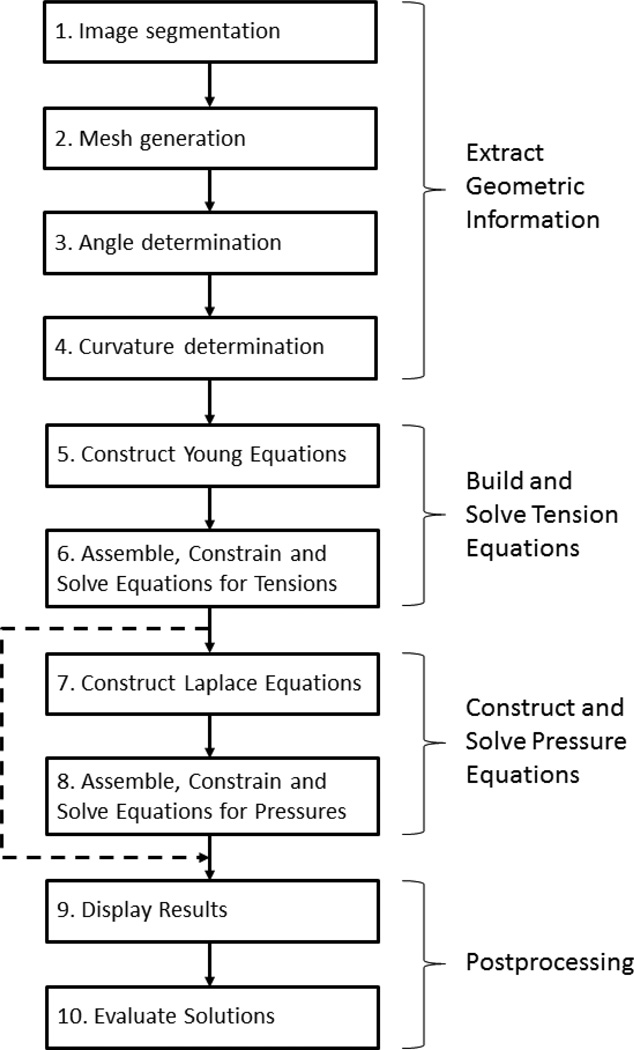
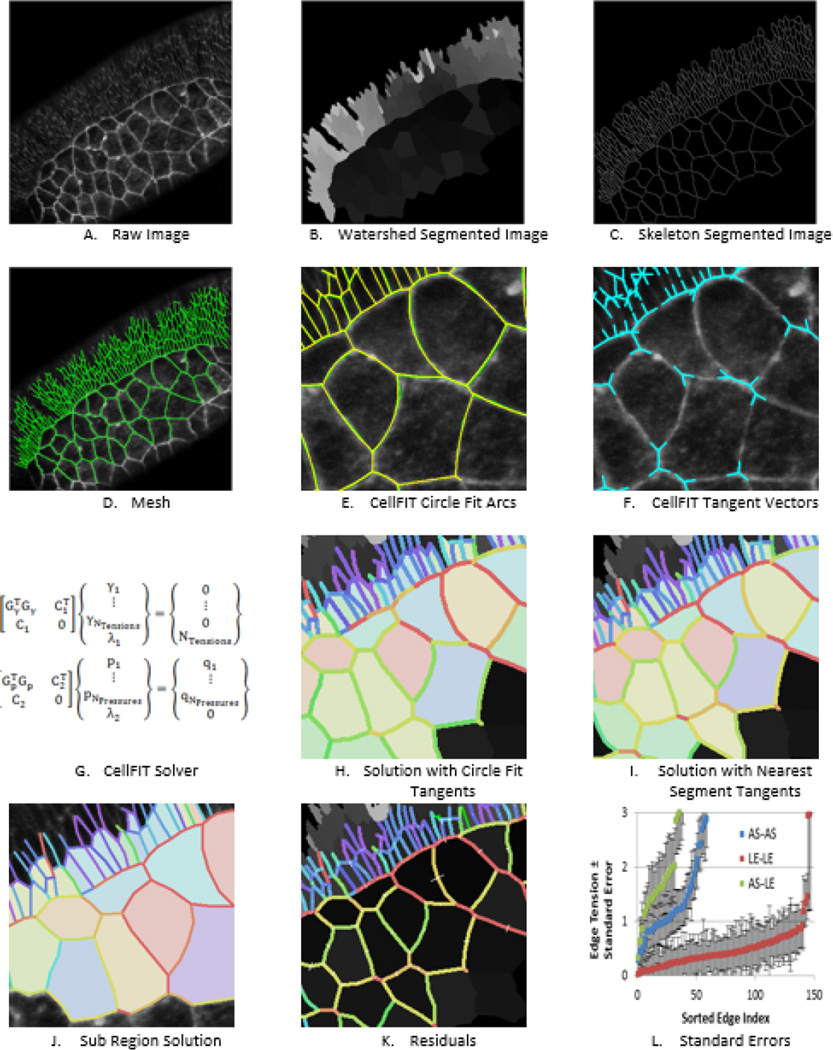
CellFIT involves extracting geometric information from a source image followed by the formulation and solution of equations based on this information (Figs 1 and 2). Two postprocessing steps are also typically carried out, namely, solution visualization and evaluation. In practice, some of these steps are further subdivided in order that they can be carried out using standard computational algorithms. The goal of this section is to describe the steps in the method and their associated practical issues, and the section numbers correspond to those in the flowchart (Fig. 1).
Fig. 1.
CellFIT Flowchart. The flowchart shows the basic steps in the CellFIT procedure, and its numbers correspond to those used in the text.
Fig. 2.
Process Steps. A shows cells from the amnioserosa and adjacent lateral ectoderm (upper left corner) of a Bownes stage 13 Drosophila embryo (From (Brodland, Veldhuis et al. 2014). Watershedding was used to segment the image into cells as shown in B. C shows the cell boundaries in skeletonized form, while D shows the cell outlines as a mesh (see also Fig. 3). The circular arcs used to calculate the edge curvatures and edge angles at the triple junctions are shown in E and the resulting tangent angles in F. The resulting equation sets are shown in G and solutions based on circle- and nearest segment-edge fits are shown in H and I, respectively. J shows that analyzing a sub-region give results consistent with those produced when the whole region is analyzed, subject to offsets associate with the small sample size when the region of interest contains only a few cells. K shows the tension and pressure residuals resulting from with the analysis shown in H, and L shows the associated standard errors in the tensions, as calculated from the covariance matrix (Brodland, Veldhuis et al. 2014). As in the spectra shown in Fig. 7B, tensions and pressures shown in colours from the blue end of the spectrum have lower values and those from the red end higher ones.
1. Image Segmentation
The first step involves converting the raster of dots we call an image into geometric information. This is actually a complex process requiring the identification of features of interest – cells in this case – finding their boundaries, and assigning to each cell a unique numerical identifier. Fortunately, software to accomplish this process is available (Mashburn, Lynch et al. 2012) and its main requirement is that the edges of the cells be highlighted, as can be done using one of the many available membrane markers. Images can be segmented by hand, but that can be a long and tedious process, and software algorithms to accomplish it are available.
Consider the raw image in Fig. 2A. If the lighter areas are considered to project upwards out of the plane of the image, the result would be a miniature mountain range along each bright cell edge. If one then chose a location somewhere in a valley and began pumping in water, the space between the surrounding mountain ranges (cell edges) would fill up. If one stopped the water flow at the right moment, the cell would be nicely covered and its extent could be identified from the wetted area. This procedure encapsulates the basic idea behind a computational approach called watershedding. It gets its name from the idea that rain falling inside a certain area, the watershed, would eventually flow to a common lowest point in the valley. Watershedding is often used to trace cells as they consist of simple contiguous areas, often have well defined edges, and only one cell occupies any given location.
The physical analogy used here suggests some of the potential pitfalls of the method. For example, if parts of the boundary are not sufficiently highlighted, gaps can arise in the mountain ranges and water will unintentionally flow from one valley to the next as the water level rises. Difficulties also arise if isolated peaks or more complex features arise inside cells due to noise or labelled structures there. Software can include features to identify and partially overcome these challenges, but keeping the analogy in mind can help the user to acquire images that are better suited to automated cell tracing by watershedding.
Figure 2B shows a machine segmentation of the raw image based on watershedding. Also shown (Fig. 2C), is a skeleton image, formed by machine tracing the boundaries of the watershedded areas. Skeleton images are often easier to evaluate visually than watershed areas, and they lend themselves to being superimposed on the raw image to check the quality of the automatically calculated boundaries and make any needed manual adjustments.
2. Mesh Generation
As useful as a segmented image might be, it is still in raster form. At best, it provides collections of pixels that are deemed to be part of the same cell, or outlines of cell boundaries if in skeletonized form. Experience has shown that both forms of these images tend to contain significant imperfections, especially near triple junctions, which are a region of particular interest.
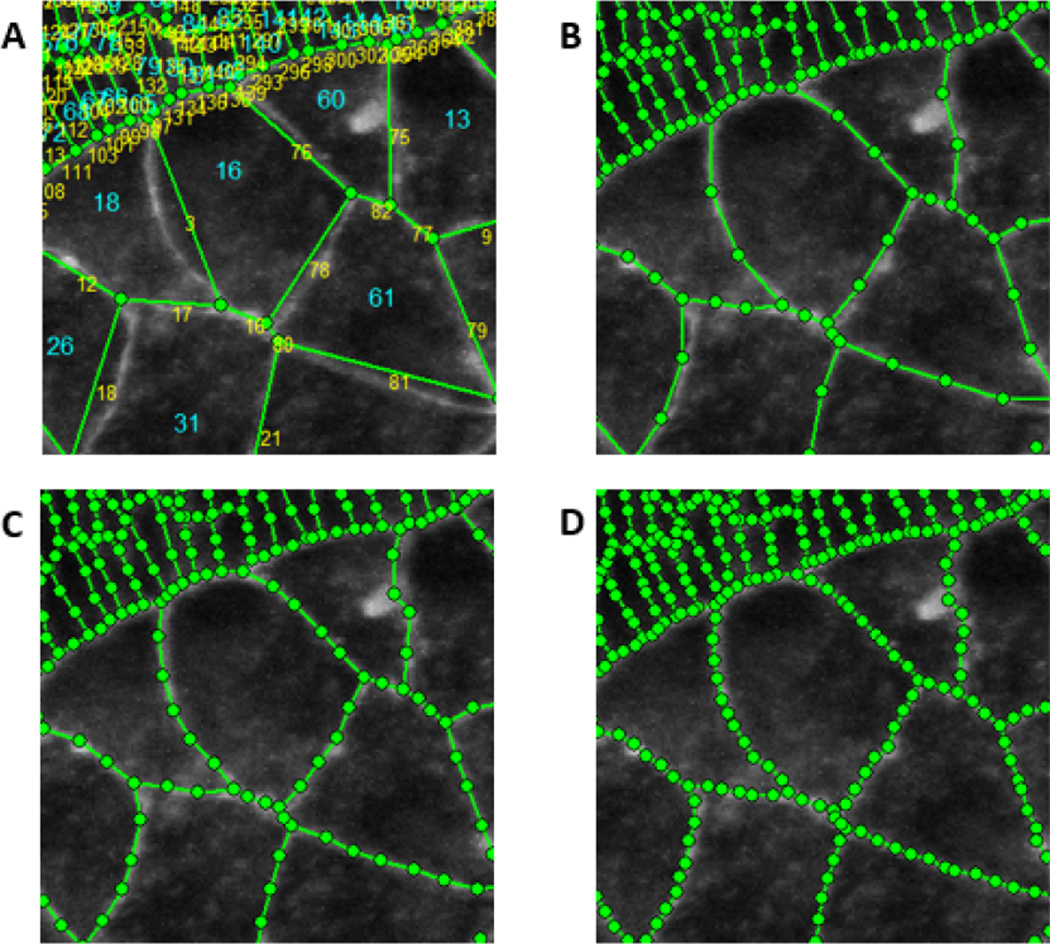
To address these issues and move toward an object- or “vector-” based description as opposed to a raster-based one, we use formalisms from finite element analysis, treating the cells as finite elements with associated edges and nodes, and we call the assemblage of these geometric entities a mesh. To convert image data to a mesh we assign nodes at each triple or higher order junction and add nodes at approximately equal spacing along each edge. We assign each cell a unique numerical identifier, note the locations and order the nodes that surround it and note the numbers of the neighbouring cells associated with each node, one other cell for each node along a cell edge and two for each triple junction node. The mesh corresponding to Fig 2A is shown in Fig 2D and an enlargement of a selected area with its cell and node numbers is shown in Fig. 3.
Fig. 3.
Meshing details. A shows an enlargement of a portion of the tissue shown in Fig. 2. Cell numbers are shown in red and node numbers in blue. B–D show various average intermediate node spacings. The mesh in A has no intermediate nodes while those in B to D have 2, 3 and 4 intermediate nodes per edge on average, respectively. The meshes have been superimposed on the raw image from which they are derived so that their quality can be evaluated. We have found that meshes like that shown in C match the geometries of typical cells sufficiently without introducing significant extraneous nodes.
As Figs 3A to 3D show, the spacing of the intermediate nodes can affect the quality of the cell representation. We have found that using approximately 4 intermediate nodes per edge on average, as in Fig. 3B, generally provides good geometric matching without introducing extraneous points. Edges that are longer than average are assigned more nodes and shorter ones fewer. Very short edges will have no intermediate nodes, and hence no curvature information.
The sets of equations used to calculate the tensions and pressures are generally overdetermined, and so a limited number of edges that are unclear in the original image, or too short to properly indicate the edge angles at its ends or its curvature, or otherwise problematic, can be removed from the analysis, as described elsewhere (Brodland, Veldhuis et al. 2014), by removing such edges and their associated nodes.
3. Angle Determination
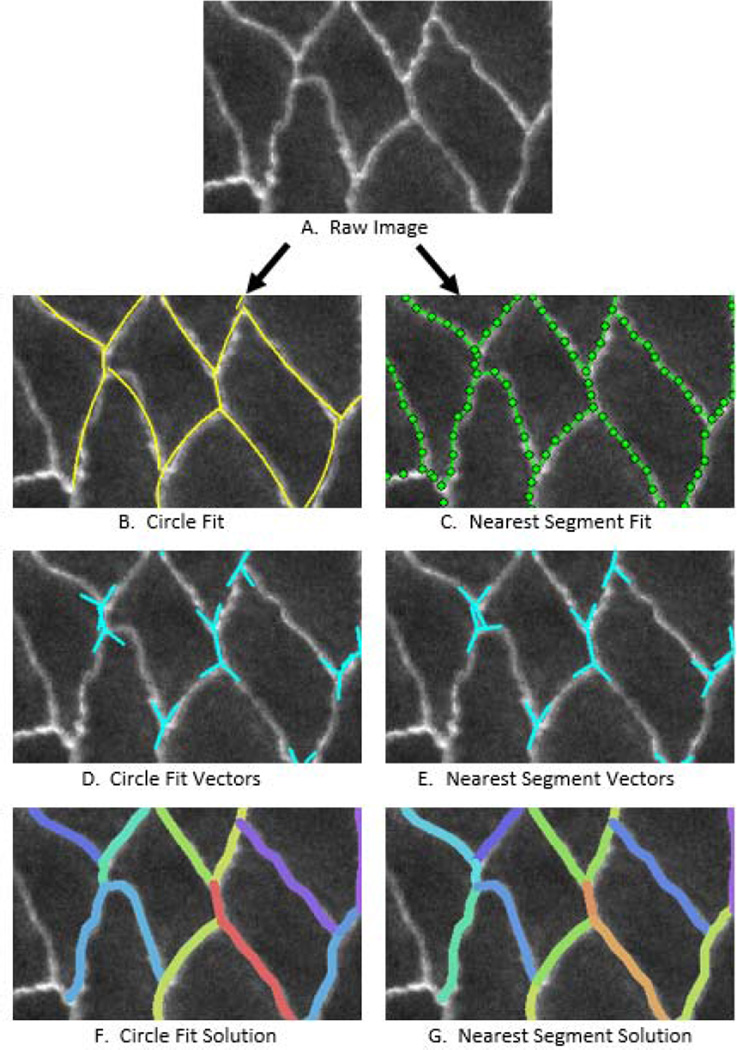
As we have argued elsewhere (Brodland, Veldhuis et al. 2014), the angles that are important at the triple or higher-order junctions are the limiting angles at which the cell membranes approach the junction. We evaluated a number of procedures for estimating this angle (Fig. 4) and, in most cases, found that the best approach was to fit a circle to the triple and edge points (nodes) associated with that edge. Figure 4B shows approach angles calculated on this basis, and they are generally in good agreement with the raw images. We also considered calculating these angles based on the locations of the triple junction and its nearest intermediate point along the edge of interest. As Fig. 4C shows, this “nearest segment” procedure is sensitive to the position of the two points used, but when the edges are crenulated or otherwise non-circular in shape, it may offer a better approach. Figs 4D and 4E show the corresponding angle estimates while Figs 4F and G show the respective edge tensions calculated using CellFIT, and the visible differences between them.
Fig. 4.
Cells with Crenulated Edges. One of the relatively rare situations where circle fits do not give good membrane approach angles is when an edge has a complex geometry, such as a crenulated shape. These cells are from the amnioserosa of a Bowne's Stage 13 Drosophila embryo. In cases like this, angle estimates based on the last points along the edge tend to be considerably more accurate. However, crenulated edges have been deemed to carry little if any tension, and so the exact direction used in the angle calculations might not be that important. Furthermore, such edges, especially if relatively sparse within a given tissue, might be removed from the analysis (see text).
Fig. 5 shows that special care must be exercised when pairs of edges are nearly aligned with each other. In this case, even small errors in the calculation of the triple junction location or in the angles of the edges that connect there can produce situations, as in Fig. 5C, for which no combination of only positive, self-equilibrating forces exists. This state is, therefore, inconsistent with the assumption that cell edges carry only tension, and should it occur, one could either relax the tension assumption or remove the offending node from the calculations (Brodland, Veldhuis et al. 2014).
Fig. 5.
Problematic Tangent Vectors. As noted in the text, cell edges that are nearly collinear as in A and B, can introduce numerical issues, especially if positional or angular errors arise and cause all of the edges to lie within an included angle smaller than 180 degrees, as in C. See text.
4. Curvature Determination
We considered two main approaches for calculating membrane curvature, which is needed for the pressure calculations. The simplest and best is to use the circle fits calculated for estimating the cell edge approach angles. This approach works well if the cells edges are nearly circular arcs, as is often the case in practice. The other was to estimate the curvature as the change in angle from one last segment angle to the other divided by the chordal distance between their associated triple junctions, but we found that this approach did not work well.
5. Construct Young Equations
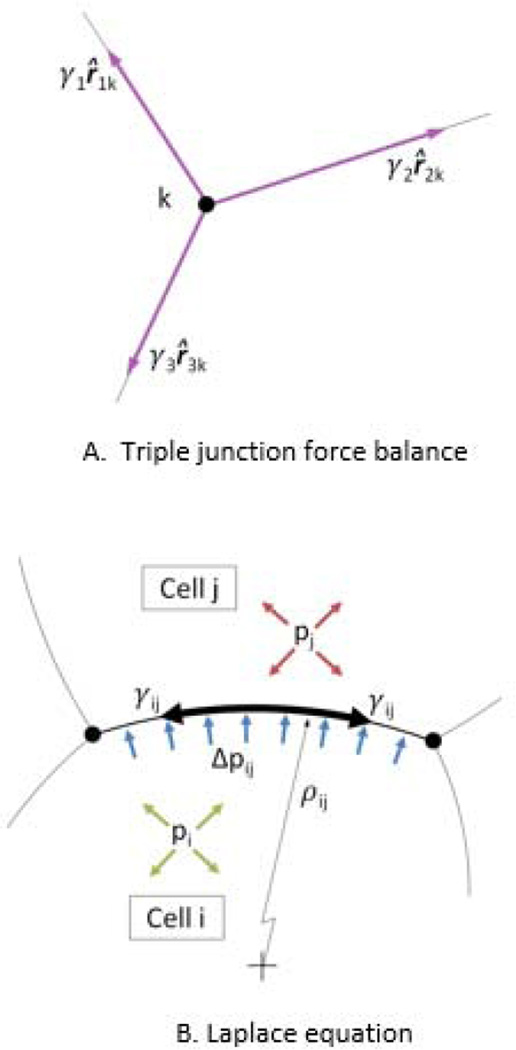
For each triple junction to be in equilibrium (Fig. 6A), the vector sum of the membrane tensions acting on it must be zero, that is
| (1) |
where unit vectors r̂jk are tangent to the limiting angle at which the jth cell membrane approaches the kth triple junction and pointing away from the junction. The γj values are the corresponding membrane tensions, and are the unknown values being sought.
Fig. 6.
The Physical Basis of the Tension and Pressure Equations. The tension equations (Equation 1) arise from a force balance at each triple or higher-order junction in accordance with the vectors shown in A. As suggested by B, the pressure differences between cells are related to the membrane curvature and tension.
In practise, we write scalar sums for each of the x- and y- directions by taking the x- and y-components of the vectors in Equation 1, typically using direction cosines to do the component extractions. As we have argued elsewhere (Brodland, Veldhuis et al. 2014), the number of equations that result is generally larger than the number of unknowns, and so nodes that are problematic because one or more edges is not clearly visible or is too short to accurately determine the membrane direction, can be removed from the calculations. This is accomplished by eliminating its pair of equilibrium equations from the equation system and removing as unknowns the tensions associated with that node.
6. Assemble, Constrain and Solve Tension Equations
The Young equations can be assembled into a single matrix system known as the Tension Equations,
| (2) |
The matrix Gγ contains two rows for each junction analyzed and each of those rows contains one direction cosine for each membrane that attaches to that junction. Its number of columns equals NTensions, the number of unknown tensions γi. In general, the resulting system of equations is overconditioned and selected nodes and their corresponding edges can be removed. Equation 2 is homogeneous, and so as to avoid its natural trivial solution, we construct and solve an associated constrained least-squares system,
| (3) |
where
| (4) |
Doing so imposes the condition γ̄ = 1, where the overbar indicates a mean and λ1 is a Lagrange multiplier associated with this constraint. To properly scale the resulting set of interfacial tensions {γ} requires information external to the image (Brodland, Veldhuis et al. 2014).
In practise, the region of interest often forms part of a larger tissue, and in order to define a finite selected area, some of the cell must be cut. We call the resulting edge “open” (Chiou, Hufnagel et al. 2012) or “frayed”, and in setting up and solving the tension equations, include such edges provided that they are sufficiently long that their angles can be determined. Including these edges increases the number of variables that must be solved for. The CellFIT construction is sufficiently overdetermined to readily handle these additional variables, but methods based on straight cell edges have more difficulty.
7. Construct Laplace Equations
For some applications, it is sufficient to determine the edge tensions, in which case no further equations need be constructed or solved. However, for cases where intracellular pressures are also of interest, we construct a set of Laplace equations. These equations relate the tension and curvature of any particular edge to the pressure difference it sustains (Fig. 6B). In writing these equations, we assume that the cell edge would not appear significantly curved if the cell were sectioned by a plane normal to the cell sheet.
Consider a boundary between two cells, i and j, that is assumed to carry a tension γij, and to sustain a pressure difference
| (5) |
as a result of a difference in the intracellular pressures pi and pj in cells i and j, respectively. The relationship that must exist between pressure Δpij, radius of curvature ρij and tension for a portion of a membrane to remain in equilibrium is governed by the Laplace equation,
| (6) |
where ρij is considered positive when the i–j edge is convex into cell j.
8. Assemble, Constrain and Solve Pressure Equations
The radius of curvature of each cell edge is determined from the image and the membrane tension is known from Step 6, above. Although one could solve Equation 6 for each cell edge individually, it is better to recast them in the form
| (7) |
assemble the Laplace equations together into a single system, and solve them simultaneously. The assembled form of the Pressure Equations is
| (8) |
where each row of Equation 8 represents one pressure difference equation like Equation 7. Each row of the Gp matrix contains two non-zero entries, a 1 and a −1 according to the signs of the two corresponding pressures in Equation 7, while {q} on the right side of Equation 8 contains a listing of the ratios γij/ρij in the order that corresponds to the matrix equations on the left side. The resulting set of equations is generally overdetermined and a limited number of individual edges and their corresponding pressure differences can be removed from the equations, if appropriate.
Since each of the governing equations (Equation 7) involves a pressure difference with respect to another pressure, a single actual pressure value is needed if the appropriate offset pressure is to be determined. The rank deficiency of the assembled equations (Equation 8) can be overcome by recasting the pressure equations into the form:
| (9) |
where
| (13) |
and λ2 is the Lagrange multiplier associated with the constraint p̄ = 0. Solution of Equation 9 gives a set of generally self-consistent pressures, whose offset must be determined using information from outside of the image.
In the case of frayed edges, the cut edges are often short and their curvatures are typically not known with the same confidence as those of the uncut edges. The pressures in the cut cells are included in the analysis but are not shown in the figures presented here.
9. Display Results
The graphics features of the software tool are useful for evaluating the junction angles and edge curvatures before they are used to build the tension and pressure equations and solve for these quantities. But they can serve another, equally-valuable function.
When the various calculated quantities are viewed graphically, patterns often become evident, as in Fig. 2H and I. Irregular patterns, such as tension variations between cells belonging to the same tissue, can be spotted and unexpected combinations of forces or pressures examined in more detail. In our experience, such examination often reveals meaningful biological details that would otherwise have been missed.
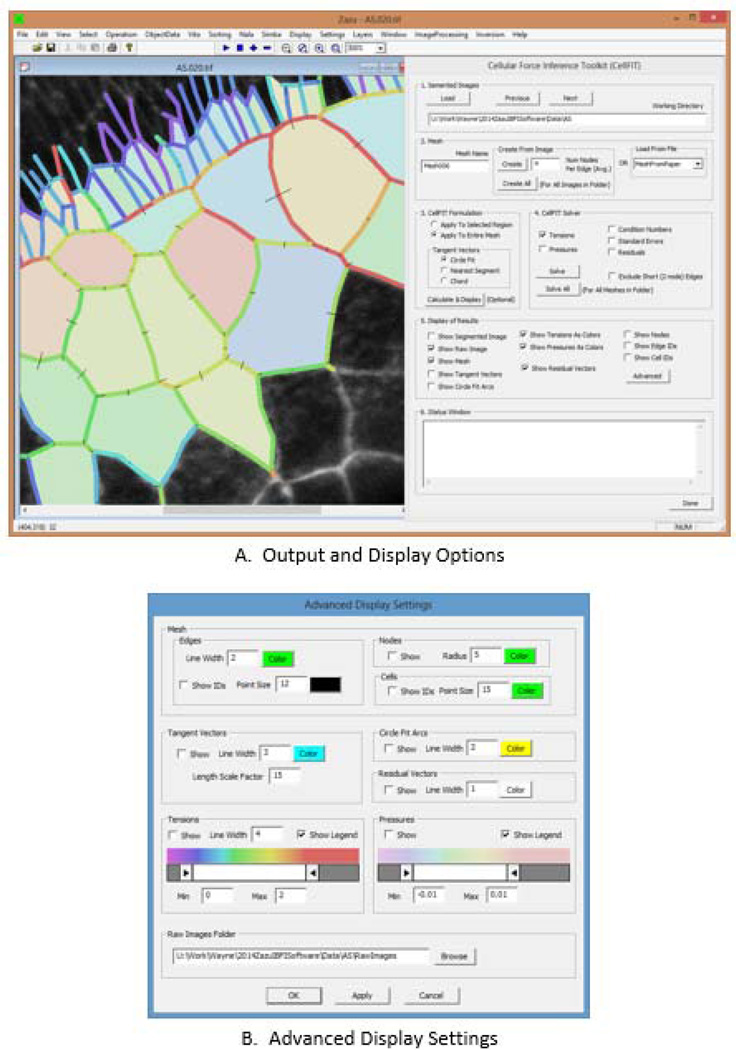
Figure 7 shows the calculation, output and display options the software tool offers. The calculation options, many of which have been demonstrated in this article, are visible in the primary graphic user interface shown on the right side of Fig. 7A. They include graphic display of the tangent vectors as calculated using circular arcs or last edge segments so that these options can be visually evaluated, and to facilitate analysis and data presentation, the colors and line thicknesses can be specified using the advanced interface (Fig. 7B). The interface allows the user to graphically select a subregion for analysis, and the display tool is especially useful for qualitatively comparing results from regions that have cells in common (Fig. 2J). The output and display options also allow meshes and various calculated quantities to be overlaid on their corresponding segmented or raw source images. The advanced interface allows these meshes to be shown with user-defined colors and line widths. Junction (node) numbers can be shown as can edge and cell identification numbers, a feature that is useful for troubleshooting and more in-depth analysis, including identification and examination of numerical values that the tool outputs in spreadsheet format. In addition, the tension and pressure spectra can be customized, a feature that is useful for enhancing relatively small tension or pressure differences for purposes of analysis, comparison and data presentation.
Fig. 7.
The CellFIT User Interface. The left side of part A shows a typical display window while the right side shows the primary user interface. This interface is designed to allow the user to control the various calculation steps in CellFIT and to make run-time choices. In contrast, the advanced interface shown in B is designed to facilitate data display and analysis. See text for details.
10. Evaluate Solutions
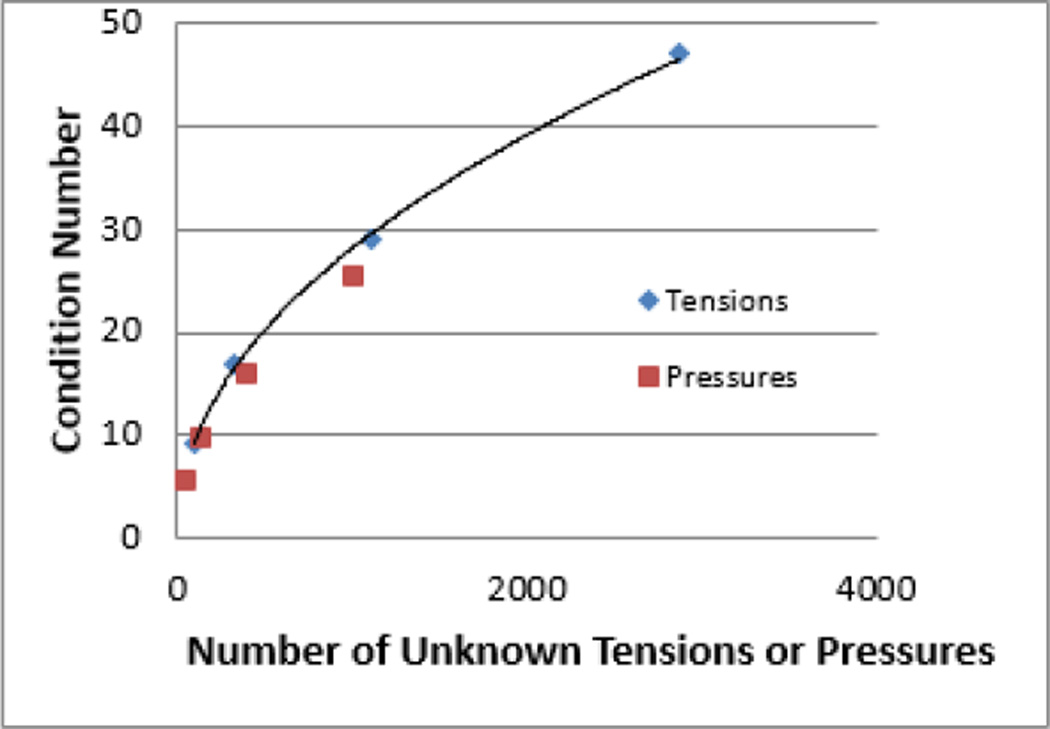
In order to facilitate evaluation of the calculations, a number of mathematical tools were developed. Details of these techniques are given in (Brodland, Veldhuis et al. 2014), but for the sake of completeness they are sketched out here. The first of these evaluation tools is condition numbers, and they serve to verify that Equations 3 and 9 are sufficiently well conditioned that reliable solutions can be found. The condition numbers are a property of the large rectangular matrices in these equations, and so they change with the size of the equation set. Smaller numbers are better for an equation set of a given size, and Fig. 8 provides a guideline for the condition numbers one might expect from analyses of aggregates containing up to 1000 cells. The figure shows that the pressure equations are slightly better conditioned than are the tension equations. This appears to be a result of the pressure equations being more strongly overdetermined. For the aggregate with 1000 cells, for example, there are 1.31 times as many tension equations as there are unknown tensions, but 2.77 times as many pressure equations as unknown pressures.
Fig. 8.
The Effect of Mesh Size on Condition Number. The condition numbers associated with the tension and pressure equations depend on the number of unknowns in those equations. Meshes consisting of 40, 125, 400 and 1000 cells were run and the resulting condition numbers for tensions (blue diagonal symbols) and pressures (red squares) are shown. The curve through the tension condition numbers is given by the exponential equation: [Condition Number] = 1.05 [Number of Unknown Tensions]0.48.
The second tool is a residual analysis and the goal of this step is to assess how well each of the basic source equations (Equations 1 and 7) is satisfied by the calculated tensions and pressures. The residuals shown in Fig. 2K illustrate the degree to which the forces at the included nodes are in balance. The vectors show the direction of the nodal imbalances, and imbalances equal to the average scalar tension have a length equal to the average cell radius. The pressure residuals are multiplied by the chordal length of the edge on which they act so that they have units of force, and they are scaled like the tension residuals and displayed at the edge midpoints. As figure 2K shows, the residuals are generally relatively small, indicating that the tension and pressure equations (Equations 1 and 7) are satisfied well.
In the many tissues we have analyzed using CellFIT, we have found that these residuals are often less than 2 or 3 percent of the sum of the scalar forces and seldom greater than 10% of this value.
The third mathematical assessment tool is the covariance matrix and it provides an indication of the expected accuracy of any particular edge tension or cell pressure (Fig. 2L). For details see (Brodland, Veldhuis et al. 2014).
Collectively, these tools allow the conditioning of the overall equation sets to be evaluated, the solution accuracy of the individual equations to be assessed and the confidence range for individual tensions and pressures to be ascertained.
Working with CellFIT Output
The tensions that a CellFIT analysis reports are the effective or equivalent edge or interfacials tensions acting in the cells and their individual edges (Chen, Brodland 2000, Lecuit, Lenne et al. 2011). These tensions include the effects of various systems associated with the cell cortex, including actomyosin contractile networks, membrane tensions and other cortex-bound systems. These tensions are affected by cell-cell adhesion systems, which counter-intuitively reduce the edge tensions as adhesion strength increases. The edge tensions variations reported by CellFIT may thus indicate cortical tension changes or contrary adhesion changes.
The tensions acting along certain edges may be affected by cell signalling or by nonlinear or viscoelastic effects along these edges. SInce CellFIT makes no assumptions about the mechanics of these edges, it is able to pick up these forces regardless of their origin. Thus, if the tension along a particular edge was affected by signalling or elongation rate, the tension that CellFIT reports for that edge would include those effects. In simple terms, CellFIT reports the actual effective tension along any edge, regardless of its source.
The pressures that CellFIT reports include three effects: intracellular pressure and apical and basal contractions. Technically, the pressures are reported as force per unit of edge length and thus, are actually force resultants (Beer, Johnston et al. 2005). That is, they are equal to the intracellular pressure times the thickness of the tissue (Chen, Brodland 2009). The reported isotropic expansion force per unit edge length, the “pressure” that CellFIT reports, is reduced by any in-plane tensions that act along the apical or basal surfaces of the cells (Hutson, Veldhuis et al. 2009). Again, the quantity reported is a net or effective value. It should also be noted that while the tensions associated with a particular image can be determined without knowledge of the scale of the image, the relationship between tensions and pressures requires image scale information. This situation arises because tensions have units of “force”, with no reference to length, while the pressures reported here have units of “force per length” and do refer to length.
Further research will be required to understand the physical meaning of situations where cell boundaries are not circular arcs. Theoretical considerations and computational models show that in the presence of uniform effective pressures and constant edge tensions they should form circular arcs. Computational analyses that are beyond the scope of this article suggest that such effects can be produced by viscous forces, like those that are taken into account in VFM (Brodland, Conte et al. 2010), tractions or friction forces between the cells and their substrates and other mechanical effects not included in the present analysis (Anon, Serra-Picamal et al. 2012). In principle, one could also calculate additional quantities such as tissue stress. But such calculations are beyond the scope of the present study.
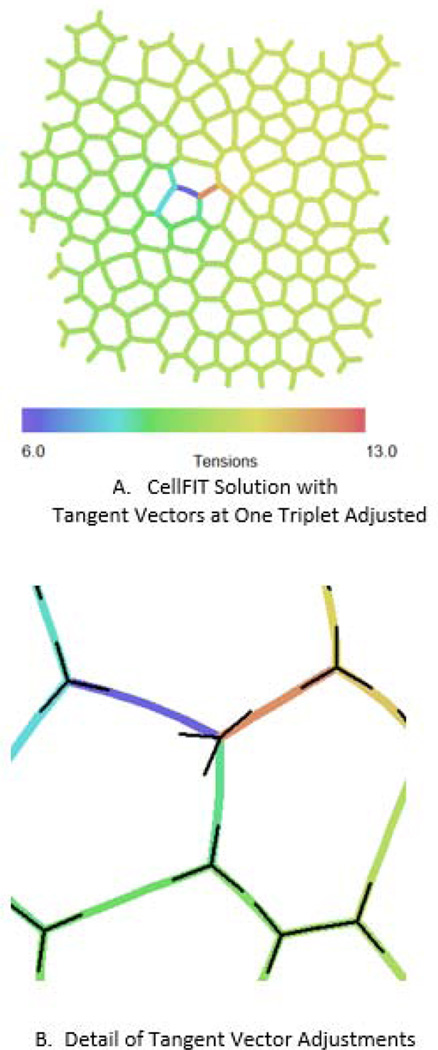
Although general questions about the effects of distributed noise on CellFIT analyses have been addressed (Brodland, Veldhuis et al. 2014), the influence of localized noise has not been. Figure 9A shows a region in which an angular error (Fig. 9B) was purposely introduced. CellFIT was given the angles shown in black rather than the true angles. Whereas the tensions in all of the cell edges had a tension value of 10, CellFIT reported a tension of 7.1 along the edge toward the left of the adjusted node as shown in blue in Fig. 9B and 11.9 in the edge toward the right shown in red. This represents a normalized difference of (11.9-7.1)/10 × 100% = 48%. One of the things that is immediately evident in Fig. 9B, is that that significant errors are highly localized. The error has a radius of influence that is approximately one cell in size. This is a very desirable property, as it means that the effect of localized errors decays quickly with position.
Fig. 9.
Error Influence Range. In order to assess the consequences of localized errors, the angles associated with one particular triple junction near the center of the cell aggregate shown in A were purposely given the erroneous orientations shown in B. Doing so caused the tensions field, which should be uniform, to be disrupted significantly for a distance of only one cell diameter from the introduced error, but it also caused an offset in the larger tension field, as described in the text.
A deeper analysis of the region as a whole shows an additional effect, and gives insight into the structure of the tension equations. The CellFIT tension equations (Equation 1) connect one edge to the next through the nodes that they have in common. Thus, they connect chains of edges through intermediate edges and their equations. One could select and follow one such series of equations from the left side to the right side of Fig. 9A. In actuality there are many such chains and they are interconnected (entwined) with each other. If an error is introduced in one such chain, as has been done here, it will produce an incompatibility between these various chains. One might expect that doing so could affect the relationship between the areas on each side of the error by an amount approximately proportional to the number of affected to unaffected chains. Inasmuch as the region shown is nominally 10 cells high, and has approximately that many edges passing through any given vertical cross-section, and one node or chain was affected, one might expect the tensions in the regions on the left and right of the error to be displaced with respect to each other by approximately 1/10 × 48% ≅ 5%. In actuality, the edge tensions on the left of the error are low by approximately 4% and those on the right are high by approximately this amount compared to the true value of 10, making a total net shift of approximately 8%, a value compatible with the above 5% estimate. The colour spectrum used to generate Fig. 9B was selected to highlight these differences.
In conclusion, this article has outlined practical considerations that should be taken into account when CellFIT is applied to epithelia or other planar aggregates of cells. The examples were chosen to provide insight into the structure and nature of the equations and to reveal the characteristics of the method so that it can be applied with confidence and its results can be interpreted properly.
Acknowledgments
Funding was provided by the Natural Sciences and Engineering Research Council of Canada (NSERC) and the National Institutes of Health (1R01-GM099107).
References
- Anon E, Serra-Picamal X, Hersen P, Gauthier NC, Sheetz MP, Trepat X, Ladoux B. Cell crawling mediates collective cell migration to close undamaged epithelial gaps. Proceedings of the National Academy of Sciences of the United States of America. 2012;109(27):10891–10896. doi: 10.1073/pnas.1117814109. [DOI] [PMC free article] [PubMed] [Google Scholar]
- Beer FP, Johnston ER, Dewolf JT. Mechanics of Materials. New York: McGraw-Hill Science; 2005. [Google Scholar]
- Borghi N, Sorokina M, Shcherbakova OG, Weis WI, Pruitt BL, Nelson WJ, Dunn AR. E-cadherin is under constitutive actomyosin-generated tension that is increased at cell-cell contacts upon externally applied stretch. Proc Natl Acad Sci. 2012;109:12568–12573. doi: 10.1073/pnas.1204390109. [DOI] [PMC free article] [PubMed] [Google Scholar]
- Brodland GW, Veldhuis JH, Kim S, Perrone M, Mashburn D, Hutson MS. CellFIT: A Cellular Force-Inference Toolkit Using Curvilinear Cell Boundaries. PLoS One. 2014 doi: 10.1371/journal.pone.0099116. in Press. [DOI] [PMC free article] [PubMed] [Google Scholar]
- Brodland GW. The Differential Interfacial Tension Hypothesis (DITH): a comprehensive theory for the self-rearrangement of embryonic cells and tissues. Journal of Biomechanical Engineering. 2002;124(2):188–197. doi: 10.1115/1.1449491. [DOI] [PubMed] [Google Scholar]
- Brodland GW, Chen X, Lee P, Marsden M. From genes to neural tube defects (NTDs): insights from multiscale computational modeling. HFSP journal. 2010;4(3–4):142–152. doi: 10.2976/1.3338713. [DOI] [PMC free article] [PubMed] [Google Scholar]
- Brodland GW, Conte V, Cranston PG, Veldhuis J, Narasimhan S, Hutson MS, Jacinto A, Ulrich F, Baum B, Miodownik M. Video force microscopy reveals the mechanics of ventral furrow invagination in Drosophila. Proceedings of the National Academy of Sciences of the United States of America. 2010;107(51):22111–22116. doi: 10.1073/pnas.1006591107. [DOI] [PMC free article] [PubMed] [Google Scholar]
- Campas O, Mammoto T, Hasso S, Sperling RA, O'Connell D, Bischof AG, Maas R, Weitz DA, Mahadevan L, Ingber DE. Quantifying cell-generated mechanical forces within living embryonic tissues. Nature methods. 2014;11(2):183–189. doi: 10.1038/nmeth.2761. [DOI] [PMC free article] [PubMed] [Google Scholar]
- Capitanio M, Pavone FS. Interrogating biology with force: single molecule high-resolution measurements with optical tweezers. Biophysical journal. 2013;105(6):1293–1303. doi: 10.1016/j.bpj.2013.08.007. [DOI] [PMC free article] [PubMed] [Google Scholar]
- Chen HH, Brodland GW. Cell-level finite element studies of viscous cells in planar aggregates. Journal of Biomechanical Engineering. 2000;122(4):394–401. doi: 10.1115/1.1286563. [DOI] [PubMed] [Google Scholar]
- Chen X, Brodland GW. Multi-scale finite element modeling allows the mechanics of amphibian neurulation to be elucidated. Physical Biology. 2008;5(1):015003. doi: 10.1088/1478-3975/5/1/015003. (15pp) [DOI] [PubMed] [Google Scholar]
- Chen X, Brodland GW. Mechanical determinants of epithelium thickness in early-stage embryos. Journal of the Mechanical Behavior of Biomedical Materials. 2009;2(5):494–501. doi: 10.1016/j.jmbbm.2008.12.004. [DOI] [PubMed] [Google Scholar]
- Chiou KK, Hufnagel L, Shraiman BI. Mechanical stress inference for two dimensional cell arrays. PLoS computational biology. 2012;8(5):e1002512. doi: 10.1371/journal.pcbi.1002512. [DOI] [PMC free article] [PubMed] [Google Scholar]
- Davidson LA, Koehl MAR, Keller R, Oster GF. How do Sea-Urchins Invaginate - using Biomechanics to Distinguish between Mechanisms of Primary Invagination. Development. 1995;121(7):2005–2018. doi: 10.1242/dev.121.7.2005. [DOI] [PubMed] [Google Scholar]
- Hayashi T, Carthew RW. Surface mechanics mediate pattern formation in the developing retina. Nature. 2004;431(7009):647–652. doi: 10.1038/nature02952. [DOI] [PubMed] [Google Scholar]
- Hutson MS, Veldhuis JH, Ma X, Lynch HE, Cranston PG, Brodland GW. Combining Laser Microsurgery and Finite Element Modeling to Assess Cell-Level Epithelial Mechanics. 2009 doi: 10.1016/j.bpj.2009.09.034. [DOI] [PMC free article] [PubMed] [Google Scholar]
- Ishihara S, Sugimura K. Bayesian inference of force dynamics during morphogenesis. Journal of theoretical biology. 2012;313:201–211. doi: 10.1016/j.jtbi.2012.08.017. [DOI] [PubMed] [Google Scholar]
- Ishihara S, Sugimura K, Cox SJ, Bonnet I, Bellaiche Y, Graner F. Comparative study of non-invasive force and stress inference methods in tissue. The European physical journal.E, Soft matter. 2013;36(4):9859-13045-8. doi: 10.1140/epje/i2013-13045-8. Epub 2013 Apr 26. [DOI] [PubMed] [Google Scholar]
- Kafer J, Hayashi T, Maree AF, Carthew RW, Graner F. Cell adhesion and cortex contractility determine cell patterning in the Drosophila retina. Proceedings of the National Academy of Sciences of the United States of America. 2007;104(47):18549–18554. doi: 10.1073/pnas.0704235104. [DOI] [PMC free article] [PubMed] [Google Scholar]
- Kasza KE, Vader D, Koster S, Wang N, Weitz DA. Magnetic twisting cytometry. Cold Spring Harbor protocols. 2011;2011(4) doi: 10.1101/pdb.prot5599. pp. pdb.prot5599. [DOI] [PubMed] [Google Scholar]
- Lecuit T, Lenne PF, Munro E. Force generation, transmission, and integration during cell and tissue morphogenesis. Annual Review of Cell and Developmental Biology. 2011;27:157–184. doi: 10.1146/annurev-cellbio-100109-104027. [DOI] [PubMed] [Google Scholar]
- Maitre JL, Berthoumieux H, Krens SF, Salbreux G, Julicher F, Paluch E, Heisenberg CP. Adhesion functions in cell sorting by mechanically coupling the cortices of adhering cells. Science (New York, N.Y.) 2012;338(6104):253–256. doi: 10.1126/science.1225399. [DOI] [PubMed] [Google Scholar]
- Mashburn DN, Lynch HE, Ma X, Hutson MS. Enabling user-guided segmentation and tracking of surface-labeled cells in time-lapse image sets of living tissues. Cytometry.Part A : the journal of the International Society for Analytical Cytology. 2012;81(5):409–418. doi: 10.1002/cyto.a.22034. [DOI] [PMC free article] [PubMed] [Google Scholar]
- Thomas G, Burnham NA, Camesano TA, Wen Q. Measuring the mechanical properties of living cells using atomic force microscopy. Journal of visualized experiments : JoVE. 2013;(76) doi: 10.3791/50497. doi(76), pp. 10.3791/50497. [DOI] [PMC free article] [PubMed] [Google Scholar]
- Wiebe C, Brodland GW. Tensile properties of embryonic epithelia measured using a novel instrument. Journal of Biomechanics. 2005;38(10):2087–2094. doi: 10.1016/j.jbiomech.2004.09.005. [DOI] [PubMed] [Google Scholar]


