

Abstract
Intestinal stem cells (ISCs) drive small intestinal epithelial homeostasis and regeneration. Mechanistic target of rapamycin (mTOR) regulates stem and progenitor cell metabolism and is frequently dysregulated in human disease, but its physiologic functions in the mammalian small intestinal epithelium remain poorly defined. We disrupted the genes mTOR, Rptor, Rictor, or both Rptor and Rictor in mouse ISCs, progenitors, and differentiated intestinal epithelial cells (IECs) using Villin-Cre. Mutant tissues and wild-type or heterozygous littermate controls were analyzed by histologic immunostaining, immunoblots, and proliferation assays. A total of 10 Gy irradiation was used to injure the intestinal epithelium and induce subsequent crypt regeneration. We report that mTOR supports absorptive enterocytes and secretory Paneth and goblet cell function while negatively regulating chromogranin A-positive enteroendocrine cell number. Through additional Rptor, Rictor, and Rptor/Rictor mutant mouse models, we identify mechanistic target of rapamycin complex 1 as the major IEC regulatory pathway, but mechanistic target of rapamycin complex 2 also contributes to ileal villus maintenance and goblet cell size. Homeostatic adult small intestinal crypt cell proliferation, survival, and canonical wingless-int (WNT) activity are not mTOR dependent, but Olfm4+ ISC/progenitor population maintenance and crypt regeneration postinjury require mTOR. Overall, we conclude that mTOR regulates multiple IEC lineages and promotes stem and progenitor cell activity during intestinal epithelium repair postinjury.—Sampson, L. L., Davis, A. K., Grogg, M. W., Zheng, Y. mTOR disruption causes intestinal epithelial cell defects and intestinal atrophy postinjury in mice.
Keywords: intestinal enteroid, mouse genetics, radiation-induced injury
Adult stem cells are vital for the long-term homeostasis of their resident tissues and are subject to regulation by both intrinsic factors and extrinsic microenvironmental signals. Extracellular stimuli, including growth factors, nutrients, and hormones, invoke stem cell responses necessary to meet organismal demands, but an improper response can cause or propagate disease (1). The rapidly renewing stem cell-based small intestinal epithelium is sensitive to extracellular stimuli, such as irradiation injury and nutritional changes, and can quickly and reversibly adapt (2, 3). Wingless-int (WNT) and Notch-regulated crypt base-localized Lgr5+ cells, also marked by Olfm4 and Ascl2 RNA expression, are bona fide active intestinal stem cells (ISCs) that self-renew and generate transit-amplifying progenitor cells (4). Lgr5+ ISCs are largely lost upon intestinal irradiation injury but are restored within days by activation of an Lgr5− ISC population, a critical step for the repair process (5). The molecular identity of the Lgr5− or reserve ISC population, previously demonstrated by Bmi1 lineage tracing, remains unclear because Bmi1 transcript is also expressed in Lgr5+ ISCs. Transit-amplifying progenitor cells of the small intestinal epithelium differentiate and mature into secretory goblet, Paneth, enteroendocrine cells (EECs), and absorptive enterocytes (4). Goblet and Paneth cells serve microbial protective functions, whereas EECs and enterocytes regulate the combined processes of nutrient ingestion, digestion, and absorption (6). Mature intestinal epithelial cells (IECs) express specific proteins related to their functional roles, including alkaline phosphatase (enterocytes), mucins (goblet cells), lysozyme (LYZ; Paneth cells), and chromogranin A (ChgA; EECs) (7, 8).
Mechanistic target of rapamycin (mTOR) is a highly conserved, eukaryotic serine-threonine kinase. Through 2 downstream signaling complexes, mechanistic target of rapamycin complex 1 (mTORC1; including Raptor) and mechanistic target of rapamycin complex 2 (mTORC2; including Rictor), mTOR senses and responds to nutrients, energy, stress, and growth factors, such as IGF and insulin, to coordinate cell growth and survival. Direct targets of mTORC1, 4E-BP1 and S6K1, promote protein and lipid synthesis, whereas lysosome biogenesis and autophagy are regulated through other mTORC1 downstream effectors. mTORC2 regulates cell survival, metabolism, and cytoskeletal dynamics via the AGC kinase family (protein kinase B or AKT, serum/glucocorticoid regulated kinase 1, and protein kinase C) (9). To date, mTOR functions have been largely deduced from cell line-based studies, but recent mTOR conditional disruptions in model organisms have uncovered varied physiologic functions of mTOR within adult tissues and stem cell populations (10–16). As such, known mTOR signaling mechanisms should be further evaluated in vivo in defined tissues and cell types.
Many cancers exhibit elevated mTOR activity, and as such, mTOR has become a key therapeutic target. Current mTOR kinase inhibitor therapies are largely cytostatic, often associated with undesirable toxicities, and cancer frequently rebounds when treatment is stopped. Increased signaling through compensatory pathways such as PI3K-AKT contributes to mTOR inhibitor-induced cancer cell evasion, but it is not clear if the manifested compensation or cytotoxicity by various mTOR therapies is related to on- or off-target effects (17).
In this study, we analyze the role of mTOR through 2 downstream signaling nodes in the mouse small intestinal epithelium by genetic conditional disruption. Our work provides biologic insights into the role of mTOR signaling in the intestinal epithelium with implications in improving the efficacy and specificity of mTOR-targeted therapies and refining our mechanistic understanding of ISC regulation and IEC development.
MATERIALS AND METHODS
Mice and treatments
mTORfl/fl, Rptorfl/fl, Rictorfl/fl, Villin-Cre, Villin-CreERT2, and Lgr5-EGFP-IRES-CreERT2 transgenes are previously described (18–22). Mice are on mixed C56BL/6 and 129S6 backgrounds, assayed between 6 and 16 wk of age, and housed in a pathogen-free breeding barrier. Animal protocols are approved by the Cincinnati Children’s Hospital Research Foundation (CCHRF) Committee on the Ethics of Animal Experiments. Male and female mTORfl/fl Villin-Cre mouse small intestines are histologically indistinguishable, so sex was not considered a biologic variable. Irradiation experiments were restricted to a single sex (male) in order to assess body weight change. Studies were restricted to the ileum (distal 25% of total small intestinal length) unless otherwise indicated. 5-Bromo-2′-deoxyuridine (BrdU) was administered at 1–2 mg by i.p. injection and chased 2–2.5 h. Tamoxifen (Cayman Chemical, Ann Arbor, MI, USA) was administered at 1 mg/d for 5 d and chased 3–7 d to induce mTOR disruption in the mTORfl/fl Villin-creERT2 model.
Enteroid assays
Small intestinal enteroids were generated and propagated as described (23). Growth factors were supplemented at the following concentrations: epithelial growth factor (50 ng/ml), Noggin (100 ng/ml), R-Spondin (500 ng/ml), and, where specified, WNT3a (80 ng/ml) (R&D Systems, Minneapolis, MN, USA). Intestinal enteroid assays were performed with 3 biologic replicates unless otherwise specified. Established enteroid cultures (5 d postplating or passage) were treated with AZD8055 (LC Laboratories, Woburn, MA, USA) at 50–200 nM for 6 h.
Crypt regeneration irradiation assay
Mice were subjected to full-body 10 Gy irradiation at a dose rate of 0.5 Gy/min by the CCHRF Comprehensive Mouse and Cancer Core facility using the JL Shepherd Model Mark I-68A Cesium 137 irradiator (JL Shepherd & Associates, San Fernando, CA, USA). Mice were sacrificed at 4 d postirradiation.
Histology and tissue staining
Intestinal tissues were fixed overnight in 4% paraformaldehyde (Electron Microscopy Sciences, Hatfield, PA, USA) or 10% buffered formalin (Thermo Fisher Scientific, Waltham, MA, USA) and embedded in Neg-50 compound (Thermo Scientific, Grand Island, NY, USA) or paraffin. Immunohistochemistry (IHC) and immunofluorescence were carried out according to standard procedures. Alkaline phosphatase was detected using a VECTOR Red Alkaline Phosphatase Substrate Kit (Vector Laboratories, Burlingame, CA, USA). Antibodies and working concentrations are detailed in Supplemental Table 1.
Quantitative RT-PCR
RNA was purified from isolated ileal intestinal crypts or whole-ileal intestinal epithelium using the RNeasy Mini Kit (Qiagen, Valencia, CA, USA). First-strand cDNA synthesis was performed using the High Capacity cDNA Reverse Transcription Kit (Thermo Fisher Scientific, Waltham, MA, USA). RT-PCR was performed on an ABI PRISM 7900 Sequence Detector or an ABI StepOnePlus using TaqMan Gene Expression Master Mix and Gene Expression Assays (Applied Biosystems, Thermo Fisher Scientific). Relative expression was calculated by the ΔΔCt method, and relative expression levels were compared to hypoxanthine-guanine phosphoribosyltransferase. TaqMan primer information is provided in Supplemental Table 1.
In situ hybridization
Olfm4 cDNA was purchased from Thermo Scientific (EMM1002-213343716: IMAGE clone 9055739; Crownsville, MD, USA). Ascl2 cDNA (MMM1013-65979: IMAGE clone 4163833) was a gift from Noah Shroyer (Baylor University, Waco, TX, USA). Lgr5 cDNA was a gift from Robert Coffey (Vanderbilt University, Nashville, TN, USA). All probes were transcribed, and ISH staining was performed according to published methods (24).
Cytoplasmic-nuclear fractionation and Western blotting
A total of 6–10 cm ileum was flushed with PBS and 5 mM PMSF and cut into 2 cm pieces in PBS, 5 mM PMSF, and protease inhibitors (Roche Diagnostics Corporation, Indianapolis, IN, USA). Tissue was shaken in PBS, 15 mM EDTA, 5 mM PMSF, and protease inhibitor until isolated crypts were observed. Samples were passed through a 70 μm filter, rinsed with PBS, 2% sorbitol, and 3% sucrose, and centrifuged at 175 g for 10 min. Cytoplasmic isolation buffer [10 mM 4-(2-hydroxyethyl)-1-piperazineethanesulfonic acid (pH 7.9), 10 mM KCl, 2 mM EDTA, 2 mM EGTA, 0.5% NP40, 5 mM PMSF, and protease inhibitor cocktail] was added, and the cell membrane was disrupted with a dounce homogenizer (Sigma-Aldrich, St. Louis, MO, USA). The sample was centrifuged and the supernatant collected as the cytoplasmic fraction. The pellet was treated with nuclear isolation buffer [150 mM NaCl, 20 mM Tris-HCl (pH 8.0), 1 mM EDTA, 0.5% NP40, 25 mM NaF, 25 mM Na3PO4, 5 mM PMSF, and protease inhibitor cocktail], sonicated, and left on ice for 30 min. Upon centrifugation, the supernatant was collected as the nuclear fraction.
Tissue samples for Western blotting were prepared in 63 mM Tris (pH 6.8), 2% sodium dodecyl sulfate, 10% glycerol, and 0.01% bromophenol blue with protease and phosphatase inhibitors (10 mM NaF, 2.5 mM DTT, 0.1 M PMSF, 0.2 M NaOV, 0.1 M β-glycerophosphate, 5% 2-ME, and protease inhibitor cocktail), sonicated, separated on Bio-Rad Mini-PROTEAN 4–15% TGX Gels, then transferred onto PVDF using the Bio-Rad Trans-Blot Turbo System (Bio-Rad, Hercules, CA, USA). Antibodies and working concentrations are detailed in Supplemental Table 1. Antibody detection was performed using Li-COR secondary antibodies (Li-COR Biosciences, Lincoln, NE, USA) and imaged and quantified on the Classic Li-COR Odyssey System with Image Studio version 3.1 software.
Microscopy and image processing
Samples were imaged on a Zeiss LSM710 (Carl Zeiss GmbH, Jena, Germany), Nikon C2 confocal microscope (Tokyo, Japan), or an Olympus 1X51 microscope (Tokyo, Japan) with a Color 5 camera with QCapture Pro 6.0 software. Transmission electron microscopy (TEM) was performed by the CCHRF Pathology Core on a Hitachi 7650H microscope (Yokohama, Japan).
Quantitative assays: histologic measurements, crypt cell proliferation and death, and size measurements
Serial sections were mTOR IHC stained to confirm deletion. Hematoxylin and eosin (H&E) images were analyzed using ImageJ (National Institutes of Health, Bethesda, MD, USA), and well-oriented crypts and villi were measured in arbitrary units (a.u.). Proliferation and cell death assays were performed by counting the total number of phospho-histone H3 (PHH3), BrdU, or cleaved caspase-3 (CC3)-positive cells per crypt section. PHH3 staining was analyzed in 3 mice per genotype, with 20–80 crypts examined per intestinal region. BrdU staining was analyzed in 4 mice per genotype, with 10–92 crypts examined per intestinal region. CC3 staining was analyzed in 3 or more mice per genotype, with 148–962 crypts examined per intestinal region. Crypts with CC3+ cells were further analyzed to assign their position to low (crypt base to +4), middle (+5 through +10), or high (>+10 to crypt mouth) regions. The Ki67 crypt viability assay was performed as described (5) (n = 5 mice, ≥8 regions analyzed per mouse). Goblet cell Mucin2 (MUC2) area was measured in a.u. with ImageJ for a total of ≥24 goblet cells per field of view per mouse (n = 3 mice). Enteroid cross-sectional area was measured in ImageJ in a.u. We chose enteroid area over enteroid bud quantification because mTORΔIEC enteroid buds are too small to reliably count. Although enteroid size measurements are more variable due to the relative position of buds in space, the measured difference is significant and accurately represents our phenotypic observations. A total of 13–40 wild-type (WT) enteroids and 8–25 mTORΔIEC enteroids were measured per day per mouse. There were 2 biologic replicates included in this quantitative analysis, but >10 mTORΔIEC mice were observed, and the enteroid growth defect phenotype is consistent. The total percentage of ileal goblet and enteroendocrine IECs within the crypt and villus intestinal epithelium was measured in 1 field of view (500–1300 IECs) per mouse (n = 3 mice). A single WT littermate from each colony (mTORfloxed, Rptorfloxed, and Rictorfloxed) was analyzed, and the data were pooled (n = 3 mice). Variability within this WT group was no greater than that within a single genotype group.
Statistics
Graphs were generated in GraphPad Prism (GraphPad Software, La Jolla, CA, USA) or Excel (Microsoft, Redmond, WA, USA). Student’s t test (2-tailed, unequal variance) was used to determine statistical significance. All data are expressed as the means ± sd or means ± sem. P < 0.05 was considered statistically significant.
RESULTS
mTOR establishes gut length and ileal crypt/villus morphology without driving adult homeostatic crypt cell proliferation or survival
To investigate the physiologic roles for mTOR in the small intestinal epithelium, we generated mTORfl/fl Villin-Cre mice, or mTORΔIEC for conditional IEC deletion, mTOR is disrupted throughout the small intestinal epithelium from embryonic d 12.5 (22). mTORΔIEC mice were weaned in expected Mendelian ratios (25% expected and 28.4% observed; n = 88). mTORΔIEC male mice exhibited a modest growth delay from weaning at 4–8 wk of age (Fig. 1A), but both sexes had a reduced small intestinal length (Fig. 1B). By Western blot, mTORΔIEC small intestinal crypts showed p4E-BP1 loss and pS6 reduction, 2 well-established mTOR kinase targets, and mTOR immunostaining confirms epithelial-specific loss in all intestinal regions (Fig. 1C, D and Supplemental Fig. S1A). Both mTORΔIEC male and female mice had similar distal villus flattening, reduced crypt width, and an increased crypt:villus ratio (Fig. 1E–I).
Figure 1.

mTOR IEC-specific disruption results in a shortened small intestine and altered distal epithelial morphology. A) Male and female mTORΔIEC and littermate control growth curves (n ≥ 5 mice). B) Average small intestinal length of male and female mTORΔIEC and littermate controls. Lines indicate the mean. C) Representative mTOR signaling pathway Western blot of mTORΔIEC and littermate control small intestinal crypts (n = 4 mice). D) mTOR IHC (brown) shows IEC-specific absence in mTORΔIEC mice. Hematoxylin indicates DNA (blue). It is representative of mice 2–10 mo of age (n > 10 mice). Quantification of regional villus height (E), crypt:villus ratio (F), crypt width (G), and average crypt depth (H) for male and female mTORΔIEC and WT littermates (n ≥ 3 mice). I) Representative H&E of mTORΔIEC and WT littermate duodenum, jejunum, and ileum. Error bars represent sd. *P < 0.05; **P < 0.01; ***P < 0.001. Scale bars, 100 μm.
No changes in the total proportion or localization of BrdU (S-phase) or PHH3 (M-phase)-positive crypt cells were observed in adult mTORΔIEC mice compared to WT (Supplemental Fig. S1B–D). Although the average percentage of CC3-dependent apoptosis per crypt was unchanged, there was a modest increase in the frequency of CC3+ cells in upper mTORΔIEC ileal crypt regions compared to WT (Supplemental Fig. S1E–G). Finally, mTORΔIEC ileal IEC migration is not altered (Supplemental Fig. S1H). It remains possible that the reduced mTORΔIEC ileal villus length reflects developmental defects.
mTORC1, with contributions from mTORC2, regulates distinct IEC populations: enterocytes, goblet, enteroendocrine, and Paneth cells
Based on our initial histologic analysis, we focused our remaining studies on the mTORΔIEC distal intestinal epithelium. We began by examining the differentiated IEC populations and observed that alkaline phosphatase, a mature enterocyte marker, was severely reduced in mTORΔIEC ileal villi (Fig. 2A). mTORΔIEC goblet cells, marked by Muc2, have smaller mucus-laden granules but are not significantly fewer in number (Fig. 2B–D). Interestingly, EEC number was elevated in mTORΔIEC crypts, as indicated by a 3-fold increase in the percentage of ChgA+ IECs. (Fig. 2E, F).
Figure 2.

mTOR promotes enterocyte maturation, regulates goblet cell size, and suppresses EEC number. A) Representative alkaline phosphatase (red) immunofluorescence (IF), enterocyte marker, for mTORΔIEC and WT ileal epithelium. DAPI indicates DNA (gray). Right panels show a representative WT and mTORΔIEC villus. Scale bars, 100 μm (left panels) and 50 μm (right panels). B) Representative MUC2 (green) IF, goblet cell marker, for mTORΔIEC and WT ileal epithelium. DAPI indicates DNA (gray). Scale bar, 100 μm. C) Average MUC2 area of WT vs. mTORΔIEC ileal goblet cells. D) Average percentage of MUC2+ IECs in WT vs. mTORΔIEC ileal epithelium. E) Representative ChgA (green) IF, EEC marker, for mTORΔIEC and WT ileal epithelium. E-cadherin is shown in magenta. Scale bar, 100 μm. F) Average percentage of ChgA+ IECs in WT vs. mTORΔIEC ileal epithelium. A–F) n = 3 mice per genotype. Error bars represent sd. **P < 0.01.
mTORΔIEC crypts did not contain characteristic Paneth cells with large secretory granules, as highlighted by H&E (Fig. 3A). LYZ, a mature Paneth cell marker, was reduced in mTORΔIEC ileal crypts at both the protein and mRNA levels (Fig. 3B, C). To determine if mTOR is necessary for Paneth cell specification or maintenance, we performed TEM to visually identify Paneth cells by their characteristic perinuclear rough endoplasmic reticulum (ER) (25). mTORΔIEC Paneth cells were present but were smaller with fewer secretory granules like mTORΔIEC goblet cells. These atypical mTORΔIEC Paneth cells do not contain obvious goblet cell-like mucus-laden granules, characteristic of an immature Paneth/goblet cell (Fig. 3D) (25).
Figure 3.

mTOR disruption impairs Paneth cells. A) H&E staining of WT and mTORΔIEC ileal crypts (n > 20 mice). B) LYZ IHC (brown), mature Paneth cell marker (n > 10 mice). C) Relative expression levels of Lyz transcript in WT and mTORΔIEC ileal crypts. D) Representative TEM images of a WT and mTORΔIEC ileal crypt base. Asterisks indicate Paneth cells (n = 2 mice). E) Relative expression levels of Paneth cell specification and differentiation genes in WT and mTORΔIEC distal small intestinal crypts. C, E) n = 3 mice. Error bars represent sem.*P < 0.05; **P < 0.01. Scale bars, 20 μm (A, B) and 10 μm (D).
Secretory IECs are specified via Notch pathway transcription factors, Atoh1/Math1 and Gfi1 (26), which along with the Notch1 receptor, were not reduced in mTORΔIEC intestinal crypts, suggesting that mTOR loss does not inappropriately activate Notch activity. Hes1, the Notch transcriptional target associated with absorptive enterocyte lineage specification, is reduced and correlates with the observed mTORΔIEC ileal villus flattening. WNT activity can specifically regulate Paneth cell differentiation through the transcription factor SRY (sex-determining region Y)-box 9, or Sox9, which is reduced in mTORΔIEC crypts (Fig. 3E) (27, 28).
To explore the signaling pathways through which mTOR might regulate IECs, we generated 3 additional conditional mutant mouse models: Rptorfl/fl; Villin-Cre (RptorΔIEC, mTORC1-specific disruption); Rictorfl/fl; Villin-Cre (RictorΔIEC, mTORC2-specific disruption); and Rptorfl/fl; Rictorfl/fl; Villin-Cre (RptorRictorΔIEC, dual mTORC1/2 disruption). Western blotting of isolated RptorΔIEC, RictorΔIEC, and RptorRictorΔIEC crypts demonstrated Raptor and Rictor protein loss and p4E-BP1 and pS6 suppression specifically in the RptorΔIEC and dual RptorRictorΔIEC IECs (Fig. 4A).
Figure 4.

mTOR regulates differentiated IECs through both mTORC1 and mTORC2. A) Western blot shows loss of mTOR signaling components and downstream signaling activity in WT, RptorΔIEC, RictorΔIEC, and double RptorRictorΔIEC ileal crypts (n = 2 mice). B) Representative H&E, LYZ (brown), and hematoxylin (blue) IHC staining for WT, RptorΔIEC, RictorΔIEC, and double RptorRictorΔIEC ileal tissue. C) Representative RictorΔIEC, RptorΔIEC, and RptorRictorΔIEC ileal tissue stained for alkaline phosphatase (red), Muc2 (green), or ChgA (green) and counterstained with DAPI, DNA (gray), or E-cadherin (magenta). D) Average MUC2 area in WT vs. RictorΔIEC, RptorΔIEC, or RptorRictorΔIEC (dual) ileal goblet cells. E) Average percentage of MUC2+ IECs in RictorΔIEC, RptorΔIEC, or RptorRictorΔIEC (dual) ileal epithelium. F) Average percentage of ChgA+ IECs in WT vs. RictorΔIEC, RptorΔIEC, or RptorRictorΔIEC (dual) ileal epithelium. D–F) Dotted lines indicate levels of shared WT controls shown in Fig. 2C, D, F for ease of comparison. G) Average mitotic index (PHH3, M-phase marker) of WT vs. RptorΔIEC, RictorΔIEC, and RptorRictorΔIEC mice ileal crypts. H) Western blot demonstrates AKT activation in WT and mTORΔIEC and in WT, RptorΔIEC, RictorΔIEC, and RptorRictorΔIEC isolated ileal crypts (from same Western blot as shown in Figs. 1C and 4A, respectively). I) Representative Western blot of WT enteroids treated with the mTOR kinase inhibitor AZD8055 at 50–200 nM for 6 h. V, vehicle. n = 2 independent experiments. B–G) n = 3 mice each genotype. D–G) Error bars represent sd. *P < 0.05; **P < 0.01. Scale bars, 100 μm.
Rptor disruption caused defects similar to mTORΔIEC, including moderate ileal villus blunting, reduced alkaline phosphatase expression, loss of LYZ+ Paneth cells, and increased EEC number (Fig. 4B–F). Interestingly, the RptorRictorΔIEC mice exhibited a more mTORΔIEC-like phenotype that included the RptorΔIEC mutant phenotypes along with more-severe villus flattening and decreased goblet cell size (Fig. 4B–F). RictorΔIEC mice do not exhibit mTORC1-like mutant phenotypes and, instead, exhibit a trend toward larger goblet cell size that did not reach statistical significance (Fig. 4B–F).
Like mTORΔIEC crypts, loss of signaling through either mTOR complex does not impair adult crypt cell proliferation, and the observed trend of increased cell proliferation suggests signaling compensation (Fig. 4G). mTORC1 represses PI3K-AKT activity through a negative feedback loop targeting insulin receptor substrate 1. This repression is lost upon mTOR disruption and contributes to mTORC1-inhibitor resistance (17, 29). Indeed, increased p-AKTThr308, a pyruvate dehydrogenase kinase 1 target, is observed upon either mTORC1 or mTORC2 disruption in ileal crypts, whereas elevated p-AKTSer473, an mTORC2 and other family member target (30), is associated with mTOR and Rptor disruption (Fig. 4H). Although mTORΔIEC crypts exhibit substantial mTOR mRNA, protein, and downstream activity disruption (see Fig. 1C and Supplemental Fig. S2A), we cannot exclude the possibility that residual mTOR WT escaper tissue contributes to the p-AKTSer473 increase. Pharmacologic mTOR kinase suppression using AZD8055 efficiently suppressed p4E-BP1 in WT enteroids within 6 h of treatment, but AKT phosphorylation was not increased, suggesting that PI3K-AKT activation is associated with sustained, but not acute, mTOR suppression (Fig. 4I).
ISC function is mTOR dependent under in vivo competitive pressure and in vitro culture
We measured ISC marker expression in the WT, mTORΔIEC, RptorΔIEC, and RictorΔIEC ileal epithelium, but no changes were observed in Lgr5, Ascl2, Olfm4, Tert, or Hopx. Only Bmi1 exhibited increased expression in mTORΔIEC crypts (Supplemental Fig. S2A–D). Still, we observed impaired enhanced green fluorescent protein (EGFP) expression in the Lgr5EGFP-IRES-CreERT2 mTORΔIEC crypts, suggestive of mTOR-dependent cell metabolic changes that can nonspecifically affect EGFP reporter expression (Supplemental Fig. S2E). Supporting the possibility that mTOR regulates ISC function, mTOR disruption in our inducible mTORfl/fl Villin-CreERT2 model resulted in a highly mosaic intestinal epithelium. Even under aggressive tamoxifen-induction protocols, mTOR mutant IECs were outcompeted by WT within weeks (data not shown). Although some mTOR mutant crypt base columnar cells (CBCs) were retained at 3–7 d postchase, characteristic lineage-tracing ribbons were not observed (Fig. 5A). In agreement, induced mTOR mutant ISCs using the less-robust mTORfl/fl Lgr5-IRES-EGFP-CreERT2 model could not be sustained, suggesting rapid replacement of mTOR mutant by WT ISCs (data not shown).
Figure 5.
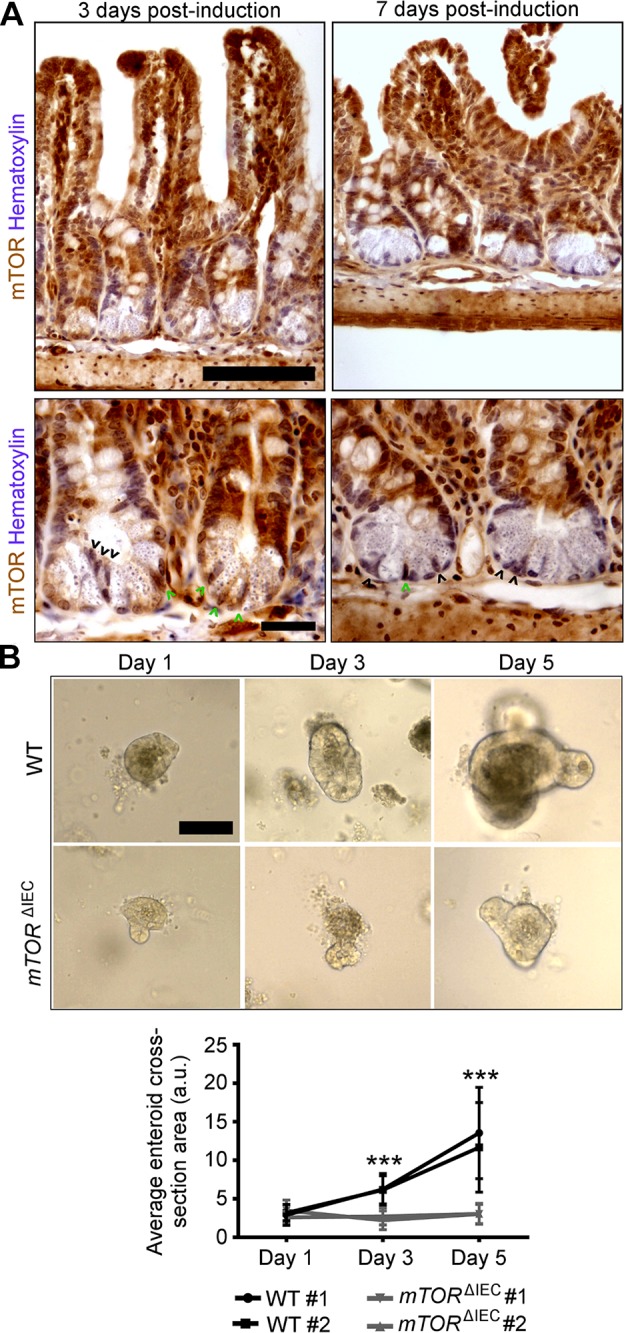
mTOR is necessary for ISC function. A) Upper panels show mosaic mTOR disruption in mTORflox/flox Villin-creERT2 crypts at 3 and 7 d postinduction. Villus-localized IECs are largely mTOR WT (brown). Hematoxylin indicates DNA (blue). In the lower panels, higher magnification of representative mTORflox/flox Villin-creERT2 crypts at 3 and 7 d postinduction shows mosaic Paneth cell and CBC mTOR loss. Black arrowheads point to mTOR mutant CBCs. Green arrowheads point to WT CBCs. Scale bars, 100 μm (upper panels) and 20 μm (lower panels). B) Representative images of WT and mTORΔIEC ileal enteroids at 1, 3, and 5 d postculture (n = 5 mice; 2–10 mo of age). Scale bar, 100 μm. Quantification is shown of average enteroid cross-sectional area on d 1, 3, and 5 postculture (n = 2 mice). Each line indicates a single mouse with ≥10 enteroids measured per mouse per day of culture. Error bars represent sd, indicating variability in enteroid size within each mouse. ***P < 0.001.
To further demonstrate a role for mTOR in promoting ISC activity, we performed an Lgr5+ ISC activity-dependent intestinal enteroid assay (5) in which crypts are isolated from their stroma and villi and grown in Matrigel in a defined epithelial growth factor, Noggin, and R-Spondin medium. Although WT small intestinal enteroids doubled in size every 2 d over 5 d in culture, mTORΔIEC small intestinal crypts failed to grow (Fig. 5B), indicating that mTOR is required for ISC function.
mTOR is dispensable for crypt canonical WNT activity
As shown by immunostaining and nuclear/cytoplasmic fractionation of WT and mTORΔIEC ileal crypt cells, β-catenin is properly nuclear localized, and WNT transcriptional targets, including Axin2, Myc, and Cyclin D, are not repressed in mTORΔIEC crypt cells in vivo (Fig. 6A–C). In vitro intestinal enteroid growth depends on WNT ligands, provided by Paneth cells in the absence of stroma or exogenous WNT3a ligand supplementation (31). Higher-than physiologic WNT3a concentrations expand ISC and progenitor cells and repress differentiation, resulting in a ballooning enlargement of WT intestinal enteroids (32). Exogenous WNT3a potently enlarges WT, but not mTORΔIEC, enteroids (Fig. 6D, E). Thus, we conclude that canonical WNT-medicated β-catenin translocation and transcriptional activation in intestinal crypts are mTOR independent, and in agreement, increased WNT activity cannot rescue ISC activity in mTORΔIEC enteroids. However, these experiments cannot rule out a potential defect in mTORΔIEC ISC WNT competency.
Figure 6.

mTOR is dispensable for small intestinal crypt canonical WNT signaling. A) β-Catenin (brown) IHC staining of WT and mTORΔIEC ileal crypts. Hematoxylin indicates DNA (blue). Insets are magnified equally. B) Representative cytoplasmic/nuclear β-catenin fractionation Western blot of WT and mTORΔIEC ileal crypt cells. β-Tubulin (C, cytoplasmic fraction) and Lamin B (N, nuclear fraction) are shown. Graph shows ratio of cytoplasmic:nuclear β-catenin with lines indicating the mean. P > 0.7. C) Quantitative RT-PCR of WNT signaling targets in isolated WT and mTORΔIEC distal intestinal crypts. Error bars represent sem. D) Representative images of WT and mTORΔIEC enteroids treated with 80 ng/ml WNT3a for 5 d. E) Immunofluorescence (IF) image compares WT vs. mTORΔIEC enteroid morphology after 6 d of 80 ng/ml WNT3a treatment. mTOR is shown in red, and DAPI indicates DNA (gray). A, B) n = 4 mice. C–E) n = 3 mice. Scale bars, 50 μm (A) and 100 μm (D, E).
mTOR is essential for ISC-mediated intestinal crypt regeneration postirradiation injury
Regenerative capacity in the intestinal epithelium is an actively proliferating Lgr5+ ISC and WNT-dependent, but not Paneth cell-dependent, process (5, 33). mTORΔIEC mice exhibit increased sensitivity to 10 Gy irradiation injury and lose more body weight than WT by 4 d postinjury (Fig. 7A). In both the jejunum (data not shown) and the ileum, WT mice exhibit increased crypt depth and crypt cell proliferation indicative of recovery (5, 34), whereas mTORΔIEC crypts regressed (Fig. 7B). Although the total number of viable mTORΔIEC crypts preirradiation injury was modestly increased due to reduced crypt width and increased crypt:villus ratios (see Fig. 1), by 4 d postinjury, the number of viable mTORΔIEC crypts was significantly reduced compared to controls (Fig. 7C). Interestingly, ISC markers in mTORΔIEC ileal epithelium pre- vs. 4 d postirradiation showed a significant reduction in Olfm4 (Fig. 7D, E). These data are consistent with our conclusion that mTOR is dispensable for canonical WNT activity because WNT targets Ascl2 and Tert are up-regulated upon mTORΔIEC crypt injury (Fig. 7E) (35, 36). Loss of mTORC2 activity (RictorΔIEC) did not impair crypt regeneration postirradiation injury or alter ISC markers postinjury (Supplemental Fig. S3). Thus, mTOR is required for ISC function during regeneration postinjury.
Figure 7.

mTOR is critical for crypt recovery postinjury. A) Average WT and mTORΔIEC body weight at d 0 and 4 d post-10 Gy irradiation (n = 6 mice). B) Representative H&E of WT and mTORΔIEC ileal intestinal tissue at 0 and 4 d post-10 Gy irradiation. Representative Ki67 (green) and E-cadherin (magenta) immunofluorescence (IF) of 4 d postirradiation tissue is shown below (n = 5 mice per genotype). C) Average number of WT and mTORΔIEC distal crypts with ≥5 KI67+ cells per standard length (a.u.) on d 4 post-10 Gy irradiation (≥8 lengths counted per mouse; n = 5 mice per genotype). A and C) Lines indicate the mean. D) Olfm4 (purple) ISH staining in WT and mTORΔIEC ileal tissue pre- and 4 d post-10 Gy irradiation (n = 3 mice). E) Relative ISC marker expression in mTORΔIEC ileal epithelial tissue pre- and 4 d post-10 Gy irradiation (n = 3 mice). *P < 0.05; **P < 0.01; ***P < 0.001. Scale bars, 100 μm.
DISCUSSION
In this study, we demonstrate the physiologic roles for small intestinal epithelial mTOR during homeostasis and regeneration. We show that mTOR is not essential for homeostatic crypt cell proliferation and survival at the adult ages examined but promotes proper IEC structure and function. Under stress-induced injury, induced by physical disruption of the intestinal epithelium to establish the enteroid assay or by irradiation injury, mTOR signaling is critical for crypt cell proliferation and for Olfm4+ ISC maintenance (Fig. 8A, B). Differential roles for mTOR during homeostasis and regeneration are demonstrated in other mouse stem cell-based tissues and in lower organisms. Rptor or Rictor disruption in the mouse hematopoietic stem cell system impairs hematopoietic stem cell-driven stress-induced regeneration, but not homeostatic hematopoiesis (13, 14). Knockdown of Planaria Smed-tor or Smed-rptor modestly reduces neoblast proliferation but blocks regeneration (37). Our study provides new evidence that mTOR drives cell proliferation and differentiation and promotes tissue recovery in the intestinal epithelium as part of a stress-responsive pathway.
Figure 8.
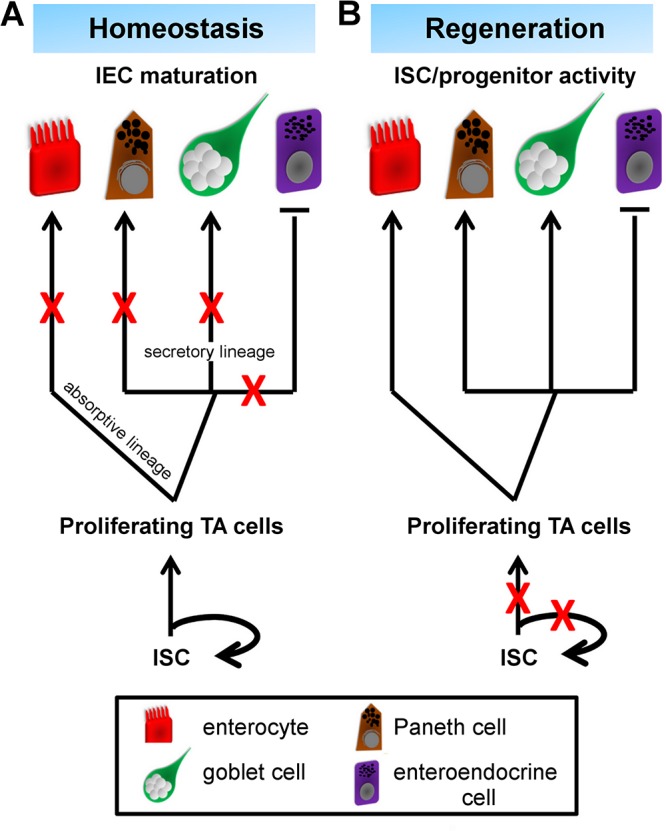
mTOR differentially regulates adult distal small intestinal epithelium during homeostasis and regeneration. A) During homeostasis, mTOR promotes absorptive and secretory lineage IEC terminal maturation, but not their specification. One exception is the EEC lineage, which is expanded upon mTOR disruption. ISC and progenitor activities are largely maintained in the mTORΔIEC model. B) During injury-induced regeneration, mTOR becomes critical for ISC and progenitor activity, and mTOR loss leads to intestinal epithelial atrophy. Olfm4+ ISC marker expression is reduced, suggesting an ISC self-renewal defect. TA, transit-amplifying cell. Red X’s mark where mTOR is necessary to promote further IEC lineage development.
It was recently published that mTOR drives intestinal epithelial recovery downstream of WNT postinjury by up-regulating translational elongation rates (38, 39), a mechanism that fits well with our studies. Even so, additional untested mechanistic possibilities linking mTOR loss to impaired ISC-driven regeneration remain, including disrupted Janus kinase/signal transducer and activator of transcription signaling, metabolic defects from likely alterations in nutrient absorption and defects in endocrine hormone secretion, and/or DNA repair defects.
Because Paneth and goblet cells are specified in the absence of mTOR, we suggest that mTORΔIEC secretory IEC structural defects are due to impairment of mTOR-dependent translation and/or protein turnover that results in reduced secretory capacity. Interestingly, disrupting Xbp1, an ER stress regulator, reduces Paneth cell LYZ granules like our mTORΔIEC model (40), and mTOR and ER stress pathways have been genetically linked (41). Given that Paneth cells contribute to the ISC niche by providing key growth factors and support ISC self-renewal during nutrient restriction (16, 31), it is reasonable to question whether impaired mTORΔIEC Paneth cells contribute to the epithelial regeneration defect. However, recent evidence shows that Paneth cells are dispensable for irradiation injury repair and for Lgr5+ ISC maintenance in vitro upon WNT supplementation (5, 42, 43). Our data show intact WNT signaling at the transcriptional level in both homeostatic and injured mTORΔIEC intestinal crypts. Furthermore, mTORΔIEC enteroids supplemented with WNT3a remain growth defective. Finally, Paneth cell structural defects were not present in the inducible mTORfl/fl Villin-CreERT2 model, yet mTOR mutant ISCs remained less competent to produce progeny. Although further study is required to tease apart cell-autonomous vs. noncell-autonomous roles for mTOR in ISCs, these data strongly suggest that mTOR has a dual ISC intrinsic and a Paneth cell niche-dependent role.
EECs control vital physiologic functions, such as glucose homeostasis, gut motility, and intestinal epithelial growth and repair (44). The mTORΔIEC ileal epithelium contains supernumerary ChgA+ EECs. In humans and animal models, increased EEC number is associated with postgut resection and bariatric surgery and is proposed as a mechanism to overcome reduced nutrient absorption capacity. The possibility that increased EECs are an indirect effect of impaired nutrient absorption in the mTORΔIEC ileal epithelium is further supported by the loss of intestinal alkaline phosphatase, which is also associated with an adaptive response to impaired nutrient absorption (8). Still, ileal interposition surgery, which does not reduce intestinal epithelial volume, also increases EEC number and suggests the involvement of other mechanisms (45). Based on observations from human patients, mTOR might regulate EEC number through direct amino acid absorption. For instance, dietary Leucine supplementation, an mTOR-activating amino acid, can suppress pancreatic β-cell development via an mTOR-hypoxia-inducible factor-1α–Ngn3 pathway (46). Because EECs are also specified by Ngn3 (47), it stands to reason a similar mechanism might be involved. Indeed, our mTORΔIEC EEC phenotype is reminiscent of a Gfi1 mutation, a transcription factor upstream of Ngn3 (26). Given the clinical implications for targeting EECs for metabolic disease treatments (48), further studies investigating how mTOR signaling restricts EEC specification will be important.
The uncoupling of Lgr5 and Ascl2 from Olfm4 marker expression after irradiation injury in mTORΔIEC ileal crypts is notable. These ISC markers can be grouped based on their upstream signaling activators: Lgr5 and Ascl2 are both regulated by WNT (21, 36), whereas Olfm4 responds to Notch activity (49). However, we observed reduced Atoh1/Math1 and increased Notch1 expression in mTORΔIEC ileal crypts postinjury, suggesting Notch activation rather than suppression (data not shown). Given that genetic loss of a single ISC marker gene Lgr5, Olfm4, or Ascl2 does not impair ISC self-renewal (36, 50, 51), we suggest that Olfm4−Lgr5+Ascl2+ mTORΔIEC ISCs may be retained postinjury but are functionally impaired. Our data suggest caution when using single ISC markers to identify ISCs under different physiologic conditions.
Recent studies have shown that ISCs possess distinct regional identities, which is conserved from Drosophila to humans (52–54). We found that mTOR loss in the distal, but not proximal, gut causes villus loss reminiscent of a malnutrition or celiac disease pathology (7). The proximal and distal small intestine expresses different gradients of transcriptional factors, such as GATA-binding protein 4 (55), and these molecular differences are likely translated to functional differences along the proximal-to-distal small intestinal axis (56, 57). Our data suggest that mTOR may have a role in defining distal small intestinal identity.
mTOR pharmacologic inhibitors in mouse cancer models and human intestinal cancers are largely cytostatic, rarely lead to regression, and are often associated with compensatory signaling pathway activation (17, 58, 59). mTOR kinase inhibitors, targeting both mTORC1 and mTORC2, perform better than mTORC1 allosteric inhibitors (i.e., rapalogs) at slowing gastrointestinal cancer progression (17). In agreement, we show that a dual mTORC1/C2 genetic disruption histologically phenocopies an mTOR disruption. Our data, and that of others, might genetically link mTOR disruption to elevated PI3K-AKT activity, possibly through compensation of other related AKTSer473 kinases in the absence of mTORC2, such as ataxia telangiectasia mutated or DNA-protein kinase (10, 30). Although increased AKTSer473 phosphorylation can potentially be explained by residual escaper tissue, mTOR-independent up-regulation of AKTThr308, a pyruvate dehydrogenase kinase 1 target site, is also observed upon either mTORC1 or mTORC2 disruption (30, 60). How PI3K-AKT signaling, a central regulator of metabolism, cell survival, and proliferation, or other compensatory pathways might support ISCs, progenitors, and/or differentiated IEC activities in an mTOR-independent manner requires future investigation. Further studies using the mTORΔIEC mouse model may allow screening for compensating targets that, when suppressed, would maintain treatment efficacy while reducing therapeutic toxicity to healthy tissues. Finally, we propose that whereas a combinatory treatment of targeted irradiation and mTOR pharmacologic inhibition or dietary restriction may be effective against cancer cell growth in animal models and patients (39, 61), mTOR activity loss beyond a certain threshold (i.e., on-target effect) will increase normal IEC toxicity.
Supplementary Material
Acknowledgments
The authors thank Ming Liu (Sichuan University, Chengdu, China), Yuan-Hung Lo (Baylor University, Waco, TX, USA), and James Johnson and Jeff Vallance (Cincinnati Children's Hospital Medical Center, Cincinnati, OH, USA) for sharing protocols and providing technical assistance. This work was supported by U.S. National Institutes of Health (NIH) National Cancer Institute Grant 5T32CA117846-05 (to L.L.S.), NIH National Institute of Diabetes and Digestive and Kidney Diseases (NIDDK) Grants F32DK097879-01 (to L.L.S.) and P30DK090971 (to Y.Z.), and NIH National Institute on Aging Grant R01AG040118 (to Y.Z.). This project was supported in part by NIH NIDDK Grant P30DK078392 (Pathology Core) of the Digestive Disease Research Core Center. L.L.S. designed and performed experiments, analyzed data, wrote the manuscript, and obtained funding. A.K.D. and M.W.G. performed experiments, analyzed data, and edited the manuscript. Y.Z. designed experiments, analyzed data, wrote the manuscript, and obtained funding.
Glossary
- AKT
protein kinase B
- a.u.
arbitrary unit
- BrdU
5-bromo-2′-deoxyuridine
- CBC
crypt base columnar cell
- CC3
cleaved caspase-3
- CCHRF
Cincinnati Children’s Hospital Research Foundation
- ChgA
chromogranin A
- EEC
enteroendocrine cell
- EGFP
enhanced green fluorescent protein
- ER
endoplasmic reticulum
- H&E
hematoxylin and eosin
- IEC
intestinal epithelial cell
- IHC
immunohistochemistry
- ISC
intestinal stem cell
- LYZ
lysozyme
- mTOR
mechanistic target of rapamycin
- mTORC1
mechanistic target of rapamycin complex 1
- mTORC2
mechanistic target of rapamycin complex 2
- Muc2
Mucin2
- PHH3
phospho-histone H3
- TEM
transmission electron microscopy
- WNT
wingless-int
- WT
wild-type
Footnotes
This article includes supplemental data. Please visit http://www.fasebj.org to obtain this information.
REFERENCES
- 1.Ables E. T., Laws K. M., Drummond-Barbosa D. (2012) Control of adult stem cells in vivo by a dynamic physiological environment: diet-dependent systemic factors in Drosophila and beyond. Wiley Interdiscip. Rev. Dev. Biol. 1, 657–674 [DOI] [PMC free article] [PubMed] [Google Scholar]
- 2.O’Brien L. E., Soliman S. S., Li X., Bilder D. (2011) Altered modes of stem cell division drive adaptive intestinal growth. Cell 147, 603–614 [DOI] [PMC free article] [PubMed] [Google Scholar]
- 3.Dailey M. J. (2014) Nutrient-induced intestinal adaption and its effect in obesity. Physiol. Behav. 136, 74–78 [DOI] [PMC free article] [PubMed] [Google Scholar]
- 4.Koo B. K., Clevers H. (2014) Stem cells marked by the R-spondin receptor LGR5. Gastroenterology 147, 289–302 [DOI] [PubMed] [Google Scholar]
- 5.Metcalfe C., Kljavin N. M., Ybarra R., de Sauvage F. J. (2014) Lgr5+ stem cells are indispensable for radiation-induced intestinal regeneration. Cell Stem Cell 14, 149–159 [DOI] [PubMed] [Google Scholar]
- 6.Kong S. E., Heel K., McCauley R., Hall J. (1998) The role of enterocytes in gut dysfunction. Pathol. Res. Pract. 194, 741–751 [DOI] [PubMed] [Google Scholar]
- 7.Shepherd N., Warren B., Williams G., Greenson J., Lauwers G., Novelli M. (2013) Morson and Dawson's Gastrointestinal Pathology, 5th Edition, Wiley-Blackwell, West Sussex, UK [Google Scholar]
- 8.Narisawa S., Huang L., Iwasaki A., Hasegawa H., Alpers D. H., Millán J. L. (2003) Accelerated fat absorption in intestinal alkaline phosphatase knockout mice. Mol. Cell. Biol. 23, 7525–7530 [DOI] [PMC free article] [PubMed] [Google Scholar]
- 9.Laplante M., Sabatini D. M. (2012) mTOR signaling in growth control and disease. Cell 149, 274–293 [DOI] [PMC free article] [PubMed] [Google Scholar]
- 10.Risson V., Mazelin L., Roceri M., Sanchez H., Moncollin V., Corneloup C., Richard-Bulteau H., Vignaud A., Baas D., Defour A., Freyssenet D., Tanti J. F., Le-Marchand-Brustel Y., Ferrier B., Conjard-Duplany A., Romanino K., Bauché S., Hantaï D., Mueller M., Kozma S. C., Thomas G., Rüegg M. A., Ferry A., Pende M., Bigard X., Koulmann N., Schaeffer L., Gangloff Y. G. (2009) Muscle inactivation of mTOR causes metabolic and dystrophin defects leading to severe myopathy. J. Cell Biol. 187, 859–874 [DOI] [PMC free article] [PubMed] [Google Scholar]
- 11.LaFever L., Feoktistov A., Hsu H. J., Drummond-Barbosa D. (2010) Specific roles of Target of rapamycin in the control of stem cells and their progeny in the Drosophila ovary. Development 137, 2117–2126 [DOI] [PMC free article] [PubMed] [Google Scholar]
- 12.Bentzinger C. F., Romanino K., Cloëtta D., Lin S., Mascarenhas J. B., Oliveri F., Xia J., Casanova E., Costa C. F., Brink M., Zorzato F., Hall M. N., Rüegg M. A. (2008) Skeletal muscle-specific ablation of raptor, but not of rictor, causes metabolic changes and results in muscle dystrophy. Cell Metab. 8, 411–424 [DOI] [PubMed] [Google Scholar]
- 13.Guo F., Zhang S., Grogg M., Cancelas J. A., Varney M. E., Starczynowski D. T., Du W., Yang J. Q., Liu W., Thomas G., Kozma S., Pang Q., Zheng Y. (2013) Mouse gene targeting reveals an essential role of mTOR in hematopoietic stem cell engraftment and hematopoiesis. Haematologica 98, 1353–1358 [DOI] [PMC free article] [PubMed] [Google Scholar]
- 14.Kalaitzidis D., Sykes S. M., Wang Z., Punt N., Tang Y., Ragu C., Sinha A. U., Lane S. W., Souza A. L., Clish C. B., Anastasiou D., Gilliland D. G., Scadden D. T., Guertin D. A., Armstrong S. A. (2012) mTOR complex 1 plays critical roles in hematopoiesis and Pten-loss-evoked leukemogenesis. Cell Stem Cell 11, 429–439 [DOI] [PMC free article] [PubMed] [Google Scholar]
- 15.Russell R. C., Fang C., Guan K. L. (2011) An emerging role for TOR signaling in mammalian tissue and stem cell physiology. Development 138, 3343–3356 [DOI] [PMC free article] [PubMed] [Google Scholar]
- 16.Yilmaz O. H., Katajisto P., Lamming D. W., Gültekin Y., Bauer-Rowe K. E., Sengupta S., Birsoy K., Dursun A., Yilmaz V. O., Selig M., Nielsen G. P., Mino-Kenudson M., Zukerberg L. R., Bhan A. K., Deshpande V., Sabatini D. M. (2012) mTORC1 in the Paneth cell niche couples intestinal stem-cell function to calorie intake. Nature 486, 490–495 [DOI] [PMC free article] [PubMed] [Google Scholar]
- 17.Francipane M. G., Lagasse E. (2014) mTOR pathway in colorectal cancer: an update. Oncotarget 5, 49–66 [DOI] [PMC free article] [PubMed] [Google Scholar]
- 18.Gangloff Y. G., Mueller M., Dann S. G., Svoboda P., Sticker M., Spetz J. F., Um S. H., Brown E. J., Cereghini S., Thomas G., Kozma S. C. (2004) Disruption of the mouse mTOR gene leads to early postimplantation lethality and prohibits embryonic stem cell development. Mol. Cell. Biol. 24, 9508–9516 [DOI] [PMC free article] [PubMed] [Google Scholar]
- 19.Sengupta S., Peterson T. R., Laplante M., Oh S., Sabatini D. M. (2010) mTORC1 controls fasting-induced ketogenesis and its modulation by ageing. Nature 468, 1100–1104 [DOI] [PubMed] [Google Scholar]
- 20.Shiota C., Woo J. T., Lindner J., Shelton K. D., Magnuson M. A. (2006) Multiallelic disruption of the rictor gene in mice reveals that mTOR complex 2 is essential for fetal growth and viability. Dev. Cell 11, 583–589 [DOI] [PubMed] [Google Scholar]
- 21.Barker N., van Es J. H., Kuipers J., Kujala P., van den Born M., Cozijnsen M., Haegebarth A., Korving J., Begthel H., Peters P. J., Clevers H. (2007) Identification of stem cells in small intestine and colon by marker gene Lgr5. Nature 449, 1003–1007 [DOI] [PubMed] [Google Scholar]
- 22.El Marjou F., Janssen K. P., Chang B. H., Li M., Hindie V., Chan L., Louvard D., Chambon P., Metzger D., Robine S. (2004) Tissue-specific and inducible Cre-mediated recombination in the gut epithelium. Genesis 39, 186–193 [DOI] [PubMed] [Google Scholar]
- 23.Fuller M. K., Faulk D. M., Sundaram N., Shroyer N. F., Henning S. J., Helmrath M. A. (2012) Intestinal crypts reproducibly expand in culture. J. Surg. Res. 178, 48–54 [DOI] [PMC free article] [PubMed] [Google Scholar]
- 24.Gregorieff, A., and Clevers, H. (2010) In situ hybridization to identify gut stem cells. Curr. Protoc. Stem Cell Biol. Chapter 2, Unit 2F 1 doi:10.1002/9780470151808.sc02f01s12 [DOI] [PubMed] [Google Scholar]
- 25.Garabedian E. M., Roberts L. J., McNevin M. S., Gordon J. I. (1997) Examining the role of Paneth cells in the small intestine by lineage ablation in transgenic mice. J. Biol. Chem. 272, 23729–23740 [DOI] [PubMed] [Google Scholar]
- 26.Shroyer N. F., Wallis D., Venken K. J., Bellen H. J., Zoghbi H. Y. (2005) Gfi1 functions downstream of Math1 to control intestinal secretory cell subtype allocation and differentiation. Genes Dev. 19, 2412–2417 [DOI] [PMC free article] [PubMed] [Google Scholar]
- 27.Noah T. K., Donahue B., Shroyer N. F. (2011) Intestinal development and differentiation. Exp. Cell Res. 317, 2702–2710 [DOI] [PMC free article] [PubMed] [Google Scholar]
- 28.Mori-Akiyama Y., van den Born M., van Es J. H., Hamilton S. R., Adams H. P., Zhang J., Clevers H., de Crombrugghe B. (2007) SOX9 is required for the differentiation of paneth cells in the intestinal epithelium. Gastroenterology 133, 539–546 [DOI] [PubMed] [Google Scholar]
- 29.Dann S. G., Selvaraj A., Thomas G. (2007) mTOR Complex1-S6K1 signaling: at the crossroads of obesity, diabetes and cancer. Trends Mol. Med. 13, 252–259 [DOI] [PubMed] [Google Scholar]
- 30.Fayard E., Tintignac L. A., Baudry A., Hemmings B. A. (2005) Protein kinase B/Akt at a glance. J. Cell Sci. 118, 5675–5678 [DOI] [PubMed] [Google Scholar]
- 31.Sato T., van Es J. H., Snippert H. J., Stange D. E., Vries R. G., van den Born M., Barker N., Shroyer N. F., van de Wetering M., Clevers H. (2011) Paneth cells constitute the niche for Lgr5 stem cells in intestinal crypts. Nature 469, 415–418 [DOI] [PMC free article] [PubMed] [Google Scholar]
- 32.Farin H. F., Van Es J. H., Clevers H. (2012) Redundant sources of Wnt regulate intestinal stem cells and promote formation of Paneth cells. Gastroenterology 143, 1518–1529.e7 [DOI] [PubMed] [Google Scholar]
- 33.Hua G., Thin T. H., Feldman R., Haimovitz-Friedman A., Clevers H., Fuks Z., Kolesnick R. (2012) Crypt base columnar stem cells in small intestines of mice are radioresistant. Gastroenterology 143, 1266–1276 [DOI] [PMC free article] [PubMed] [Google Scholar]
- 34.Yan K. S., Chia L. A., Li X., Ootani A., Su J., Lee J. Y., Su N., Luo Y., Heilshorn S. C., Amieva M. R., Sangiorgi E., Capecchi M. R., Kuo C. J. (2012) The intestinal stem cell markers Bmi1 and Lgr5 identify two functionally distinct populations. Proc. Natl. Acad. Sci. USA 109, 466–471 [DOI] [PMC free article] [PubMed] [Google Scholar]
- 35.Hoffmeyer K., Raggioli A., Rudloff S., Anton R., Hierholzer A., Del Valle I., Hein K., Vogt R., Kemler R. (2012) Wnt/β-catenin signaling regulates telomerase in stem cells and cancer cells. Science 336, 1549–1554 [DOI] [PubMed] [Google Scholar]
- 36.Schuijers J., Junker J. P., Mokry M., Hatzis P., Koo B. K., Sasselli V., van der Flier L. G., Cuppen E., van Oudenaarden A., Clevers H. (2015) Ascl2 acts as an R-spondin/Wnt-responsive switch to control stemness in intestinal crypts. Cell Stem Cell 16, 158–170 [DOI] [PubMed] [Google Scholar]
- 37.González-Estévez C., Felix D. A., Smith M. D., Paps J., Morley S. J., James V., Sharp T. V., Aboobaker A. A. (2012) SMG-1 and mTORC1 act antagonistically to regulate response to injury and growth in planarians. PLoS Genet. 8, e1002619 [DOI] [PMC free article] [PubMed] [Google Scholar]
- 38.Ashton G. H., Morton J. P., Myant K., Phesse T. J., Ridgway R. A., Marsh V., Wilkins J. A., Athineos D., Muncan V., Kemp R., Neufeld K., Clevers H., Brunton V., Winton D. J., Wang X., Sears R. C., Clarke A. R., Frame M. C., Sansom O. J. (2010) Focal adhesion kinase is required for intestinal regeneration and tumorigenesis downstream of Wnt/c-Myc signaling. Dev. Cell 19, 259–269 [DOI] [PMC free article] [PubMed] [Google Scholar]
- 39.Faller W. J., Jackson T. J., Knight J. R., Ridgway R. A., Jamieson T., Karim S. A., Jones C., Radulescu S., Huels D. J., Myant K. B., Dudek K. M., Casey H. A., Scopelliti A., Cordero J. B., Vidal M., Pende M., Ryazanov A. G., Sonenberg N., Meyuhas O., Hall M. N., Bushell M., Willis A. E., Sansom O. J. (2015) mTORC1-mediated translational elongation limits intestinal tumour initiation and growth. Nature 517, 497–500 [DOI] [PMC free article] [PubMed] [Google Scholar]
- 40.Kaser A., Lee A. H., Franke A., Glickman J. N., Zeissig S., Tilg H., Nieuwenhuis E. E., Higgins D. E., Schreiber S., Glimcher L. H., Blumberg R. S. (2008) XBP1 links ER stress to intestinal inflammation and confers genetic risk for human inflammatory bowel disease. Cell 134, 743–756 [DOI] [PMC free article] [PubMed] [Google Scholar]
- 41.Appenzeller-Herzog C., Hall M. N. (2012) Bidirectional crosstalk between endoplasmic reticulum stress and mTOR signaling. Trends Cell Biol. 22, 274–282 [DOI] [PubMed] [Google Scholar]
- 42.Sato T., Clevers H. (2013) Growing self-organizing mini-guts from a single intestinal stem cell: mechanism and applications. Science 340, 1190–1194 [DOI] [PubMed] [Google Scholar]
- 43.Durand A., Donahue B., Peignon G., Letourneur F., Cagnard N., Slomianny C., Perret C., Shroyer N. F., Romagnolo B. (2012) Functional intestinal stem cells after Paneth cell ablation induced by the loss of transcription factor Math1 (Atoh1). Proc. Natl. Acad. Sci. USA 109, 8965–8970 [DOI] [PMC free article] [PubMed] [Google Scholar]
- 44.Moran-Ramos S., Tovar A. R., Torres N. (2012) Diet: friend or foe of enteroendocrine cells—how it interacts with enteroendocrine cells. Adv. Nutr. 3, 8–20 [DOI] [PMC free article] [PubMed] [Google Scholar]
- 45.Hansen C. F., Vassiliadis E., Vrang N., Sangild P. T., Cummings B. P., Havel P., Jelsing J. (2014) The effect of ileal interposition surgery on enteroendocrine cell numbers in the UC Davis type 2 diabetes mellitus rat. Regul. Pept. 189, 31–39 [DOI] [PubMed] [Google Scholar]
- 46.Rachdi L., Aïello V., Duvillié B., Scharfmann R. (2012) L-leucine alters pancreatic β-cell differentiation and function via the mTor signaling pathway. Diabetes 61, 409–417 [DOI] [PMC free article] [PubMed] [Google Scholar]
- 47.Schonhoff S. E., Giel-Moloney M., Leiter A. B. (2004) Minireview: development and differentiation of gut endocrine cells. Endocrinology 145, 2639–2644 [DOI] [PubMed] [Google Scholar]
- 48.Holst J. J. (2013) Enteroendocrine secretion of gut hormones in diabetes, obesity and after bariatric surgery. Curr. Opin. Pharmacol. 13, 983–988 [DOI] [PubMed] [Google Scholar]
- 49.VanDussen K. L., Carulli A. J., Keeley T. M., Patel S. R., Puthoff B. J., Magness S. T., Tran I. T., Maillard I., Siebel C., Kolterud Å., Grosse A. S., Gumucio D. L., Ernst S. A., Tsai Y. H., Dempsey P. J., Samuelson L. C. (2012) Notch signaling modulates proliferation and differentiation of intestinal crypt base columnar stem cells. Development 139, 488–497 [DOI] [PMC free article] [PubMed] [Google Scholar]
- 50.De Lau W., Barker N., Low T. Y., Koo B. K., Li V. S., Teunissen H., Kujala P., Haegebarth A., Peters P. J., van de Wetering M., Stange D. E., van Es J. E., Guardavaccaro D., Schasfoort R. B., Mohri Y., Nishimori K., Mohammed S., Heck A. J., Clevers H. (2011) Lgr5 homologues associate with Wnt receptors and mediate R-spondin signalling. Nature 476, 293–297 [DOI] [PubMed] [Google Scholar]
- 51.Schuijers J., van der Flier L. G., van Es J., Clevers H. (2014) Robust cre-mediated recombination in small intestinal stem cells utilizing the olfm4 locus. Stem Cell Rep. 3, 234–241 [DOI] [PMC free article] [PubMed] [Google Scholar]
- 52.Driver I., Ohlstein B. (2014) Specification of regional intestinal stem cell identity during Drosophila metamorphosis. Development 141, 1848–1856 [DOI] [PMC free article] [PubMed] [Google Scholar]
- 53.Middendorp S., Schneeberger K., Wiegerinck C. L., Mokry M., Akkerman R. D., van Wijngaarden S., Clevers H., Nieuwenhuis E. E. (2014) Adult stem cells in the small intestine are intrinsically programmed with their location-specific function. Stem Cells 32, 1083–1091 [DOI] [PubMed] [Google Scholar]
- 54.Wang X., Yamamoto Y., Wilson L. H., Zhang T., Howitt B. E., Farrow M. A., Kern F., Ning G., Hong Y., Khor C. C., Chevalier B., Bertrand D., Wu L., Nagarajan N., Sylvester F. A., Hyams J. S., Devers T., Bronson R., Lacy D. B., Ho K. Y., Crum C. P., McKeon F., Xian W. (2015) Cloning and variation of ground state intestinal stem cells. Nature 522, 173–178 [DOI] [PMC free article] [PubMed] [Google Scholar]
- 55.Bosse T., Piaseckyj C. M., Burghard E., Fialkovich J. J., Rajagopal S., Pu W. T., Krasinski S. D. (2006) Gata4 is essential for the maintenance of jejunal-ileal identities in the adult mouse small intestine. Mol. Cell. Biol. 26, 9060–9070 [DOI] [PMC free article] [PubMed] [Google Scholar]
- 56.Bates M. D., Erwin C. R., Sanford L. P., Wiginton D., Bezerra J. A., Schatzman L. C., Jegga A. G., Ley-Ebert C., Williams S. S., Steinbrecher K. A., Warner B. W., Cohen M. B., Aronow B. J. (2002) Novel genes and functional relationships in the adult mouse gastrointestinal tract identified by microarray analysis. Gastroenterology 122, 1467–1482 [DOI] [PubMed] [Google Scholar]
- 57.Shaw-Smith C. J., Walters J. R. (1997) Regional expression of intestinal genes for nutrient absorption. Gut 40, 5–8 [DOI] [PMC free article] [PubMed] [Google Scholar]
- 58.Zaytseva Y. Y., Valentino J. D., Gulhati P., Evers B. M. (2012) mTOR inhibitors in cancer therapy. Cancer Lett. 319, 1–7 [DOI] [PubMed] [Google Scholar]
- 59.Fujishita T., Aoki K., Lane H. A., Aoki M., Taketo M. M. (2008) Inhibition of the mTORC1 pathway suppresses intestinal polyp formation and reduces mortality in ApcDelta716 mice. Proc. Natl. Acad. Sci. USA 105, 13544–13549 [DOI] [PMC free article] [PubMed] [Google Scholar]
- 60.Alessi D. R., James S. R., Downes C. P., Holmes A. B., Gaffney P. R., Reese C. B., Cohen P. (1997) Characterization of a 3-phosphoinositide-dependent protein kinase which phosphorylates and activates protein kinase Balpha. Curr. Biol. 7, 261–269 [DOI] [PubMed] [Google Scholar]
- 61.Klement R. J., Champ C. E. (2014) Calories, carbohydrates, and cancer therapy with radiation: exploiting the five R’s through dietary manipulation. Cancer Metastasis Rev. 33, 217–229 [DOI] [PMC free article] [PubMed] [Google Scholar]
Associated Data
This section collects any data citations, data availability statements, or supplementary materials included in this article.