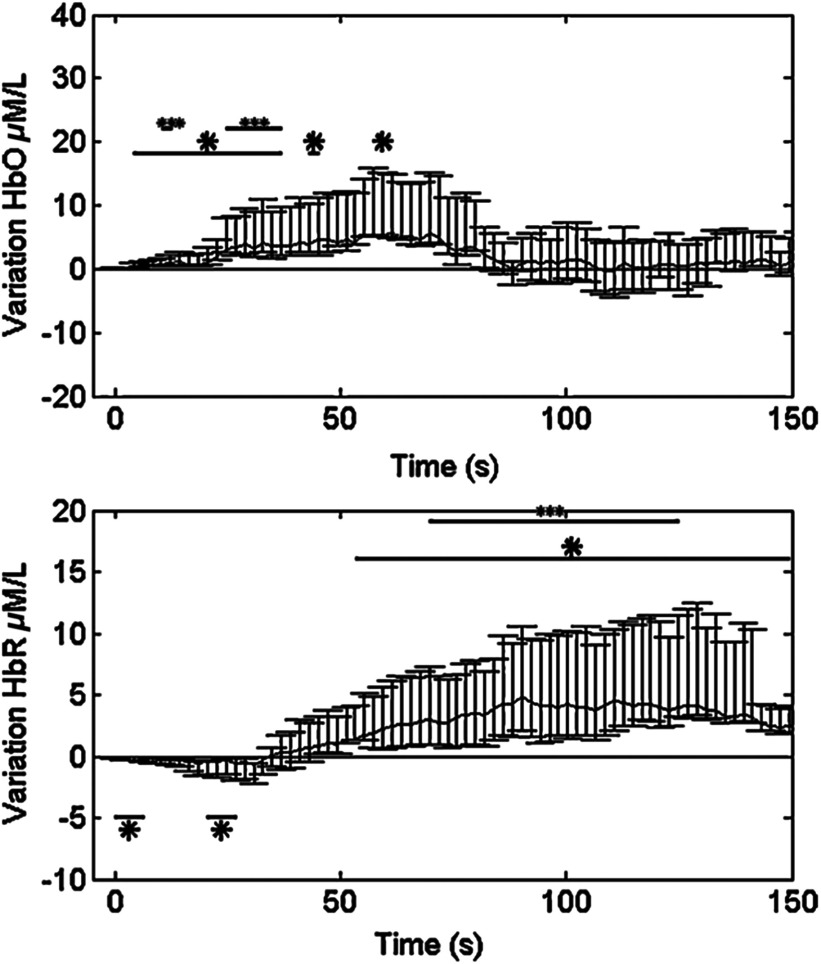
Fig. 2.
HbO and HbR concentration changes from baseline in group analysis where all eight temporal lobe seizures from three patients are aligned to seizure onset at time zero. Solid curve shows the medians and errorbars depict the 25th and the 75th pencentiles of concentration changes of the eight seizures at certain time points. Significance level: and . Figure was adapted from Ref. 36.

