

Summary
Granulocyte colony‐stimulating factor (G‐CSF) has been used to restore immune competence following chemoablative cancer therapy and to promote immunological tolerance in certain settings of autoimmunity. Therefore, we tested the potential of G‐CSF to impact type 1 diabetes (T1D) progression in patients with recent‐onset disease [n = 14; n = 7 (placebo)] and assessed safety, efficacy and mechanistic effects on the immune system. We hypothesized that pegylated G‐CSF (6 mg administered subcutaneously every 2 weeks for 12 weeks) would promote regulatory T cell (Treg) mobilization to a degree capable of restoring immunological tolerance, thus preventing further decline in C‐peptide production. Although treatment was well tolerated, G‐CSF monotherapy did not affect C‐peptide production, glycated haemoglobin (HbA1c) or insulin dose. Mechanistically, G‐CSF treatment increased circulating neutrophils during the 12‐week course of therapy (P < 0·01) but did not alter Treg frequencies. No effects were observed for CD4+ : CD8+ T cell ratio or the ratio of naive : memory (CD45RA+/CD45RO+) CD4+ T cells. As expected, manageable bone pain was common in subjects receiving G‐CSF, but notably, no severe adverse events such as splenomegaly occurred. This study supports the continued exploration of G‐CSF and other mobilizing agents in subjects with T1D, but only when combined with immunodepleting agents where synergistic mechanisms of action have previously demonstrated efficacy towards the preservation of C‐peptide.
Keywords: clinical trial, granulocyte‐colony stimulating factor, human, monotherapy, type 1 diabetes
Introduction
Type 1 diabetes (T1D) results from the specific autoimmune destruction of the pancreatic beta cells 1. Disease management via blood glucose monitoring and exogenous insulin administration is arduous and costly, and even meticulous efforts to regulate blood glucose can result in hyper‐ and hypoglycaemic events associated with systemic co‐morbidities, including cardiovascular disease, retinopathy, nephropathy and neuropathy 2, 3. Thus, many attempts have been made towards developing therapies to prevent or reverse T1D while appropriately balancing issues of efficacy versus safety. Sadly, to date, no successful means to reverse T1D durably in humans has been identified 4.
A haematopoietic stem cell (HSC) mobilization defect has been noted in humans as well as murine models of diabetes 5, 6, 7. Although these reports did not distinguish between the effects of T1D and type 2 diabetes – potentially ascribing the defect to elevated blood sugar levels rather than inherent immunological dysfunction – abnormal mobilization has been observed in the non‐obese diabetic (NOD) mouse model of T1D prior to onset of hyperglycaemia (unpublished observation). Granulocyte‐colony stimulating factor (G‐CSF), an HSC mobilizing agent, has been utilized extensively in the clinic prior to HSC harvest for bone marrow transplantation as well as to promote haematopoietic recovery following chemotherapy 8, 9. The cytokine has also been appreciated for its pleiotropic affects promoting immunoregulation 9, 10, 11. In particular, G‐CSF has been demonstrated to induce immunological tolerance and prevent T1D onset in NOD mice 12. Moreover, subjects with T1D have been demonstrated to possess reduced circulating neutrophils but increased neutrophil serine protease activity, although neither has been implicated directly in T1D pathogenesis 13. Thus, G‐CSF's known role promoting neutrophil chemotaxis from the bone marrow 14 may be of clinical importance. Together, these findings support continued mechanism‐driven therapies designed to evaluate G‐CSF in autoimmune conditions such as T1D.
One of the most successful clinical interventions seeking to reverse T1D involved an aggressive regimen of cyclophosphamide, anti‐thymocyte globulin (ATG)‐mediated immune ablation, infusion of autologous HSC and G‐CSF 15. While patients experienced a period of insulin independence, severe adverse events (AE) were also reported 15, suggesting a need for less aggressive drug doses or combinations. More recently, we demonstrated that low‐dose ATG plus G‐CSF preserved beta cell function in patients with established T1D 16. In other autoimmune conditions, G‐CSF monotherapy has provided mixed results, providing clinical remission of symptoms in patients with Crohn's disease 17, 18 and reducing the severity of experimental allergic encephalomyelitis, the murine correlate for multiple sclerosis (MS) 19. In contrast, G‐CSF treatment exacerbated clinical status in patients with MS 20. Dosing has been suggested to underlie these dual pro‐ and anti‐inflammatory effects of G‐CSF, highlighted in both the clinical setting and preclinical models of lupus (recently reviewed in 9). In considering the notion that G‐CSF alone may provide clinical benefit in T1D via regulatory T cell (Treg) mobilization and tolerogenic immunomodulation, we evaluated G‐CSF monotherapy for safety and preservation of beta cell function in patients with recent‐onset T1D.
Materials and methods
Study patients and design
In a randomized, single‐blind, placebo‐controlled trial, subjects received pegylated G‐CSF (Neulasta, Amgen, Thousand Oaks, CA, USA; six doses of 6 mg/dose administered subcutaneously every 2 weeks) or placebo. Participants from the University of Florida endocrinology clinics were screened and enrolled. Subjects aged 12–45 years with T1D diagnosed within < 6 months and baseline mixed meal tolerance test (MMTT) peak C‐peptide > 0·2 pmol/ml were deemed eligible for the study. Subjects were randomized in a 2 : 1 ratio to the treatment groups within 6 weeks of the screening visit. Fourteen subjects were assigned randomly to receive G‐CSF, while seven were assigned to receive placebo. Baseline metabolic and immunological analyses were conducted for all subjects. Subjects continued intensive disease management with their personal diabetes physicians throughout study participation, and continued insulin therapy was advised. G‐CSF or placebo treatment was administered on weeks 0, 2, 4, 6, 8 and 10. At weeks 0, 1, 2, 4, 6, 8, 10, 12 and 48, samples were obtained for immunological analyses, and at weeks 0, 4, 12, 24, 36 and 48, metabolic analyses, including a 2‐h MMTT, were conducted. At each visit, subjects were evaluated for safety and a physical examination was performed.
Study assessments and end‐points
The primary outcome was the 48‐week change from baseline in the 2‐h MMTT C‐peptide area under the curve (AUC) (pmol/ml/2 h). This was calculated for each subject, and mean change from baseline to 48 weeks was compared between treatment groups (G‐CSF or placebo). Secondary outcome measures were compared across treatment groups – glycated haemoglobin (HbA1c) (%), mean insulin dose (units/kg/day), circulating Treg frequency [forkhead box protein 3 (FoxP3)+ % of CD3+CD4+CD25+ lymphocytes], CD4+ : CD8+ T cell ratio, neutrophil frequency (×103/μl) and frequency and severity of AE. Standard laboratory and clinical tests were performed locally. Serum autoantibodies specific for beta cell antigens [glutamic acid decarboxylase 65 (GADA), insulinoma‐associated protein‐2 (IA‐2A), insulin (IAA) and islet cell antibody (ICA)] were measured by enzyme‐linked immunosorbent assay (ELISA) (GADA and IA‐2A), radioimmunoassay (IAA) and indirect immunofluorescence assay (ICA), as described previously 21, 22. Serum levels of G‐CSF (pg/ml) were measured via ELISA according to kit specifications (eBioscience, San Diego, CA, USA). HbA1c was measured using a DCA 2000 (Siemens Corporation, Washington, DC, USA). C‐peptide was measured at Northwest Lipid Laboratories (Seattle, WA, USA). Whole blood was stained for surface and intracellular markers in the following combinations: (1) CD3‐fluorescein isothiocyanate (FITC), CD4‐peridinin chlorophyll (PerCP), CD25‐phycoerythin (PE) and FoxP3‐allophycocyanin (APC); (2) CD3‐FITC, CD4‐PerCP, CD25‐PE and CD127‐PE; (3) CD3‐FITC, CD4‐PerCP, CD25‐PE and CD45RA‐APC; (4) CD3‐FITC, CD4‐PerCP, CD25‐PE and CD45RO‐APC, (5) CD3‐FITC, CD4‐PerCP, CD25‐PE and CD8‐APC, and Tcells were evaluated by flow cytometry. Briefly, 100 μl whole blood was stained for surface markers prior to red blood cell lysis [fluorescence activated cell sorter (FACS) lysing solution; BD Franklin Lakes, NJ, USA], and intracellular staining via the eBioscience FoxP3 staining kit (eBioscience, San Diego, CA, USA), according to the manufacturer's specifications. Data were collected on a BD Accuri C6 cytometer or a BD FACScalibur and analysed via FCS Express (De Novo Software, Glendale, CA, USA). For staining panel 1, CD3+CD4+ lymphocytes were gated for CD25+FoxP3+ cells to obtain Treg frequencies and absolute counts. Staining panel 2 provided an alternative means to evaluate Treg numbers: CD3+CD4+ lymphocytes were gated for the CD25+CD127−/lo population. For staining panel 3, CD3+CD4+ lymphocytes were gated to determine the total CD45RA+ naive T cell frequency and for staining panel 4, CD3+CD4+ lymphocytes were gated to determine the total CD45RO+ memory T cell frequency, and the naive/memory CD3+CD4+ T cell ratio was calculated (%CD45RA+/%CD45RO+). For staining panel 5, CD3+ lymphocytes were gated to determine the frequency of CD4+CD8− as well as CD4−CD8+ T cells, and the CD4+/CD8+ T cell ratio was calculated.
Data collection and management
Study data were collected and managed using Research Electronic Data Capture (REDCap) tools hosted at the University of Florida 23.
Statistics
Between treatment groups (G‐CSF versus placebo), 2‐h peak and AUC C‐peptide change from baseline as well as secondary outcomes were compared using a two‐way analysis of variance (anova) or unpaired two‐tailed t‐test. AEs were tabulated, reported and compared between groups using a two‐sided Fisher's exact test. Statistics were calculated using sas (SAS Institute, Cary, NC, USA) and GraphPad Prism version 6 (GraphPad Software, La Jolla, CA, USA). Significance was defined as P < 0·05.
Study approval
The institutional review board at the University of Florida approved the study described herein. Written informed consent and subject assent was obtained from each participant prior to study initiation. AE were recorded and reported according to Common Terminology Criteria for Adverse Events classifications (version 4.0).
Results
Patient characteristics
We screened 24 individuals; two did not meet the enrolment criteria, one was eligible but declined participation and 21 subjects were eligible and enrolled (Table 1) using 2 : 1 randomization. Mean age (years) at onset and diabetes duration (months) was 17·61 ± 2·09 and 3·74 ± 0·61 (G‐CSF) and 19·34 ± 2·37 and 4·12 ± 0·81 (placebo), respectively (Table 1). All seven placebo‐treated subjects and 12 of the G‐CSF‐treated subjects completed study follow‐up.
Table 1.
Patient characterization at study baseline (screening visit)
| Characteristics | Placebo (n = 7) | G‐CSF (n = 14) |
|---|---|---|
| Male, n (%) | 6 (85·71) | 2 (16·67) |
| Age at T1D onset (years)* | 19·34 ± 2·37 | 17·61 ± 2·09 |
| Duration at enrolment (months)* | 4·12 ± 0·81 | 3·74 ± 0·61 |
| Baseline C‐peptide AUC (pmol/ml/2 h)* | 60·61 ± 5·99 | 101·3 ± 8·61 |
| Baseline C‐peptide peak (pmol/ml)* | 0·59 ± 0·059 | 1·11 ± 0·098 |
| Baseline insulin requirement (units/kg/day)* | 0·343 ± 0·065 | 0·468 ± 0·088 |
| Baseline HbA1c (%)* | 6·250 ± 0·189 | 6·588 ± 0·486 |
*Mean ± standard error of the mean. HbA1c = glycated haemoglobin; AUC = area under the curve; T1D = type 1 diabetes; G‐CSF = granulocyte colony stimulating factor.
Beta cell function and glycaemic control
While baseline metabolic parameters, including C‐peptide AUC (pmol/ml/2 h) and peak (pmol/ml) following a MMTT, were significantly different between the two groups at the screening visit (Table 1), G‐CSF‐ and placebo‐treated subjects did not differ regarding change in MMTT‐stimulated C‐peptide AUC or peak over the course of the 48‐week study (Fig. 1a,b). Similarly, treatment was not associated with lower % HbA1c (Fig. 1c) or reduced insulin dose (units/kg/day, Fig. 1d).
Figure 1.
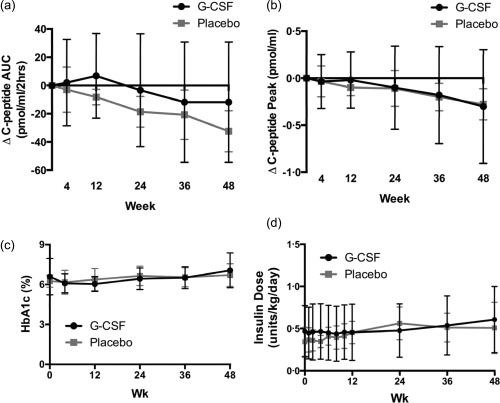
At weeks 0, 4, 12, 24, 36 and 48, the change (Δ) from baseline (screening visit) in (a) C‐peptide area under the curve (AUC) (pmol/ml/2 h) and (b) C‐peptide peak (pmol/ml) in response to mixed meal tolerance test (MMTT) was not significantly different between placebo (grey) and granulocyte colony‐stimulating factor (G‐CSF) (black)‐treated subjects. (c) Glycated haemoglobin (HbA1c) (%) values and (d) insulin usage (units/kg/day) also did not differ between treatment groups over time [all, P = not significant (n.s.), two‐way analysis of variance (anova)]. G‐CSF or placebo was administered on weeks 0, 2, 4, 6, 8 and 10. When samples were collected and treatment given in the same visit (weeks 0 and 4), MMTT and blood draw was performed prior to treatment administration.
Complete blood count, serum G‐CSF levels and flow cytometry
At each follow‐up evaluation, blood was collected for complete blood count (CBC) and measurement of G‐CSF via ELISA. While baseline analyses revealed similar immune profiles between treatment groups (week 0), neutrophil counts were elevated statistically in G‐CSF‐ versus placebo‐treated subjects during the entire 12‐week course of therapy, but were only above the reference range at the 1‐week visit [Fig. 2a (group averages), Supporting information, Fig. S1a (individual values)] 24. This observed neutrophil spike was probably related to the relative timing of sampling and treatment because, in weeks 2–12, blood was drawn a full 2 weeks after G‐CSF administration. Serum G‐CSF levels followed a similar pattern with an observed peak at week 1 followed by small but statistically significant elevation for the duration of treatment [Fig. 2b (group averages), Supporting information, S1b (individual values)]. Thus, mechanistic effects of treatment were still detectable even 2 weeks after G‐CSF injection. However, correlations between serum G‐CSF levels and neutrophil counts were not statistically significant in patients receiving G‐CSF therapy (Supporting information, Fig. S1c–f).
Figure 2.
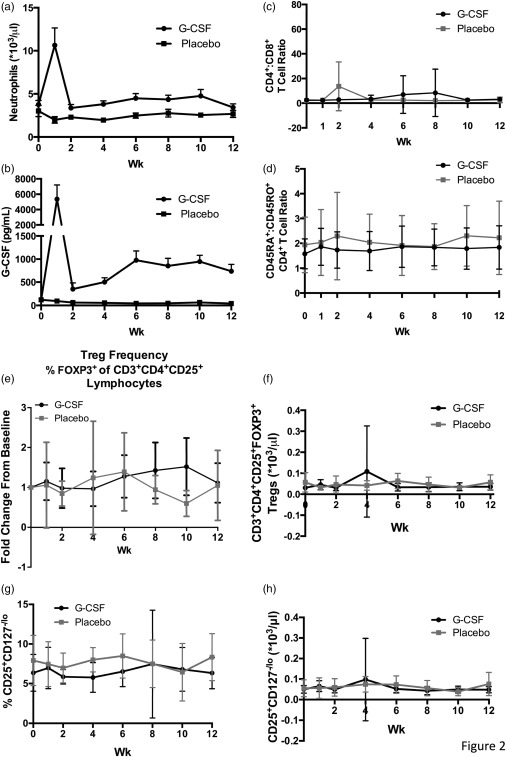
Blood was drawn from study participants at weeks 0, 1, 2, 4, 6, 8, 10 and 12. (a) Neutrophil counts (×103/μl) in peripheral whole blood and (b) serum granulocyte colony‐stimulating factor (G‐CSF) levels (pg/ml) were significantly higher in G‐CSF (circles) versus placebo (squares)‐treated subjects [P < 0·01, two‐way analysis of variance (anova)]. Throughout the duration of the study, there was no significant difference in peripheral blood (c) CD4+ : CD8+ T cell ratio or (d) the ratio of CD4+ T cells expressing the naive and memory markers CD45RA and CD45RO, respectively, between subjects that received placebo (grey squares) or G‐CSF (black circles) treatment [P = not significant (n.s.), two‐way anova]. (e–f) Regulatory T cell (Treg) frequency [forkhead box protein 3 (FoxP3)+ % of CD3+CD4+CD25+ lymphocytes] and absolute count (*103/μl) in peripheral blood was measured via flow cytometry, and the fold change from baseline was calculated for each time‐point. Neither fold change in Treg frequency nor absolute count differed significantly for G‐CSF (black) and placebo (grey)‐treated subjects (P = n.s., two‐way anova). (g–h) Similarly, when CD25+CD127−/lo Treg frequency (% of CD3+CD4+ lymphocytes) and absolute counts were evaluated, there were no significant differences between treatment groups. G‐CSF or placebo was administered on weeks 0, 2, 4, 6, 8 and 10. When samples were collected and treatment given in the same visit (weeks 0, 2, 4, 6, 8 and 10), blood was drawn prior to treatment administration.
G‐CSF therapy did not alter significantly the CD4+/CD8+ T cell ratio, naive/memory T cell balance (CD45RA+/CD45RO+ CD4+ T cell ratio), Treg frequency or absolute Treg count in whole blood [Fig. 2c–h (group averages); S2A‐G (individual values)]. Furthermore, Treg frequency did not correlate with serum concentration of G‐CSF (Supporting information, Fig. S2h–o). At the 48‐week time‐point, neither neutrophil count nor Treg frequency differed between G‐CSF‐ and placebo‐treated groups (data not shown). While it is possible that failure to detect tolerogenic therapeutic effects may be due to the fact that, aside from week 1, samples were collected 2 weeks after G‐CSF administration, these results suggest that G‐CSF alone is not sufficient to restore immunological tolerance in subjects with T1D.
During the 12‐week course of therapy, white blood cell (WBC) counts were elevated significantly in G‐CSF‐treated subjects versus placebo‐treated individuals but were comparable across all subjects (G‐CSF‐ and placebo‐treated) after the cessation of treatment (Supporting information, Fig. S3a). Notably, WBC was elevated above the normal reference range only at the 1‐week study visit, and elevated WBCs were driven primarily by increases in neutrophils, as expected. Four G‐CSF‐treated subjects were drug non‐responders (defined as ≤ 1·5‐fold increase in circulating levels of neutrophils and WBCs from week 0 to week 1 following G‐CSF therapy), but there was no association with change in peak C‐peptide or AUC during the course of the study (Supporting information, Fig. S3b,c). Platelet, red blood cell and haematocrit counts were not affected by G‐CSF therapy (Supporting information, Fig. S4), and neither G‐CSF‐ nor placebo‐treated subjects experienced significant changes in autoantibody levels during the course of the study (data not shown).
Adverse events
Patients receiving G‐CSF experienced increased incidence of bone pain (Table 2), but AE were considered to be manageable. Importantly, the known potential AE of G‐CSF, splenomegaly 25 and severe leucocytosis (defined as absolute neutrophil count over the threshold of 35 000) 26 did not occur in any treated subjects (Table 2). Thus, treatment with G‐CSF was not associated with significant safety concerns.
Table 2.
Adverse events reported for granulocyte colony‐stimulating factor (G‐CSF) monotherapy and placebo groups.
| Type | Placebo (n = 7) | Drug (n = 14) | P‐value* |
|---|---|---|---|
| Bone pain | 2 | 14 | < 0·001 |
| Abdominal pain | 2 | 2 | 0·56 |
| Shoulder pain | 0 | 4 | 0·19 |
| Fever | 1 | 4 | 0·48 |
*P‐values are by two‐sided Fisher's exact test.
Discussion
In this Phase I clinical trial, we tested pegylated G‐CSF (six doses of 6 mg administered subcutaneously every 2 weeks) for safety and efficacy towards preserving beta cell function in subjects with T1D. Ultimately, our goal is to develop a therapy for durable remission of T1D that provides clinical benefit extending well beyond the treatment window. While we expected influences on the immune system to occur immediately during the course of therapy (weeks 0–12), the metabolic effects of therapy were anticipated to occur more slowly as the beta cells (theoretically) recovered and resumed insulin production. We implemented frequent sampling during the course of treatment (weeks 0, 1, 2, 4, 6, 8, 10 and 12) to observe mechanistic changes, but considered values obtained at the 24‐, 36‐ and 48‐week time‐points to be of potential clinical value.
While treatment was not able to prevent the decline in C‐peptide, lack of apparent efficacy may be due to the small sample size tested and differences in baseline metabolic parameters between the two treatment groups. Namely, at the time of study enrolment, the 2‐h MMTT C‐peptide peak and AUC were notably higher in the G‐CSF‐treated group relative to placebo. Also of note, when samples were obtained and treatment administered in the same visit (weeks 0, 2, 4, 6, 8 and 10), blood was drawn and metabolic tests were performed prior to G‐CSF or placebo delivery; therefore, aside from the week 1 time‐point, there was a 2‐week delay between treatment and immunological analyses. Had sampling been performed at weeks 3, 5, 7, 9 and 11, CBC values and G‐CSF serum levels may have been elevated similarly as observed in week 1. Thus, it is possible that failure to detect increased circulating Treg frequency may have been due to the blood draw timing, but further investigation would be required to confirm this hypothesis. Overall, the information reported here continues to suggest that a synergistic mechanism of action is required between ATG and G‐CSF, as neither monotherapy failed to preserve C‐peptide 27.
The lack of statistical correlation between serum G‐CSF levels and neutrophil counts may be the result of tachyphylaxis in a subset of patients (observed elevations in serum G‐CSF without corresponding increases in circulating neutrophils); however, in some patients the opposite was true (low serum G‐CSF with high neutrophil counts), suggesting that the timing of sampling may have impacted these observations. Mechanistic effects, such as increased neutrophil and total WBC numbers, were observed in the majority (but not all) of G‐CSF‐treated subjects. This is not entirely surprising, given previous reports of defective stem cell mobilization with G‐CSF therapy in patients with diabetes 5, 6, but may also be attributable to age‐, sex‐ and time‐dependent fluctuations in neutrophil numbers which can occur, independently of drug intervention 28. These findings suggest a need to test G‐CSF in combination with immunodepleting agents, such as ATG 16, 29, 30 or anti‐CD3 (unpublished observations of anti‐CD3 and G‐CSF in mice demonstrate synergy), in order to generate efficacious immunological and metabolic effects. This notion will be important in directing the design and analysis of future combination therapy efforts utilizing G‐CSF. In addition to G‐CSF, alternative mobilizing agents such as Plerixafor (Mozobil), which have been shown to mobilize stem cells in diabetes patients more effectively than G‐CSF 31, 32, should be explored in combination with ATG.
G‐CSF robustly mobilizes neutrophils and is safe for clinical use in the context of T1D. These data support the continued testing of mobilizing agents, especially in combination with immunodepleting agents, where synergistic efficacy has already been observed 16.
Disclosure
The authors declare no known disclosures. M. J. H. is the guarantor of this work and as such takes responsibility for the data reported herein. He affirms that the work reported in this manuscript complies with the Ethical Policies of Clinical and Experimental Immunology and has been conducted under internationally accepted ethical standards.
Author contributions
M. J. H. conceived the study, researched the data and wrote the manuscript; M. A. and D. S. contributed to discussion and reviewed/edited the manuscript; C. W. contributed to discussion and reviewed/edited the manuscript, M. H., K. M., C. E. M., T. B. and M. C. researched the data and reviewed/edited the manuscript, J. S. analysed the data and A. P. analysed the data and wrote the manuscript. All authors read and approved the content of the manuscript.
Supporting information
Additional Supporting information may be found in the online version of this article at the publisher's web‐site:
Fig. S1. For individuals treated with granulocyte colony‐stimulating factor (G‐CSF) (black) versus placebo (red), (a) neutrophil counts (×103/μl) in peripheral whole blood and (b) serum G‐CSF levels (pg/ml) are shown over time. Correlation between serum G‐CSF level and neutrophil count was not statistically significant at (c) week 1 (P = 0·1468, R 2 = 0·1983), (d) week 2 (P = 0·1961, R 2 = 0·1610), (e) week 6 (P = 0·0628, R 2 = 0·3047) and (f) week 12 (P = 0·0827, R 2 = 0·2711) for subjects treated with G‐CSF (black circles) or placebo [red squares, P = not significant (n.s.)]. G‐CSF or placebo was administered on weeks 0, 2, 4, 6, 8 and 10. When samples were collected and treatment given in the same visit (weeks 0, 2, 4, 6, 8 and 10), blood was drawn prior to treatment administration.
Fig. S2. (a) CD4+ : CD8+ T cell ratio and (b) CD45RA+ : CD45RO+ CD4+ T cell ratio were comparable across individuals treated with granulocyte colony‐stimulating factor (G‐CSF) (black circles) and placebo (red squares) [P = not significant (n.s.), two‐way analysis of variance (anova)]. There was no difference in peripheral blood regulatory T cell (Treg) frequency [forkhead protein box P3 (FoxP3)+ % of CD3+CD4+CD25+ lymphocytes] between G‐CSF (black circles) and placebo (red squares)‐treated subjects at weeks 0, 1, 2, 4, 6, 8, 10 and 12 as demonstrated by (c) mean ± standard error of the mean and (d) individual values (P = n.s., two‐way anova). (e) Absolute CD3+CD4+CD25+FoxP3+ Treg counts (*103/μl) in peripheral blood are shown for individuals receiving G‐CSF (black circles) or placebo (red squares) treatment. (f,g) CD25+CD127−/lo Tregs were also evaluated (percentage of CD3+CD4+ lymphocytes and absolute count), and no significant differences were found between the two treatment groups. (h–o) Serum G‐CSF levels (pg/ml) did not correlate with CD3+CD4+CD25+FoxP3+ Treg frequency during the 12‐week course of treatment. G‐CSF or placebo was administered on weeks 0, 2, 4, 6, 8 and 10. When samples were collected and treatment given in the same visit (weeks 0, 2, 4, 6, 8 and 10), blood was drawn prior to treatment administration.
Fig. S3. (a) White blood cell (WBC) counts (×103/μl) were elevated significantly in granulocyte colony‐stimulating factor (G‐CSF)‐treated subjects (black) compared to placebo‐treated controls (grey) at week 1 but were within reference intervals and were not significantly different between the groups during the remainder of the study [P < 0·01, two‐way analysis of variance (anova)]. The change (Δ) from baseline (screening visit) in C‐peptide (b) peak (pmol/ml) and (c) area under the curve (AUC) (pmol/ml/2 h) in response to mixed meal tolerance test (MMTT) was not significantly different between responders (black, n = 8) and non‐responders (grey, n = 4) to G‐CSF‐treatment [all P = not significant (n.s.), two‐way anova]. Responders were defined as experiencing > 1·5‐fold increase in circulating neutrophil and WBC counts at week 1, relative to baseline (week 0). G‐CSF or placebo was administered on weeks 0, 2, 4, 6, 8 and 10. When samples were collected and treatment given in the same visit (weeks 0, 2, 4, 6, 8 and 10), blood was drawn and MMTT performed prior to treatment administration.
Fig. S4. (a) Platelet (×103/μl), (b) red blood cell (RBC, × 106/μl) and (c) haematocrit (%) values were not affected significantly by treatment [all P = not significant (n.s.), two‐way analysis of variance (anova)]. granulocyte colony‐stimulating factor (G‐CSF) or placebo was administered on weeks 0, 2, 4, 6, 8 and 10. When samples were collected and treatment given in the same visit (weeks 0, 2, 4, 6, 8 and 10), blood was drawn prior to treatment administration.
Acknowledgement
The research described herein was supported by the JDRF 11‐2007‐825 and NIH DK078863. The REDCap resource for online data collection at the University of Florida Clinical and Translational Science Institute (CTSI) is supported by NIH (NCATS) grant UL1 TR000064. The authors would like to acknowledge and thank Sean McGrail for his skilled work performing the ELISAs.
References
- 1. Atkinson MA, von Herrath M, Powers AC, Clare‐Salzler M. Current concepts on the pathogenesis of type 1 diabetes – considerations for attempts to prevent and reverse the disease. Diabetes Care 2015; 38:979–88. [DOI] [PMC free article] [PubMed] [Google Scholar]
- 2. Unger J, Parkin C. Hypoglycemia in insulin‐treated diabetes: a case for increased vigilance. Postgrad Med 2011; 123:81–91. [DOI] [PubMed] [Google Scholar]
- 3. Tao B, Pietropaolo M, Atkinson M, Schatz D, Taylor D. Estimating the cost of type 1 diabetes in the U.S.: a propensity score matching method. PLOS ONE 2010; 5:e11501. [DOI] [PMC free article] [PubMed] [Google Scholar]
- 4. Ben Nasr M, D'Addio F, Usuelli V, Tezza S, Abdi R, Fiorina P. The rise, fall, and resurgence of immunotherapy in type 1 diabetes. Pharmacol Res 2015; 98:31–8. [DOI] [PubMed] [Google Scholar]
- 5. Ferraro F, Lymperi S, Mendez‐Ferrer S et al Diabetes impairs hematopoietic stem cell mobilization by altering niche function. Sci Transl Med 2011; 3:104ra101. [DOI] [PMC free article] [PubMed] [Google Scholar]
- 6. Fadini GP, Albiero M, Vigili de Kreutzenberg S et al Diabetes impairs stem cell and proangiogenic cell mobilization in humans. Diabetes Care 2013; 36:943–9. [DOI] [PMC free article] [PubMed] [Google Scholar]
- 7. Albiero M, Poncina N, Tjwa M et al Diabetes causes bone marrow autonomic neuropathy and impairs stem cell mobilization via dysregulated p66Shc and Sirt1. Diabetes 2014; 63:1353–65. [DOI] [PubMed] [Google Scholar]
- 8. Bendall LJ, Bradstock KF. GCSF: from granulopoietic stimulant to bone marrow stem cell mobilizing agent. Cytokine Growth Factor Rev 2014; 25:355–67. [DOI] [PubMed] [Google Scholar]
- 9. Sivakumar R, Atkinson MA, Mathews CE, Morel L. GCSF: a friend or foe? Immunome Res 2015; S2:007. doi: 10.4172/1745-7580.S2.007 [Google Scholar]
- 10. Rutella S. Granulocyte colony‐stimulating factor for the induction of T‐cell tolerance. Transplantation 2007; 84:S26–30. [DOI] [PubMed] [Google Scholar]
- 11. Rutella S, Bonanno G, Pierelli L et al Granulocyte colony‐stimulating factor promotes the generation of regulatory DC through induction of IL‐10 and IFN‐alpha. Eur J Immunol 2004; 34:1291–302. [DOI] [PubMed] [Google Scholar]
- 12. Kared H, Masson A, Adle‐Biassette H, Bach JF, Chatenoud L, Zavala F. Treatment with granulocyte colony‐stimulating factor prevents diabetes in NOD mice by recruiting plasmacytoid dendritic cells and functional CD4(+)CD25(+) regulatory T‐cells. Diabetes 2005; 54:78–84. [DOI] [PubMed] [Google Scholar]
- 13. Wang Y, Xiao Y, Zhong L et al Increased neutrophil elastase and proteinase 3 and augmented NETosis are closely associated with β‐cell autoimmunity in patients with type 1 diabetes. Diabetes 2014; 63:4239–48. [DOI] [PubMed] [Google Scholar]
- 14. Semerad CL, Liu F, Gregory AD, Stumpf K, Link DC. GCSF is an essential regulator of neutrophil trafficking from the bone marrow to the blood. Immunity 2002; 17:413–23. [DOI] [PubMed] [Google Scholar]
- 15. Couri CE, Oliveira MC, Stracieri AB et al C‐peptide levels and insulin independence following autologous nonmyeloablative hematopoietic stem cell transplantation in newly diagnosed type 1 diabetes mellitus. JAMA 2009; 301:1573–9. [DOI] [PubMed] [Google Scholar]
- 16. Haller MJ, Gitelman SE, Gottlieb PA et al Anti‐thymocyte globulin/G‐CSF treatment preserves β cell function in patients with established type 1 diabetes. J Clin Invest 2015; 125:448–55. [DOI] [PMC free article] [PubMed] [Google Scholar]
- 17. Korzenik JR, Dieckgraefe BK. An open‐labelled study of granulocyte colony‐stimulating factor in the treatment of active Crohn's disease. Aliment Pharmacol Ther 2005; 21:391–400. [DOI] [PubMed] [Google Scholar]
- 18. Dejaco C, Lichtenberger C, Miehsler W et al An open‐label pilot study of granulocyte colony‐stimulating factor for the treatment of severe endoscopic postoperative recurrence in Crohn's disease. Digestion 2003; 68:63–70. [DOI] [PubMed] [Google Scholar]
- 19. Zavala F, Abad S, Ezine S, Taupin V, Masson A, Bach JF. GCSF therapy of ongoing experimental allergic encephalomyelitis via chemokine‐ and cytokine‐based immune deviation. J Immunol 2002; 168:2011–9. [DOI] [PubMed] [Google Scholar]
- 20. Snir O, Lavie G, Achiron A et al GCSF enhances the adhesion of encephalitogenic T cells to extracellular matrix components: a possible mechanism for exacerbation of multiple sclerosis. J Neuroimmunol 2006; 172:145–55. [DOI] [PubMed] [Google Scholar]
- 21. Orban T, Sosenko JM, Cuthbertson D et al Pancreatic islet autoantibodies as predictors of type 1 diabetes in the Diabetes Prevention Trial – Type 1. Diabetes Care 2009; 32:2269–74. [DOI] [PMC free article] [PubMed] [Google Scholar]
- 22. Rahmati K, Lernmark A, Becker C et al A comparison of serum and EDTA plasma in the measurement of glutamic acid decarboxylase autoantibodies (GADA) and autoantibodies to islet antigen‐2 (IA‐2A) using the RSR radioimmunoassay (RIA) and enzyme linked immunosorbent assay (ELISA) kits. Clin Lab 2008; 54:227–35. [PubMed] [Google Scholar]
- 23. Harris PA, Taylor R, Thielke R, Payne J, Gonzalez N, Conde JG. Research electronic data capture (REDCap) – a metadata‐driven methodology and workflow process for providing translational research informatics support. J Biomed Inform 2009; 42:377–81. [DOI] [PMC free article] [PubMed] [Google Scholar]
- 24. von Vietinghoff S, Ley K. Homeostatic regulation of blood neutrophil counts. J Immunol 2008; 181:5183–8. [DOI] [PMC free article] [PubMed] [Google Scholar]
- 25. Hatzimichael E, Benetatos L, Stebbing J, Kapsali E, Panayiotopoulou S, Bourantas KL. Spontaneous splenic haematoma in a multiple myeloma patient receiving pegfilgrastim support. Clin Lab Haematol 2006; 28:416–8. [DOI] [PubMed] [Google Scholar]
- 26. Snyder RL, Stringham DJ. Pegfilgrastim‐induced hyperleukocytosis. Ann Pharmacother 2007; 41:1524–30. [DOI] [PubMed] [Google Scholar]
- 27. Gitelman SE, Gottlieb PA, Rigby MR et al Antithymocyte globulin treatment for patients with recent‐onset type 1 diabetes: 12‐month results of a randomised, placebo‐controlled, phase 2 trial. Lancet Diabetes Endocrinol 2013; 1:306–16. [DOI] [PMC free article] [PubMed] [Google Scholar]
- 28. Bain BJ, England JM. Normal haematological values: sex difference in neutrophil count. Br Med J 1975; 1:306–9. [DOI] [PMC free article] [PubMed] [Google Scholar]
- 29. Parker MJ, Xue S, Alexander JJ et al Immune depletion with cellular mobilization imparts immunoregulation and reverses autoimmune diabetes in nonobese diabetic mice. Diabetes 2009; 58:2277–84. [DOI] [PMC free article] [PubMed] [Google Scholar]
- 30. Xue S, Posgai A, Wasserfall C et al Combination therapy reverses hyperglycemia in NOD mice with established type 1 diabetes. Diabetes 2015; 64:3873–84. [DOI] [PMC free article] [PubMed] [Google Scholar]
- 31. Winkler IG, Pettit AR, Raggatt LJ et al Hematopoietic stem cell mobilizing agents G‐CSF, cyclophosphamide or AMD3100 have distinct mechanisms of action on bone marrow HSC niches and bone formation. Leukemia 2012; 26:1594–601. [DOI] [PubMed] [Google Scholar]
- 32. Fadini GP, Fiala M, Cappellari R et al Diabetes limits stem cell mobilization following G‐CSF but not plerixafor. Diabetes 2015; 64:2969–77. [DOI] [PMC free article] [PubMed] [Google Scholar]
Associated Data
This section collects any data citations, data availability statements, or supplementary materials included in this article.
Supplementary Materials
Additional Supporting information may be found in the online version of this article at the publisher's web‐site:
Fig. S1. For individuals treated with granulocyte colony‐stimulating factor (G‐CSF) (black) versus placebo (red), (a) neutrophil counts (×103/μl) in peripheral whole blood and (b) serum G‐CSF levels (pg/ml) are shown over time. Correlation between serum G‐CSF level and neutrophil count was not statistically significant at (c) week 1 (P = 0·1468, R 2 = 0·1983), (d) week 2 (P = 0·1961, R 2 = 0·1610), (e) week 6 (P = 0·0628, R 2 = 0·3047) and (f) week 12 (P = 0·0827, R 2 = 0·2711) for subjects treated with G‐CSF (black circles) or placebo [red squares, P = not significant (n.s.)]. G‐CSF or placebo was administered on weeks 0, 2, 4, 6, 8 and 10. When samples were collected and treatment given in the same visit (weeks 0, 2, 4, 6, 8 and 10), blood was drawn prior to treatment administration.
Fig. S2. (a) CD4+ : CD8+ T cell ratio and (b) CD45RA+ : CD45RO+ CD4+ T cell ratio were comparable across individuals treated with granulocyte colony‐stimulating factor (G‐CSF) (black circles) and placebo (red squares) [P = not significant (n.s.), two‐way analysis of variance (anova)]. There was no difference in peripheral blood regulatory T cell (Treg) frequency [forkhead protein box P3 (FoxP3)+ % of CD3+CD4+CD25+ lymphocytes] between G‐CSF (black circles) and placebo (red squares)‐treated subjects at weeks 0, 1, 2, 4, 6, 8, 10 and 12 as demonstrated by (c) mean ± standard error of the mean and (d) individual values (P = n.s., two‐way anova). (e) Absolute CD3+CD4+CD25+FoxP3+ Treg counts (*103/μl) in peripheral blood are shown for individuals receiving G‐CSF (black circles) or placebo (red squares) treatment. (f,g) CD25+CD127−/lo Tregs were also evaluated (percentage of CD3+CD4+ lymphocytes and absolute count), and no significant differences were found between the two treatment groups. (h–o) Serum G‐CSF levels (pg/ml) did not correlate with CD3+CD4+CD25+FoxP3+ Treg frequency during the 12‐week course of treatment. G‐CSF or placebo was administered on weeks 0, 2, 4, 6, 8 and 10. When samples were collected and treatment given in the same visit (weeks 0, 2, 4, 6, 8 and 10), blood was drawn prior to treatment administration.
Fig. S3. (a) White blood cell (WBC) counts (×103/μl) were elevated significantly in granulocyte colony‐stimulating factor (G‐CSF)‐treated subjects (black) compared to placebo‐treated controls (grey) at week 1 but were within reference intervals and were not significantly different between the groups during the remainder of the study [P < 0·01, two‐way analysis of variance (anova)]. The change (Δ) from baseline (screening visit) in C‐peptide (b) peak (pmol/ml) and (c) area under the curve (AUC) (pmol/ml/2 h) in response to mixed meal tolerance test (MMTT) was not significantly different between responders (black, n = 8) and non‐responders (grey, n = 4) to G‐CSF‐treatment [all P = not significant (n.s.), two‐way anova]. Responders were defined as experiencing > 1·5‐fold increase in circulating neutrophil and WBC counts at week 1, relative to baseline (week 0). G‐CSF or placebo was administered on weeks 0, 2, 4, 6, 8 and 10. When samples were collected and treatment given in the same visit (weeks 0, 2, 4, 6, 8 and 10), blood was drawn and MMTT performed prior to treatment administration.
Fig. S4. (a) Platelet (×103/μl), (b) red blood cell (RBC, × 106/μl) and (c) haematocrit (%) values were not affected significantly by treatment [all P = not significant (n.s.), two‐way analysis of variance (anova)]. granulocyte colony‐stimulating factor (G‐CSF) or placebo was administered on weeks 0, 2, 4, 6, 8 and 10. When samples were collected and treatment given in the same visit (weeks 0, 2, 4, 6, 8 and 10), blood was drawn prior to treatment administration.