

Summary
The innate immune system is currently seen as the probable initiator of events which culminate in the development of inflammatory bowel disease (IBD) with Toll‐like receptors (TLRs) known to be involved in this disease process. Many regulators of TLRs have been described, and dysregulation of these may also be important in the pathogenesis of IBD. The aim of this study was to perform a co‐ordinated analysis of the expression levels of both key intestinal TLRs and their inhibitory proteins in the same IBD cohorts, both ulcerative colitis (UC) and Crohn's disease (CD), in order to evaluate the potential roles of these proteins in the pathogenesis of IBD. Of the six TLRs (TLRs 1, 2, 4, 5, 6 and 9) examined, only TLR‐4 was increased significantly in IBD, specifically in active UC. In contrast, differential alterations in expression of TLR inhibitory proteins were observed. A20 and suppressor of cytokine signalling 1 (SOCS1) were increased only in active UC while interleukin‐1 receptor‐associated kinase 1 (IRAK‐m) and B cell lymphoma 3 protein (Bcl‐3) were increased in both active UC and CD. In contrast, expression of both peroxisome proliferator‐activated receptor gamma (PPARγ) and Toll interacting protein (Tollip) was decreased in both active and inactive UC and CD and at both mRNA and protein levels. In addition, expression of both PPARγ and A20 expression was increased by stimulation of a colonic epithelial cell line Caco‐2 with both TLR ligands and commensal bacterial strains. These data suggest that IBD may be associated with distinctive changes in TLR‐4 and TLR inhibitory proteins, implying that alterations in these may contribute to the pathogenesis of IBD.
Keywords: inflammatory bowel disease, PPARγ, regulation, Toll‐like receptor, Tollip
Introduction
The incidence of inflammatory bowel diseases (IBDs) such as Crohn's disease (CD) and ulcerative colitis (UC) has been increasing steadily during recent years. Although the aetiology of these diseases remains largely unknown, there is an accumulating body of evidence suggesting that, in genetically susceptible individuals, intestinal inflammation in IBD results from an alteration in the balance between resident microbes in the gut and the host immune response at the mucosal barrier 1.
The innate immune system is seen currently as the probable initiator of events which culminate in the development of IBD 1. A family of innate immune sensors, the Toll‐like receptors (TLRs), are essential in the host defence against pathogens. TLRs are found to be expressed on most intestinal immune cell types, including dendritic cells and intestinal epithelial cells (IECs), and as such play an essential role in the recognition of pathogenic infection in the intestine 2. Ten TLR family members have been identified in humans, each of which responds to different pathogen‐associated molecular patterns such as peptidoglycan (TLR‐2), viral dsRNA (TLR‐3), lipopolysaccharide (LPS) (TLR‐4), flagellin (TLR‐5) viral ssRNA (TLR‐7/8) and unmethylated cytosine–phosphate–guanine (CpG) DNA (TLR‐9). While the specific ligand for TLR‐10 is unknown, it has been shown recently to mediate the inflammatory response to both bacteria and viruses 3, 4. Activation of most TLRs results in the recruitment of the signalling adaptor molecule myeloid differentiation primary response gene 88 (MyD88) and subsequent activation of signalling pathways which culminate in phosphorylation and degradation of inhibitor of κB (IκB), and translocation of the transcription factor nuclear factor κB (NF‐κB) to the nucleus. In contrast, TLR‐3 recruits the adaptor Toll/interleukin (IL)‐1 receptor (TIR) domain‐containing adapter‐inducing interferon (IFN)‐β (TRIF) to mediate signal transduction. TLR signalling through these pathways is important in the recruitment of inflammatory cells and in the production of inflammatory cytokines in the intestine 5.
TLR activation can, however, be a double‐edged sword. While activation of these receptors is essential for promoting the innate immune response to combat infection, sustained inflammatory signalling from TLRs can be detrimental and members of the TLR family have been shown to be involved in the pathogenesis of autoimmune, inflammatory and infectious disease. TLRs have been implicated in several gastrointestinal (GI) disorders including colon cancer, colitis and coeliac disease 5. The expression pattern of several TLRs in the intestine has been investigated. TLR‐4, for example, is expressed normally throughout the intestine at low levels in both the epithelium and in lamina propria mononuclear cells, but its expression is reported to be increased in IBD, indicating that increased TLR‐4 expression may contribute to the initiation and maintenance of intestinal inflammation 5, 6. TLR‐2 and TLR‐8 have also been reported to be augmented in IBD, implying that these TLRs may also contribute to the excessive inflammation associated with IBD 1.
It is clear, therefore, that the intensity and duration of the TLR response must be tightly controlled in order to maintain the balance between appropriate and inappropriate activation of the immune system in the intestine. Several of the expanding family of TLR inhibitory proteins have been found to be expressed strongly within, and to be essential in the regulation of, TLRs in the GI tract, namely single immunoglobulin receptor related (SIGIRR), A20, peroxisome proliferator‐activated receptor gamma (PPARγ), IL‐1 receptor‐associated (IRAK)‐m and Toll interacting protein (TOLLIP) 2. Of these, SIGIRR−/− mice 7, PPARγ+/− mice 8 and mice with an IEC‐specific deficiency in A20 9 have all been shown to have increased susceptibility to intestinal inflammation. In addition, PPARγ is currently being explored as a potential therapeutic target for IBD, given the observation that PPARγ ligands have been shown to reduce the severity of experimental colitis 8. However, despite the clear possibility that these TLR inhibitory proteins may be involved in the pathogenesis of IBD, only a few reports have investigated expression of these in IBD cohorts with fewer, if any, reports examining expression of multiple TLRs and their inhibitory proteins in the same cohort of IBD patients. The aim of this study, therefore, was to perform a co‐ordinated analysis of the expression levels of both key intestinal TLRs and their inhibitory proteins in both UC and CD in order to evaluate the potential role of these in the pathogenesis of IBD.
Materials and methods
Reagents
Lipopolysaccharide (LPS), flagellin and Pam3‐Cys‐Ser‐Lys4 (Pam3Csk4) were purchased from Invivogen (San Diego, CA, USA). Antibodies for SIGIRR (ab25875), Tollip (ab187198) and PPARγ (ab19481) were obtained from Abcam (Cambridge, MA, USA). The antibody for A20 (59A426) was obtained from Novus Biologicals (Abingdon, Oxford, UK). Rabbit anti‐mouse immunoglobulin/horseradish peroxidase (HRP) and goat anti‐mouse/HRP were purchased from Dako (Carpinteria, CA, USA). Donkey anti‐rabbit immunoglobulin/fluorescein isothiocyanate (FITC) was purchased from Dako. The PPARγ agonist, troglitazone, was purchased from Calbiochem (San Diego, CA, USA).
Study population
The study protocol, including all procedures, was approved by the University College Cork Clinical Research Ethics Committee of the Cork Teaching Hospitals. All patients were recruited from speciality gastroenterology clinics at Cork University Hospital, Cork, Ireland. Biopsies were obtained from patients with IBD with either active or inactive UC or CD, as diagnosed by conventional clinical, endoscopic and radiological criteria. The determination of active/inactive was made at time of endoscopy with no grading of the severity of the activity. Biopsies were obtained from healthy controls undergoing routine screening. The demographics of the study population are shown in Table 1.
Table 1.
Clinical characteristics of study populations.
| Ulcerative colitis | Crohn's disease | Healthy population | |
|---|---|---|---|
| Male : female | 1 : 10 (total 22) | 11 : 8 (total 19) | 12 : 9 (total 21) |
| Median age (range) (years) | 42 (21–68) | 35 (19–57) | 50 (21–71) |
| Median duration of disease (range) (years) | 3·3 (0·2–25) | 4 (0.17–34) | |
| Medications | |||
| 5‐ASA 0·3–1·3 g/day | 12 | 8 | |
| Topical treatment | 8 | 0 | |
| Anti‐tumour necrosis factor therapies | 0 | 2 | |
| Oral steroid | 4 | 8 | |
| 10–35 mg/day | |||
| Azathioprine | 3 | 2 | |
| 100–250 mg/day | |||
| 6‐MP 50–100 mg/day | 2 | 1 | |
| No medication | 2 | 5 | |
5‐ASA = 5‐aminosalicylic acid; MP = 6‐mercaptopurine.
Biopsy collection
Following prior administration of a single Fleet's enema (Lynchburg, VA, USA) 1 h prior to the procedure, subjects were placed in the left lateral position and a flexible sigmoidoscopy performed with a flexible video‐colonoscope. Biopsies were taken from a predefined and consistent location immediately proximal to the junction of the sigmoid colon and rectum using a jumbo biopsy forceps (FB‐5OU‐1; Olympus Corporation, Tokyo, Japan). Biopsies were taken from the same place in UC (rectosigmoid junction) and from active lesions in CD, and from the rectosigmoid junction in controls. All biopsies were processed immediately.
Biopsy processing
For RNA expression analysis, biopsies were placed immediately and stored overnight in RNALater (Ambion, Poole, Dorset, UK) at 4°C. Following overnight saturation, the biopsies were placed in fresh RNALater and stored at −80°C until further analysis. One biopsy per patient was processed for immunofluorescence (IF) and one for immunohistochemistry (IHC). For IF, biopsies were fixed in 4% paraformaldehyde overnight, washed in phosphate‐buffered saline (PBS), and then placed in 30% sucrose overnight and stored at −80°C until further analysis. For IHC, tissues were fixed in 10% neutral buffered formalin and paraffin‐embedded.
Quantitative real‐time reverse transcription–polymerase chain reaction (qRT–PCR)
Total RNA was isolated using the GenElute Mammalian Total RNA Mini kit (Sigma‐Aldrich, St Louis, MO, USA), according to the manufacturer's instructions. cDNA synthesized using M‐MLV reverse transcriptase (Sigma‐Aldrich), random hexanucleotide primers, RNasin (40 U) and dNTPs (500 mM) (Promega, Madison, WI, USA). RT–PCR for all genes was performed using the LightCycler480 System (Roche Diagnostics, Burgess Hill, UK). Individual PCR primer pairs and probes were designed using the Roche Universal Probe Library Assay Design Centre (https://www.roche-applied-science.com/sis/rtpcr/upl/adc.jsp) (Table 2). The 2−ΔΔCT method was used to calculate relative changes in the gene expression determined from the real‐time qRT–PCR experiments. For human samples pooled control and IBD biopsy cDNA was used as the calibrator control for analysis of differential gene expression. For cell lines, transcript levels were normalized to the amount of glyceraldehyde‐3‐phosphate dehydrogenase (GAPDH) or β‐actin mRNA and expression levels shown as fold induction relative to untreated.
Table 2.
Quantitative reverse transcription–polymerase chain reaction (qRT–PCR) primers and corresponding universal probe library (UPL) probe numbers.
| Gene | DNA sequence (sense 5′–3′) | DNA sequence (anti‐sense 5′‐3′) | UPL probe number |
|---|---|---|---|
| β actin | ATTGGCAATGAGCGGTTC | TGAAGGTAGTTTCGTGGATGC | 11 |
| TLR‐1 | CCTAGCAGTTATCACAAGCTCAAA | TCTTTTCCTTGGGCCATTC | 79 |
| TLR‐2 | CGTTCTCTCAGGTGACTGCTC | TCTCCTTTGGATCCTGCTTG | 14 |
| TLR‐4 | CTGCGTAGACCAGAAAGC | TTCAGCTCCATGCATTGATAA | 33 |
| TLR‐5 | GACACAATCTCGGCTGACTG | TCAGGAACATGAACATACAATCTG | 16 |
| TLR‐6 | TGAAACAGTCTCTTTTGGTAAATGC | CAGAATCCATTTGGGAAAGC | 55 |
| TLR‐8 | TGTGGTTGTTTTCTGGATTCAA | GCTCGCATGGCTTACATGA | 79 |
| TLR‐9 | CCAGACCCTCTGGAGAAGC | GTAGGAAGGCAGGCAAGGT | 81 |
| A20 | TGCACACTGTGTTTCATCGAG | ACGCTGTGGGACTGACTTTC | 74 |
| RP105 | TCTGCCGGCTGTAAAGTCAT | GTCAGGGATTTCACTGAGACCT | 79 |
| Bcl‐3 | GCCTCAGCTCCAATGGTC | GAGGAGCCATGGGGAATC | 9 |
| SOCS1 | CCCCTGGTTGTTGTAGCAG | GTAGGAGGTGCGAGTTCAGG | 36 |
| SIGIRR | AGCTCTTGGATCAGTCTGCTG | GGCCCTATCACAGACACCTG | 36 |
| Tollip | CAACCTCGTCATGTCCTACG | GCTGGTACACTGTTGGCATC | 38 |
| IRAK‐m | AGAGCTCTGCGCTGTTCTG | GCTGCTTGAAAGTCTCTCTCTGC | 26 |
| PPARγ | TGACAGGAAAGACAACAGACAAAT | GGGTGATGTGTTTGAACTTGATT | 7 |
| IL‐6 | CAGGAGCCCAGCTATGAACT | GAAGGCAGCAGGCAACAC | 7 |
TLR = Toll‐like receptor; Bcl‐3 = B cell lymphoma 3 protein; SOCS1 = suppressor of cytokine signalling 1; Tollip = Toll interacting protein; IRAK = interleukin‐1 receptor‐associated kinase 1; PPARγ = proliferator‐activated receptor gamma; IL = interleukin.
Immunofluorescence
Single biopsies were embedded in optimal cutting temperature (OCT) embedding medium and stored at −20°C. Cryostat sections (8‐μm‐thick) were mounted on poly‐L‐lysine‐coated glass slides. Slides were incubated with PBS with 0·1% Triton X100 (PBS‐T) for 30 min. Non‐specific binding sites were blocked by incubating with PBS‐T +5% donkey serum (Sigma‐Aldrich) for 1 h at room temperature in a humidified chamber. Primary antibodies were diluted 1 : 1000 and incubated with the tissue sample overnight at 4°C in a humidified chamber. Slides were washed ×3 with PBS‐T prior to incubation with secondary antibody for 1 h. Both primary and secondary antibodies were diluted in PBS‐T with 5% donkey serum. Controls were treated as above omitting the primary antibodies. Immunofluorescence was visualised on an Olympus BX51 microscope using an Olympus DP71 camera.
Immunohistochemistry
Immunohistochemical staining was performed in 4‐μm‐thick formalin‐fixed, paraffin‐embedded whole‐section slides. Sections were deparaffinized in xylene and rehydrated prior to analysis. Antigen retrieval was performed by microwave irradiation in 0·01 M citrate buffer, pH 6·0. Slides were washed twice for 5 min in a wash buffer containing 50 mM Tris‐Cl, pH 7·6; 50 mM NaCl; 0·001% saponin. Endogenous peroxidase was quenched with 3·0% hydrogen peroxide in methanol for 10 min. Non‐specific binding was blocked using 5% normal serum in wash buffer for 1 h. Sections were incubated overnight at 4°C with primary antibody. The PPARγ antibody was diluted 1 : 1000 and the A20 antibody diluted 1 : 50. Primary antibody binding was localized using a biotinylated secondary antibody, and visualized using avidin‐conjugated HRP and diaminobenzidine (DAB) substrate, contained within the Vectastain avidin–biotin complex (ABC) detection kit (Vector Laboratories, Burlingame, CA, USA). Slides were counterstained with haematoxylin and eosin (H&E) and mounted. Parallel negative controls were performed for each antibody, using rabbit immunoglobulin (Ig)G instead of the primary antibody.
Bacterial culture
Lactobacillus salivarius subsp. salivarius was obtained from ATCC (Rockville, MD, USA) and cultured at 37°C under anaerobic conditions for 24 h in de Man–Rogosa–Sharpe broth (Oxoid, Basingstoke, UK). Escherichia coli HB101K‐12 (German Collection of Microorganisms and Cell Cultures, Braunschweig, Germany) was cultured in lysogeny broth at 37°C under aerobic conditions for 24 h with constant shaking. Bacteroides fragilis CIT01, kindly provided by Dr Jim O'Mahony, Cork Institute of Technology, was cultured at 37°C under anaerobic conditions for 24 h in brain heart infusion broth (Oxoid) supplemented with 0·05%l‐cysteine hydrochloride (Sigma, Dorset, UK). Plate counts were performed for each strain with the respective agar plates to enumerate the bacterial number.
Prior to incubation with mammalian cells, bacteria were washed with PBS by two steps of centrifugation (4000 g for 5 min) and diluted in PBS for stimulating at a ratio of bacteria : cells of 10 : 1.
Cell culture
Caco2 colon epithelial cells were obtained from ATCC. Cells were maintained in Dulbecco's modified Eagle's medium (DMEM) containing 10% fetal calf serum (FCS) and penicillin/streptomycin. Cells were seeded at 2 × 10⁵ cells/ml unless stated otherwise, cultured overnight, and then either stimulated with TLR ligands, pretreated with troglitazone (10 µM) for 1 h prior to TLR ligand stimulation or co‐incubated with bacteria for 4 h as per the figure legends. Following co‐incubation, cells were washed twice in cold PBS and RNA isolated as above.
Statistical analysis
All qRT–PCR expression data were subjected to a one‐way analysis of variance (Anova) with Bonferroni's post‐test. Values of P < 0·001 are indicated by three asterisks (***). Values of P < 0·01 are indicated by two asterisks (**). Values of P < 0·05 are indicated by one asterisk (*). All tests were performed using GraphPad statistical software.
Results
TLR‐4 expression is increased in ulcerative colitis and Crohn's disease
Given the link between IBD and the commensal bacterial flora, we initially investigated expression of the TLRs known to be involved in bacterial sensing in both UC and CD; namely, TLRs ‐1, ‐2, ‐4, ‐5, ‐6 and ‐9 5. We performed qRT–PCR for these TLRs on biopsy tissue from 21 healthy controls (HC), from 10 UC patients with signs of active disease, from 12 UC patients with inactive disease, from 10 patients with active CD patients and from nine patients with inactive CD. We were able to detect expression of all six TLRs using qRT–PCR in the colonic biopsies from all subjects (Fig. 1a). Some interpatient variation in expression of TLRs was observed, with some TLR transcripts not being detectable in all samples. Of these, we observed a statistically significant increase only in TLR‐4, where expression was increased 13‐fold in active UC compared to healthy controls (HC) (P < 0·001) (Fig. 1). While a slight increase in expression of TLR‐4 was seen in the inactive UC population and in both CD populations in comparison to HC, it was not statistically significant. The remaining TLRs were unchanged in their expression compared to healthy controls. Given that, of the bacterial sensing TLRs, only TLR‐4 was observed to have altered expression, we subsequently investigated expression of one of the TLRs known to be involved in viral sensing, TLR‐8. Expression of TLR‐8 was also seen to not be altered significantly in either UC or CD (Fig. 1b).
Figure 1.
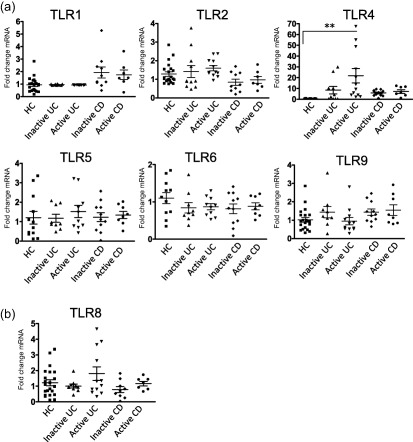
Toll‐like receptor (TLR‐4) expression is increased in active ulcerative colitis (UC) compared to healthy controls. Quantitative reverse transcription–polymerase chain reaction (qRT–PCR) analysis of TLR genes was assessed in UC, Crohn's disease (CD) and healthy controls (HC). Data were normalized to a β‐actin and expressed using the 2−ΔΔCT method. Statistical analysis was performed using one‐way analysis of variance (anova) with Bonferroni post‐test. **P < 0·01.
TLR regulatory proteins are differentially expressed in IBD
As minimal alterations in the expression levels of the TLRs examined were observed, we subsequently examined the expression of a range of TLR inhibitory proteins in the same tissue. As many of these have been described 10, we focused predominantly on those that have been shown to play a regulatory role in the intestine examining expression of SIGIRR, A20, PPARγ, IRAK‐m, Tollip, SOCS1and B cell lymphoma 3 protein (Bcl‐3) 2, 11. We also examined expression of RP105, as this is reported to suppress TLR activation in B cells and B cells are a well‐established intestinal immune cell type 12. We observed significant alterations in expression of six of these. A20, SOCS1, IRAK‐m and Bcl3 were seen to have increased expression in IBD (Fig. 2a). Of these, A20 and SOCS1 expression was increased significantly in the active UC population (P < 0·01). Expression of IRAK‐m was elevated in both active UC and active CD (P < 0·01) and Bcl3 expression was elevated strongly in inflamed UC (P < 0·001) and also increased in both active and inactive CD (P < 0·01) (Fig. 2a). In contrast to the findings in Fig. 2a, expression of both Tollip and PPARγ was found to be deceased significantly in IBDs relative to HC (Fig. 2b). Indeed, expression of Tollip was decreased significantly in both active and inactive UC (P < 0·001) and also decreased in both active and inactive CD (P < 0·01). PPARγ also showed strongly suppressed expression in active UC, inactive CD and active CD (P < 0·001) with suppression also observed, albeit to a slightly lesser level, in inactive UC (P < 0·01) (Fig. 2b). Neither SIGIRR nor RP105 exhibited any alteration in expression in either UC or CD (Fig. 2c).
Figure 2.
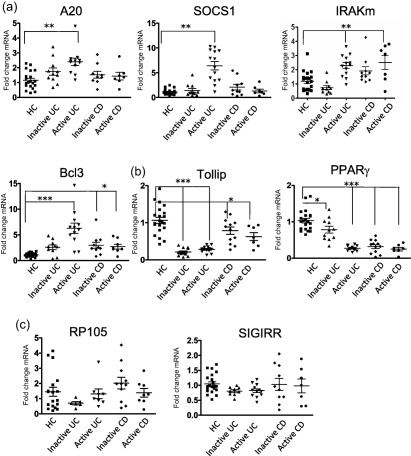
Expression of Toll‐like receptor (TLR‐4) inhibitory proteins is altered differentially in inflammatory bowel disease (IBD) populations. Quantitative reverse transcription–polymerase chain reaction (qRT–PCR) analysis of known TLR inhibitor genes was assessed in ulcerative colitis (UC), Crohn's disease (CD) and healthy controls (HC). A20, suppressor of cytokine signalling 1 (SOCS1), interleukin‐1 receptor‐associated kinase 1 (IRAK‐m) and B cell lymphoma 3 protein (Bcl‐3) mRNA was up‐regulated in IBD (a). Tollip and peroxisome proliferator‐activated receptor gamma (PPARγ) mRNA was downregulated in IBD (b) and RP105 and single immunoglobulin receptor‐related (SIGIRR) mRNA displayed no alteration in expression (c). Data were normalized to a β‐actin and expressed using the 2−ΔΔCT method. Statistical analysis was performed using one‐way analysis of variance (anova) with Bonferroni post‐test *P < 0·05, **P < 0·01 and ***P < 0·001.
Observations in alterations in expression of Tollip, SIGIRR and PPARγ were confirmed at the protein level using immunofluorescence for Tollip and SIGIRR and IHC for PPARγ (Fig. 3). Expression of both Tollip and PPARγ was observed to be predominantly in the epithelial cells, while expression of SIGIRR was observed in both the epithelial cells and the immune cell populations. Protein expression of both Tollip and PPARγ was observed to be decreased strongly in both active UC and active CD tissues in comparison to healthy control (Fig. 3a,b), with no robust alteration in the protein expression of SIGIRR observed (Fig. 3c). The level of protein expression of A20 was also investigated by immunohistochemistry. While expression of A20 was detected in the sections from healthy volunteers, this expression was seen to be localized predominantly to the immune cell populations. In both UC and CD populations, the expression of A20 was also detected in the epithelial cells (Fig. 3d). H&E staining was also performed on sections from all three population groups, demonstrating increased cellular infiltration, angiogenesis and inflammation in the IBD cohorts (Fig. 3e).
Figure 3.
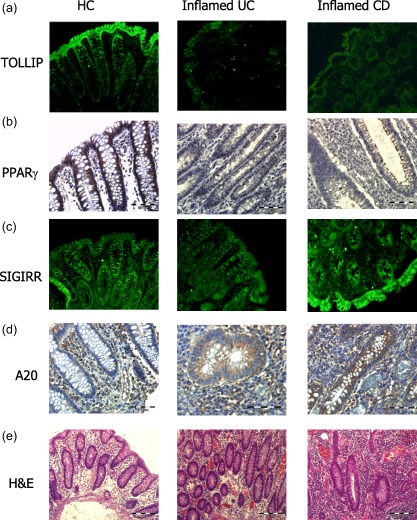
Protein expression of Toll interacting protein (Tollip), peroxisome proliferator‐activated receptor gamma (PPARγ), single immunoglobulin receptor‐related (SIGIRR) and A20. Tollip, PPARγ and SIGIRR protein expression were detected in colonic sections of both inflammatory bowel disease (IBD) and healthy controls (HC). Tollip and SIGIRR expression was assessed by immunofluorescence, magnification ×20 exposure for 3 s (a,c) and PPARγ and A20 expression assessed by immunohistochemistry, magnification ×40 (b,d). Haematoxylin and eosin (H&E) staining was performed (e). Data shown are representative of 10 patients per group.
Taken together, these results indicate an impaired expression of the TLR regulatory proteins PPARγ and Tollip in the colons of both UC and CD patients, with increased expression of A20 in the epithelial cells, relative to HC, which may contribute to the deleterious inflammation associated with IBD.
Stimulation of the intestinal epithelial cell line Caco‐2 with TLR ligands increases expression of PPARγ and A20
As an aberrant response to the intestinal flora has been associated with the pathogenesis of IBD, we subsequently wished to determine the ability of TLR‐mediated signals to effect expression of TLR regulatory proteins. Caco‐2 colonic epithelial cells were selected for these experiments as expression of Tollip, PPARγ and SIGIRR had been noted as being particularly strong in the epithelium. Cells were stimulated with ligands for TLR‐4 (LPS), TLR‐5 (flagellin) and TLR 2/1 (Pam3Csk4). None of these ligands induced a significant change in mRNA expression of either Tollip (Fig. 4a) or SIGIRR (Fig. 4b). Both LPS and flagellin stimulation resulted in increased expression of PPARγ (P < 0·01) while Pam3Csk4 had no effect (Fig. 4c). In contrast, both flagellin and Pam3Csk4 stimulation resulted in increased expression of A20 (P < 0·01) (Fig. 4d). These results indicate that TLR ligands regulate expression of PPARγ and A20 selectively in this colonic cell line.
Figure 4.

Peroxisome proliferator‐activated receptor gamma (PPARγ) and A20 expression is increased by Toll‐like receptor (TLR) ligands. Caco‐2 cells were stimulated with lipopolysaccharide (LPS) (100 ng/ml), flagellin (100 ng/ml) and Pam3‐Cys‐Ser‐Lys4 (Pam3Csk4) (1 μg/ml) for 8 h. Quantitative reverse transcription–polymerase chain reaction (qRT–PCR) analysis was performed on the stimulated cells and expression of Toll interacting protein (Tollip) (a), single immunoglobulin receptor‐related (SIGIRR) (b), PPARγ (c) and A20 (d) assessed. Results shown are representative of three separate experiments. Values are shown as mean ± standard error of the mean (n = 3). Statistical analysis was performed using one‐way analysis of variance (anova) with Bonferroni post‐test. **P < 0·01.
Commensal bacteria E. coli K12 and B. fragilis increase expression of PPARγ and A20 in the intestinal epithelial cell line Caco2
As altered microbiota populations have been associated with IBD patients 13 and, as such, the composition of the commensal flora may account for the altered expression of some of the TLR inhibitors seen in Figs 2 and 3, we finally wished to investigate the ability of commensal bacteria to regulate expression of these proteins in the intestine. Caco‐2 cells were co‐incubated with three strains of commensal flora; L. salivarius, E. coli K12 and B. fragilis) and mRNA expression of TLR regulatory proteins assessed. Similar to stimulations with TLR ligands, expression of Tollip was not seen to be increased with any of the bacterial strains investigated (Fig. 5a). Interestingly, expression of SIGIRR was seen to be reduced significantly following stimulation with B. fragilis (P < 0·01) (Fig. 5b). Similar to findings in Fig. 4, the expression levels of PPARγ (P < 0·01) and A20 (P < 0·001) were increased following co‐incubation with the bacterial strains E. coli K12 and B. fragilis (Fig. 5c,d). These results indicate that expression of these proteins can be influenced directly by the commensal flora.
Figure 5.
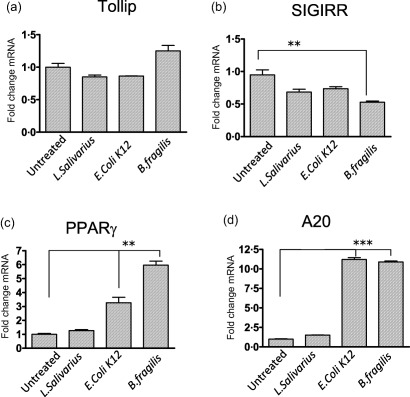
Single immunoglobulin receptor‐related (SIGIRR) expression is decreased, while peroxisome proliferator‐activated receptor gamma (PPARγ) and A20 expression is increased, by stimulation with commensal bacterial strains. Caco‐2 cells were treated with three different bacterial strains (Lactobacillus salivarius, Escherichia coli K12 and Bacteroides fragilis) at a ratio of bacteria : cells of 10 : 1 for 8 h. Quantitative reverse transcription–polymerase chain reaction (qRT–PCR) analysis was performed on the stimulated cells and expression of Toll interacting protein (Tollip) (a), SIGIRR (b), PPARγ (c) and A20 (d) assessed. Results shown are representative of three separate experiments. Values are shown as mean ± standard error of the mean (n = 3). Statistical analysis was performed using one‐way analysis of variance (anova) with Bonferroni post‐test. **P < 0·01 and ***P < 0·001.
Treatment of Caco‐2 cells with a PPARγ agonist inhibits both LPS‐ and flagellin‐induced IL‐6 production
As expression of PPARγ had been observed to be reduced strongly in the IBD cohort (Figs 2b,3b), with expression of PPARγ increased by both TLR and bacterial stimulation (Figs 4c,5c), we wished to examine further the functional effect of PPARγ on TLR‐induced responses in the Caco2 cell line. In order to study this, we utilized a well‐characterized PPARγ agonist troglitazone. Pretreatment of Caco2 cells with troglitazone, prior to stimulation of the cells with either LPS or flagellin, was seen to inhibit the ability of these stimuli to cause an induction of the proinflammatory cytokine IL‐6 (Fig. 6), thereby confirming that PPARγ is a functional inhibitor of TLR‐induced inflammation in intestinal epithelial cells. Taken together, these data indicate that the reduced expression of PPARγ seen in IBD may play a role in allowing excessive signalling from TLRs and therefore contribute to the intestinal inflammation associated with these diseases.
Figure 6.
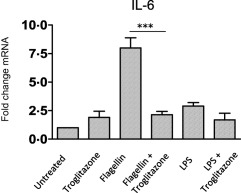
The peroxisome proliferator‐activated receptor gamma (PPARγ) agonist, troglitazone, reduces lipopolysaccharide (LPS) and flagellin‐induced interleukin (IL)‐6 production. Caco‐2 cells were pretreated with Troglitazone (10 µM) for 1 h prior to stimulation with lipopolysaccharide (LPS) (100 ng/ml) or flagellin (100 ng/ml). Quantitative reverse transcription–polymerase chain reaction (qRT–PCR) analysis was performed on the stimulated cells and expression of interleukin (IL)‐6 assessed. Results shown are representative of three separate experiments. Values are shown as Mean ± standard error of the mea (n = 3). Statistical analysis was performed using one‐way analysis of variance (anova) with Bonferroni post‐test. ***P < 0·001.
Discussion
In the present study we have investigated comprehensively the expression levels of bacterial sensing TLRs and several of their inhibitory proteins in the same cohort of IBD patients. We have shown that of these TLRs, only TLR‐4 expression is increased in IBD, specifically in active UC. In contrast, we observed distinct alterations in the expression patterns of several TLR inhibitory proteins with a noticeable suppression in expression of two of these; PPARγ and TOLLIP in both UC and CD and in both active and inactive disease states. Moreover, we also investigated the regulation of expression of these in a colonic cell line and have shown that only PPARγ and A20 expression is altered by both TLR ligands and commensal bacterial strains.
While many previous studies have investigated the expression pattern in TLRs in the intestine, these have been performed predominantly on intestinal cell lines or in murine tissues 1. Those studies examining expression of TLRs in human IBD samples have usually investigated the expression of just one or two individual TLRs in either UC or CD. Here we have performed a comprehensive analysis of the TLRs shown to be involved in bacterial sensing (TLR‐1, ‐2, ‐4, ‐5, ‐6 and ‐9), in both active and inactive CD and UC, and have found only TLR‐4 mRNA to be augmented, with this increase in expression restricted to the active UC cohort. This finding is in keeping with other reports also showing augmented expression of TLR‐4 in IBD 14, 15, 16, 17, 18, and indeed with the large body of literature supporting a role for TLR‐4 in the pathogenesis of IBD 19. Interestingly, we observed no increase in the expression of TLR‐2, or of the TLR‐2 co‐receptors TLR‐1 and ‐6, in any of our IBD populations. The role of TLR‐2 in IBD remains controversial, with certain murine studies demonstrating a detrimental role for TLR‐2 in IBD, while another study utilizing multiple murine IBD models indicated that TLR‐2 plays no role in the pathogenesis of IBD 20, 21. Similarly, TLR‐2 has been reported in some studies to be increased in both active UC and active CD 15, 18, 22 and similar to our findings, other studies have shown no change in TLR‐2 expression at either mRNA or protein level in IBD 14. The lack of alteration in TLR‐2 expression seen here is suggestive of a lack of a role for TLR‐2 in the pathogenesis of IBD. We also observed no alterations in TLR‐5 expression in our cohort of IBD patients. This is in contrast to reports showing either decreased 23 or increased 17 expression of TLR‐5 in UC. Similarly, in contrast to one previous report 24, we also observed no alteration in the expression of TLR‐8. These differences in reported expression patterns could be due to varying demographics of the patient cohorts, their treatment regimens at time of biopsy or to handling of the biopsies post‐surgery. It remains clear, however, that the consistent finding across all these reports is the augmented expression of TLR‐4, potentially highlighting the critical role of this TLR, as opposed to the others, in the pathogenesis of UC.
Given the relatively low alterations in TLR expression observed in our IBD cohorts, we subsequently hypothesized that dysregulation of expression of TLR inhibitory proteins may play a dominant role in facilitating the inflammation associated with IBD. To date, several of the expanding family of TLR inhibitory proteins have been found to be expressed in the GI tract and have been shown, predominantly using murine models, to functionally suppress both TLR responses and intestinal inflammation 2. Similar to TLRs few, if any, studies have examined expression of more than one of these proteins at any time, therefore not providing a full overview of the relative importance of these proteins in an IBD population. Our studies have identified differential regulation of a number of these proteins in the same cohort of IBD patients. Expression of several of these was seen to increase in the active UC population (A20, SOCS1, IRAK‐m and Bcl‐3), with both IRAK‐m and Bcl‐3 also increased in the CD populations. These proteins are known to be induced by transcription factors, e.g. NF‐κB, which are activated by inflammatory signal transduction pathways. Thus, this up‐regulation of inhibitory proteins is probably a positive feedback mechanism to limit the inflammation seen in IBD. Clearly, however, given the level of inflammation evident in both UC and CD, simultaneous up‐regulation of these proteins is not sufficient to contain the inflammatory response associated with IBD.
SIGIRR, described as an inhibitor of IL‐1, IL‐33 and TLR responses 25, has been shown in murine models of colitis to play an essential role in regulating intestinal inflammation 26. In contrast to data shown by Kadota et al., wherein they reported reduced expression of SIGIRR in UC 27, we observed no alterations in the expression of the inhibitor protein SIGIRR in any of our cohorts by either qRT–PCR or by IF. While it is possible that the difference in these results could be due to differing patient groups or different treatment regimens, it could also be due to the smaller patient cohort characterized in the study of Kodata et al. 27. Indeed, it is interesting that we also found no alteration of SIGIRR mRNA following TLR ligand stimulation, with a slight decrease of SIGIRR expression following stimulation with B. fragilis. Further work is necessary, especially in human samples, to elucidate clearly the importance of SIGIRR in regulating intestinal inflammation.
Conversely, PPARγ expression was down‐regulated in both UC and CD and also seen to be down‐regulated in both active and inactive populations. While our findings for PPARγ in UC are in keeping with other reports 28, 29, to the best of our knowledge this expression pattern has not been observed previously for PPARγ in CD. This pattern of expression was shown at both mRNA and protein levels. Both the TLR4 ligand (LPS) and commensal bacteria were also seen to increase expression of PPARγ in an intestinal epithelial cell line. In addition, similar to data shown previously in the HT29 intestinal epithelial cell line 30, here we have confirmed a functional role for PPARγ as an inhibitor of intestinal inflammation, as treatment of cells with a PPARγ ligand reduced TLR‐induced inflammation. It seems, therefore, that under normal homeostatic conditions, signalling through TLRs by either pathogenic or commensal flora up‐regulates expression of PPARγ. In IBD, however, despite increased TLR‐4 expression, the level of the regulator PPARγ is suppressed. While the aetiology underlying this reduced expression of PPARγ remains unknown, it is tempting to speculate that there may be an innate inability of IBD patients to up‐regulate PPARγ in response to TLR stimuli. This may be due to specific promoter mutations or epigenetic regulation of the PPARγ gene. Irrespective of the mechanism, findings presented here confirm further the importance of PPARγ as a potential contributory factor in the pathogenesis of UC 30 and may extend its role to potentially also being a key regulatory protein in CD.
A similar suppression in expression of Tollip was observed in both UC and CD and in both active and inactive disease. Tollip has been shown to inhibit TLR responses in IECs 31. While the Tollip knock‐out mouse does not develop spontaneous colitis, Tollip deficiency aggravated spontaneous disease onset in IL‐10 mice and increased susceptibility to dextran sulphate sodium (DSS) colitis 32. Our data indicate that individuals susceptible to the development of IBD may have an inability to up‐regulate Tollip expression and that this may contribute to intestinal inflammation. As we did not observe any effect on Tollip expression upon stimulation of cells with either TLR ligands or commensal bacteria, the mechanism of regulation of Tollip expression in the intestine remains unclear. The transcription factor Elf‐1 has been recently shown to negatively regulate the Tollip gene in Caco‐2 cells, and as such it is a possibility that IBD patients may have elevated levels of this transcription factor 33.
As all members of our cohorts displayed reduced levels of both Tollip and PPARγ, it is tempting to speculate that that the combined reduction in both of these TLR repressor proteins facilitates the uncontrolled TLR‐mediated inflammation associated with IBD. As such, it is possible that therapeutically targeting these in isolation may not be sufficient to redress the inflammation in IBD. Further studies are required, particularly on human specimens, to elucidate fully the role of these proteins in the pathogenesis of IBD.
Disclosure
The authors have no disclosures to declare.
Author contributions
P. F., T. D., A. F. and J. M. S. performed experiments, F. S. obtained the biopsies, E. B. designed the study and A. H. and E. B. wrote the manuscript.
Acknowledgements
This work was supported by a grant to E. B. from Science Foundation Ireland, 10/RFP/BIC2737. We would also like to acknowledge Ms Helen McCarthy for excellent technical assistance.
References
- 1. Walsh D, McCarthy J, O'Driscoll C, Melgar S. Pattern recognition receptors–molecular orchestrators of inflammation in inflammatory bowel disease. Cytokine Growth Factor Rev 2013; 24:91–104. [DOI] [PubMed] [Google Scholar]
- 2. Shibolet O, Podolsky DK. TLRs in the gut. IV. Negative regulation of Toll‐like receptors and intestinal homeostasis: addition by subtraction. Am J Physiol Gastrointest Liver Physiol 2007; 292:G1469–73. [DOI] [PubMed] [Google Scholar]
- 3. Regan T, Nally K, Carmody R et al Identification of TLR10 as a key mediator of the inflammatory response to Listeria monocytogenes in intestinal epithelial cells and macrophages. J Immunol 2013; 191:6084–92. [DOI] [PubMed] [Google Scholar]
- 4. Lee SM, Kok KH, Jaume M et al Toll‐like receptor 10 is involved in induction of innate immune responses to influenza virus infection. Proc Natl Acad Sci USA 2014; 111:3793–8. [DOI] [PMC free article] [PubMed] [Google Scholar]
- 5. Gribar SC, Richardson WM, Sodhi CP, Hackam DJ. No longer an innocent bystander: epithelial Toll‐like receptor signaling in the development of mucosal inflammation. Mol Med 2008; 14:645–59. [DOI] [PMC free article] [PubMed] [Google Scholar]
- 6. Abreu MT, Vora P, Faure E, Thomas LS, Arnold ET, Arditi M. Decreased expression of Toll‐like receptor‐4 and MD‐2 correlates with intestinal epithelial cell protection against dysregulated proinflammatory gene expression in response to bacterial lipopolysaccharide. J Immunol 2001; 167:1609–16. [DOI] [PubMed] [Google Scholar]
- 7. Xiao H, Gulen MF, Qin J et al The Toll‐interleukin‐1 receptor member SIGIRR regulates colonic epithelial homeostasis, inflammation, and tumorigenesis. Immunity 2007; 26:461–75. [DOI] [PubMed] [Google Scholar]
- 8. Annese V, Rogai F, Settesoldi A, Bagnoli S. PPARgamma in inflammatory bowel disease. PPAR Res 2012; 2012:620839. [DOI] [PMC free article] [PubMed] [Google Scholar]
- 9. Vereecke L, Sze M, Mc Guire C et al Enterocyte‐specific A20 deficiency sensitizes to tumor necrosis factor‐induced toxicity and experimental colitis. J Exp Med 2010; 207:1513–23. [DOI] [PMC free article] [PubMed] [Google Scholar]
- 10. Liew FY, Xu D, Brint EK, O'Neill LA. Negative regulation of toll‐like receptor‐mediated immune responses. Nat Rev Immunol 2005; 5:446–58. [DOI] [PubMed] [Google Scholar]
- 11. O'Carroll C, Moloney G, Hurley G et al Bcl‐3 deficiency protects against dextran‐sodium sulphate‐induced colitis in the mouse. Clin Exp Immunol 2013; 173:332–42. [DOI] [PMC free article] [PubMed] [Google Scholar]
- 12. Divanovic S, Trompette A, Atabani SF et al Negative regulation of Toll‐like receptor 4 signaling by the Toll‐like receptor homolog RP105. Nat Immunol 2005; 6:571–8. [DOI] [PMC free article] [PubMed] [Google Scholar]
- 13. Loh G, Blaut M. Role of commensal gut bacteria in inflammatory bowel diseases. Gut Microbes 2012; 3:544–55. [DOI] [PMC free article] [PubMed] [Google Scholar]
- 14. Cario E, Podolsky DK. Differential alteration in intestinal epithelial cell expression of toll‐like receptor 3 (TLR3) and TLR4 in inflammatory bowel disease. Infect Immun 2000; 68:7010–7. [DOI] [PMC free article] [PubMed] [Google Scholar]
- 15. Furrie E, Macfarlane S, Thomson G, Macfarlane GT, Microbiology Gut Biology G, Tayside Tissue & Tumour Bank. Toll‐like receptors‐2, ‐3 and ‐4 expression patterns on human colon and their regulation by mucosal‐associated bacteria. Immunology 2005; 115:565–74. [DOI] [PMC free article] [PubMed] [Google Scholar]
- 16. Hausmann M, Kiessling S, Mestermann S et al Toll‐like receptors 2 and 4 are up‐regulated during intestinal inflammation. Gastroenterology 2002; 122:1987–2000. [DOI] [PubMed] [Google Scholar]
- 17. Sanchez‐Munoz F, Fonseca‐Camarillo G, Villeda‐Ramirez MA et al Transcript levels of Toll‐like receptors 5, 8 and 9 correlate with inflammatory activity in ulcerative colitis. BMC Gastroenterol 2011; 11:138. [DOI] [PMC free article] [PubMed] [Google Scholar]
- 18. Szebeni B, Veres G, Dezsofi A et al Increased expression of Toll‐like receptor (TLR) 2 and TLR4 in the colonic mucosa of children with inflammatory bowel disease. Clin Exp Immunol 2008; 151:34–41. [DOI] [PMC free article] [PubMed] [Google Scholar]
- 19. Cario E. Toll‐like receptors in inflammatory bowel diseases: a decade later. Inflamm Bowel Dis 2010; 16:1583–97. [DOI] [PMC free article] [PubMed] [Google Scholar]
- 20. Cario E. Barrier‐protective function of intestinal epithelial Toll‐like receptor 2. Mucosal Immunol 2008; 1 (Suppl. 1):S62–6. [DOI] [PubMed] [Google Scholar]
- 21. Boulard O, Asquith MJ, Powrie F, Maloy KJ. TLR2‐independent induction and regulation of chronic intestinal inflammation. Eur J Immunol 2010; 40:516–24. [DOI] [PMC free article] [PubMed] [Google Scholar]
- 22. Frolova L, Drastich P, Rossmann P, Klimesova K, Tlaskalova‐Hogenova H. Expression of Toll‐like receptor 2 (TLR2), TLR4, and CD14 in biopsy samples of patients with inflammatory bowel diseases: upregulated expression of TLR2 in terminal ileum of patients with ulcerative colitis. J Histochem Cytochem 2008; 56:267–74. [DOI] [PMC free article] [PubMed] [Google Scholar]
- 23. Stanislawowski M, Wierzbicki PM, Golab A et al Decreased Toll‐like receptor‐5 (TLR‐5) expression in the mucosa of ulcerative colitis patients. J Physiol Pharmacol 2009; 60 (Suppl. 4):71–5. [PubMed] [Google Scholar]
- 24. Steenholdt C, Andresen L, Pedersen G, Hansen A, Brynskov J. Expression and function of toll‐like receptor 8 and Tollip in colonic epithelial cells from patients with inflammatory bowel disease. Scand J Gastroenterol 2009; 44:195–204. [DOI] [PubMed] [Google Scholar]
- 25. Garlanda C, Anders HJ, Mantovani A. TIR8/SIGIRR: an IL‐1R/TLR family member with regulatory functions in inflammation and T cell polarization. Trends Immunol 2009; 30:439–46. [DOI] [PubMed] [Google Scholar]
- 26. Garlanda C, Riva F, Veliz T et al Increased susceptibility to colitis‐associated cancer of mice lacking TIR8, an inhibitory member of the interleukin‐1 receptor family. Cancer Res 2007; 67:6017–21. [DOI] [PubMed] [Google Scholar]
- 27. Kadota C, Ishihara S, Aziz MM et al Down‐regulation of single immunoglobulin interleukin‐1R‐related molecule (SIGIRR)/TIR8 expression in intestinal epithelial cells during inflammation. Clin Exp Immunol 2010; 162:348–61. [DOI] [PMC free article] [PubMed] [Google Scholar]
- 28. Dubuquoy L, Jansson EA, Deeb S et al Impaired expression of peroxisome proliferator‐activated receptor gamma in ulcerative colitis. Gastroenterology 2003; 124:1265–76. [DOI] [PubMed] [Google Scholar]
- 29. Yamamoto‐Furusho JK, Penaloza‐Coronel A, Sanchez‐Munoz F, Barreto‐Zuniga R, Dominguez‐Lopez A. Peroxisome proliferator‐activated receptor‐gamma (PPAR‐gamma) expression is downregulated in patients with active ulcerative colitis. Inflamm Bowel Dis 2011; 17:680–1. [DOI] [PubMed] [Google Scholar]
- 30. Bertin B, Dubuquoy L, Colombel JF, Desreumaux P. PPAR‐gamma in ulcerative colitis: a novel target for intervention. Curr Drug Targets 2013; 14:1501–7. [DOI] [PubMed] [Google Scholar]
- 31. Otte JM, Cario E, Podolsky DK. Mechanisms of cross hyporesponsiveness to Toll‐like receptor bacterial ligands in intestinal epithelial cells. Gastroenterology 2004; 126:1054–70. [DOI] [PubMed] [Google Scholar]
- 32. Maillard MH, Bega H, Uhlig HH et al Toll‐interacting protein modulates colitis susceptibility in mice. Inflamm Bowel Dis 2014; 20:660–70. [DOI] [PubMed] [Google Scholar]
- 33. Sugi Y, Takahashi K, Nakano K, Hosono A, Kaminogawa S. Transcription of the Tollip gene is elevated in intestinal epithelial cells through impaired O‐GlcNAcylation‐dependent nuclear translocation of the negative regulator Elf‐1. Biochem Biophys Res Commun 2011; 412:704–9. [DOI] [PubMed] [Google Scholar]