Abstract
Indirect calorimeter is a powerful tool to monitor resting energy metabolism through the measurement of oxygen (O2) consumption and carbon dioxide (CO2) production. From the measurement of VO2 and VCO2, the respiratory exchange ratio (RER) can be calculated to assess energy fuel utilization and energy expenditure (Evan et al., 2012). Previously, indirect calorimeter has been widely used in metabolic disease research in mice to reveal the potential roles of specific genes or treatments in regulating energy metabolism (for example: Bi et al., 2014; Feng et al., 2014). Here, we described a protocol to evaluate the resting energy metabolism of C57BL/6 mice during dark and light cycles using the Oxymax Open Circuit indirect calorimeter.
Materials and Reagents
Adult mice (C57BL/6 male mice at 3-month old were used for data acquisition in this protocol, but male or female mice of other genetic backgrounds or strains, at different ages can be used)
Food (normal chow diet or high fat diet) and water (ad lib)
Compressed gas mixture with the components of 4,929 PPM CO2, 20.47% O2 and Balance N2
Equipment
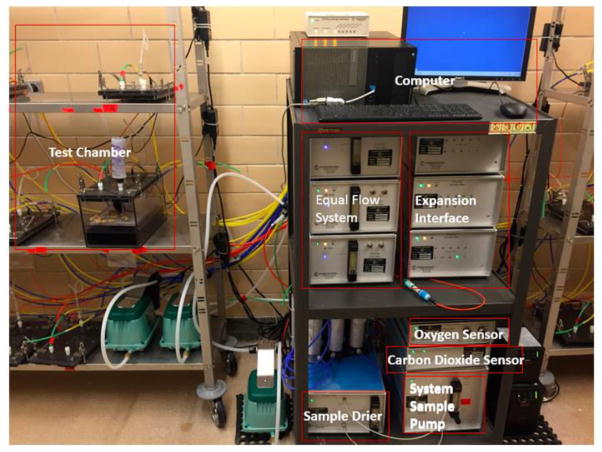
Oxymax Open Circuit Indirect Calorimeter (Columbus Instruments, model: Open Circuit Indirect Calorimeter) (Figure 1)
Computer with software provided by the manufacture (Columbus Instruments, model: Oxymax v4.91)
Figure 1.
Open circuit indirect calorimeter components
Procedure
Turn on the Oxymax instrument and computer, allowing the system to warm up for 2 h;
Start the Oxymax v4.91 program;
-
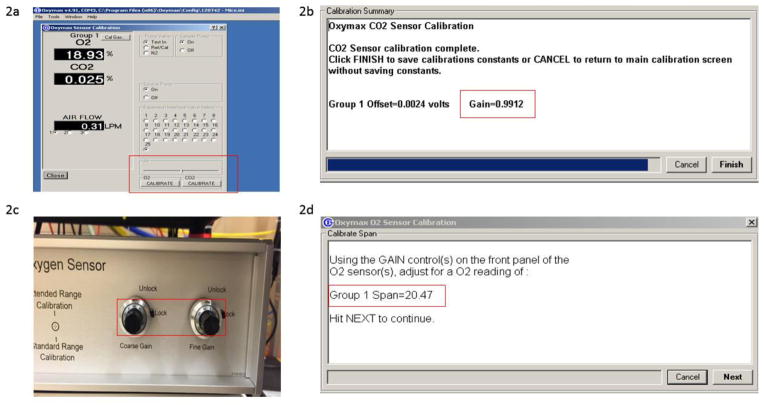
Perform CO2 calibration;
-
Perform O2 calibration;
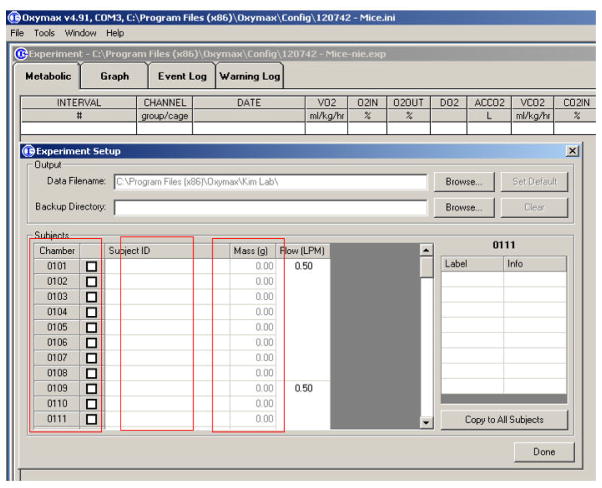
Setup a new experiment, choose the chambers to be used, input the Identification number and weight of mice to be measured (Figure 3), only one mouse is allowed per chamber;
Setup the measurement schedule including number of Intervals, time of cage settle, cage measure, reference settle, reference measure, and reference method (Figure 4).
Place the mice in the corresponding calorimetric chambers, standard cages are used (Figure 5);
Fill the cage with sufficient food and water for a period of 24 h. Ensure that food and water are available ad libitum (Figure 5);
-
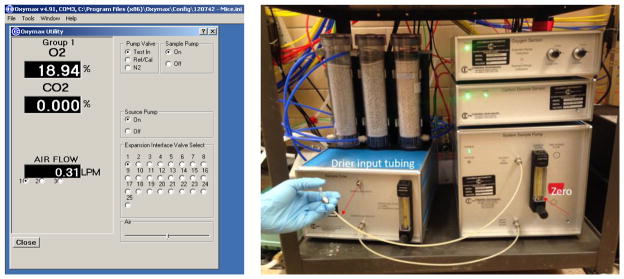
Check if there is any leakage in the system with software as follows:
Open Tools
 Select Sample Pump from Oxymax utility
 Ensure Test in Valve open and N2 and Ref Air/Cal Valve closed
 Turn Sample Pump ON
 Select the chamber to be tested in Expansion Interface Disconnect drier input tubing from tested chamber
 put the finger over it, If there is no system leaks, the ball on the front of the system sample pump will drop to 0; If not, check all air fittings to assure an air-tight connection and test it again (Figure 6).
 -
Run the experiment for 24 h and export the data in Excel file format, which include the data listed as below:
O2 consumption = (VO2 input) − (VO2 output), ml/kg/h;
CO2 production = (VCO2 output) − (VCO2) input, ml/kg/h;
Respiratory exchange ratio (RER) = VCO2/VO2 Ratio;
Energy Expenditure (Heat production) = calorific value (Cv) x VO2 =(3.815 + 1.232 x RER) x VO2, cal/h;
Close the experiment and return the mice to their home cages;
Turn off the system and clean the calorimetry with water and appropriate disinfectant.
Figure 2.
CO2 and O2 calibration
Figure 3.
Input of mouse information
Figure 4. Setup schedule for measurement.
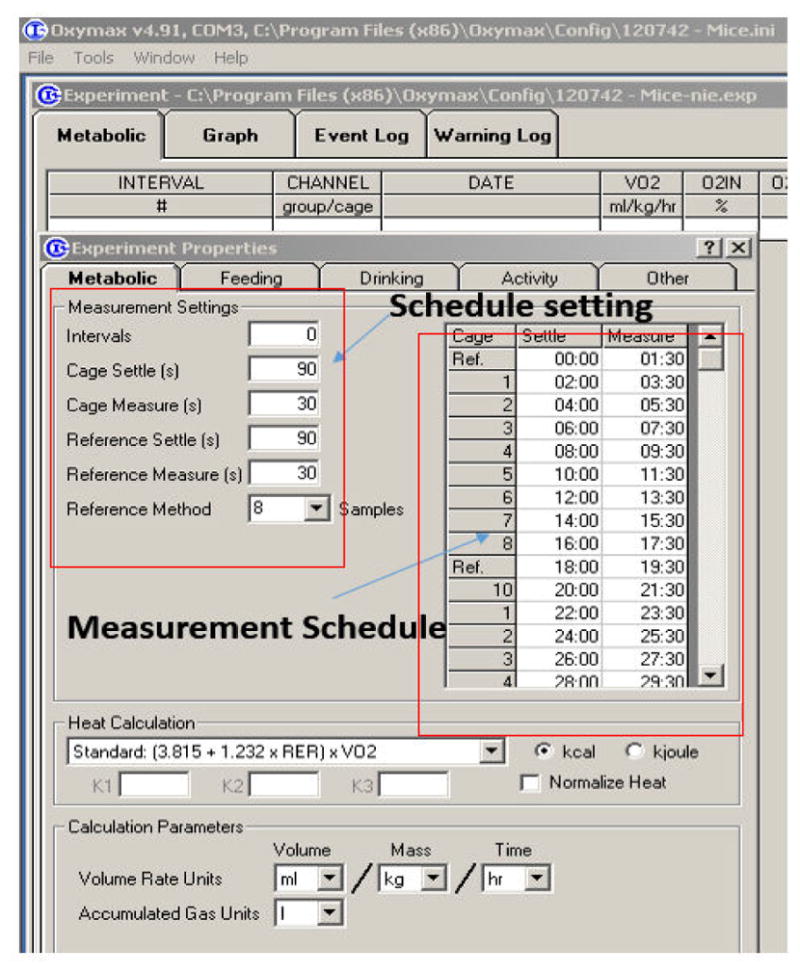
“0” for intervals means the experiment will run indefinitely until stopped by the user. “8” for reference methods means the experiment will measure the reference air after every 8 subjects.
Figure 5.
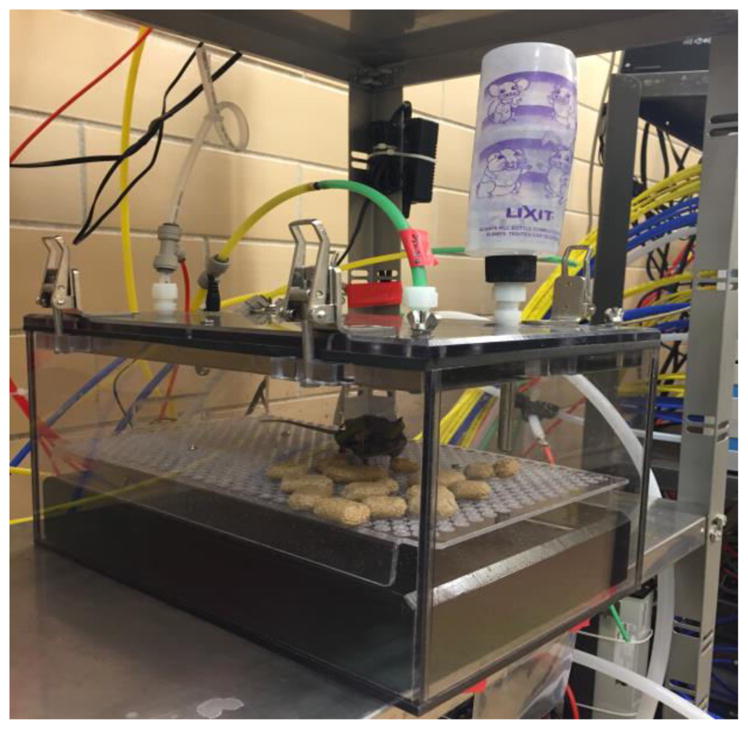
Test chamber for mice (standard cage)
Figure 6.
Gas leakage check
Notes
Begin data collection of mice after 1-day of acclimation in the metabolic chambers;
Install the Oxymax system under a constant environmental temperature (22 °C) and 12 h light (6 am–6 pm), 12 h dark cycle (6 pm–6 am);
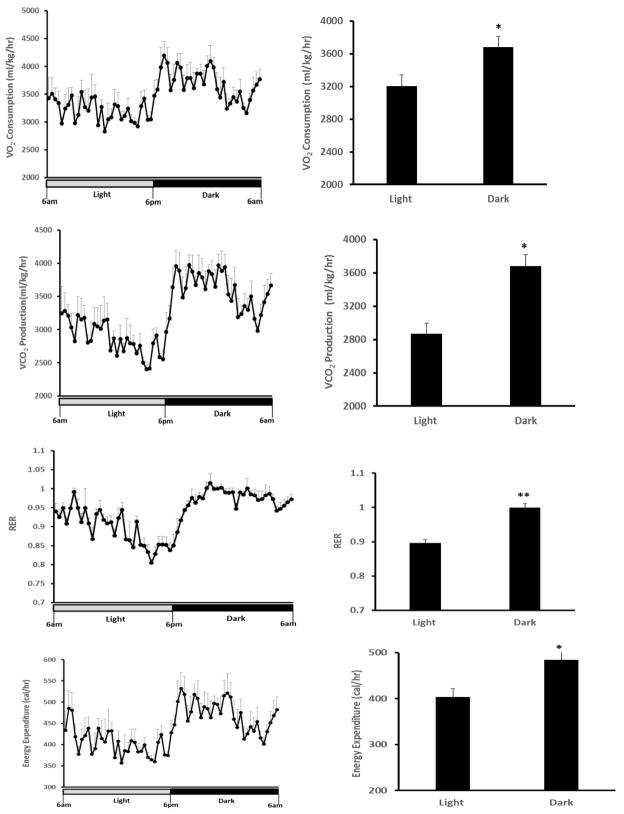
VO2 and VCO2 were increased by approximately 15% and 28% in dark cycle, respectively;
RER was increased from 0.90 (light cycle) to 0.99 (dark cycle), suggesting a shift in macronutrient source from a mix of fat + carbohydrates to predominant carbohydrates in the dark cycle (the VCO2/VO2 ratio of fatty acid oxidation is 0.7 and carbohydrates oxidation is 1.0);
Energy expenditure was 20% greater in dark than light cycle, with the most active phase of mice being between 7 pm–12 pm;
-
Indirect calorimetry is a versatile system to investigate alternations of metabolic rate under different conditions. For example:
To compare metabolic homeostasis and energy expenditure in wild type and mutant mice fed with normal chow diet or high-fat-diet;
To investigate changes in metabolic rate with aging, a potential indicator of improved health status.
Oxymax open circuit indirect calorimeter can also be incorporated with other chamber systems, such as activity, body mass, feeding, drinking, food access control, running wheel, urine collection, sleep detection, body core temperature and heart rate to fulfill different experimental designs.
Figure 7. O2 consumption, CO2 production, RER and Energy Expenditure of 3-month old C57BL6 mice during light and dark cycle.
The daily rhythms of metabolic parameters were recorded under a 12 h-light (open bar) and 12 h-dark cycle (black bar) (Left). Data were presented as Means ± SE (n = 5) during light and dark cycle (right). *, p < 0.05; **, p < 0.01 analyzed by the Student’s t-test (comparison of mean values between the light and dark cycles).
References
- 1.Bi P, Shan T, Liu W, Yue F, Yang X, Liang XR, Wang J, Li J, Carlesso N, Liu X, Kuang S. Inhibition of Notch signaling promotes browning of white adipose tissue and ameliorates obesity. Nat Med. 2014;20(8):911–918. doi: 10.1038/nm.3615. [DOI] [PMC free article] [PubMed] [Google Scholar]
- 2.Even PC, Nadkarni NA. Indirect calorimetry in laboratory mice and rats: principles, practical considerations, interpretation and perspectives. Am J Physiol Regul Integr Comp Physiol. 2012;303(5):R459–476. doi: 10.1152/ajpregu.00137.2012. [DOI] [PubMed] [Google Scholar]
- 3.Feng B, Jiao P, Helou Y, Li Y, He Q, Walters MS, Salomon A, Xu H. Mitogen-activated protein kinase phosphatase 3 (MKP-3)-deficient mice are resistant to diet-induced obesity. Diabetes. 2014;63(9):2924–2934. doi: 10.2337/db14-0066. [DOI] [PMC free article] [PubMed] [Google Scholar]


